Recent Blogs
3 MIN READ
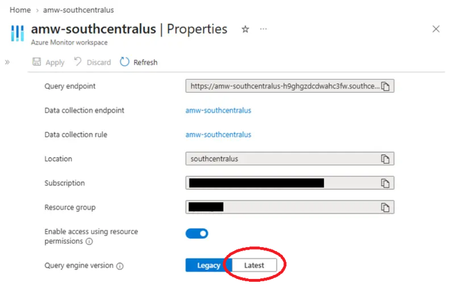
TL;DR: Bare regex matchers like pod=~"foo" will soon return only exact matches, not substring matches. If you rely on =~ for "starts with" or "contains" semantics, update your queries to add .* befor...
Sep 17, 2026243Views
0likes
0Comments
4 MIN READ
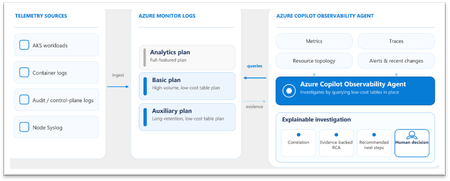
Cloud environments can generate large volumes of application, infrastructure, audit, and platform logs. Moving eligible tables to the Basic or Auxiliary table plan can help control costs while keepin...
Sep 03, 2026399Views
0likes
0Comments
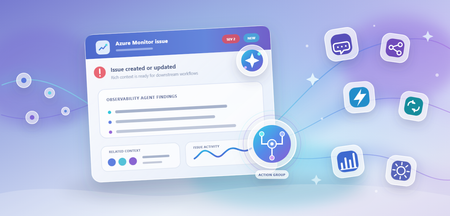
When the Azure Copilot Observability Agent detects a problem, correlates related alerts, investigates and creates an Azure Monitor issue, it does more than identify what happened. It creates a durabl...
Aug 20, 2026315Views
0likes
0Comments
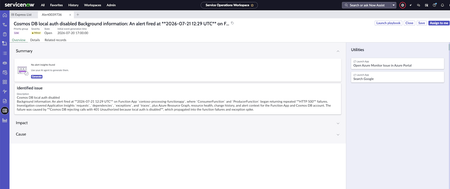
Operational problems rarely stay within one monitoring tool. Azure Monitor may detect and investigate a service degradation, while operations teams manage ownership, escalation, and resolution in an ...
Aug 16, 2026435Views
0likes
0Comments
5 MIN READ
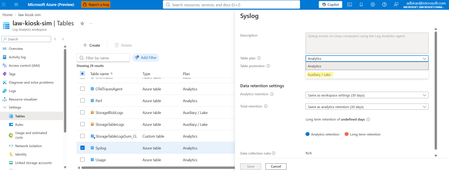
Three long-standing customer requests for the Auxiliary table plan in Log Analytics are now generally available:
Azure table support. Auxiliary now covers a subset of standard Azure tables, selec...
Aug 12, 2026764Views
0likes
0Comments
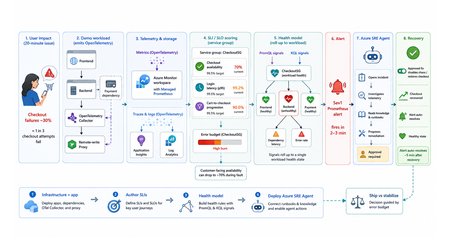
TL;DR This walkthrough uses a small e-commerce demo app to show how Azure Monitor can measure a user journey with service level indicators (SLIs) and service level objectives (SLOs), roll those resul...
Aug 11, 20261.3KViews
5likes
0Comments
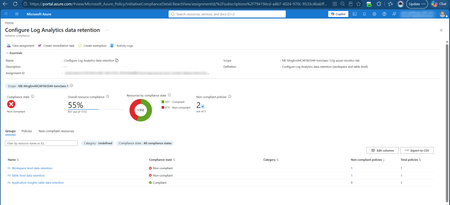
A Log Analytics workspace stores its data in tables, and data retention can be configured at two levels:
Workspace level: a default interactive (Analytics) retention that applies to the whole wor...
Jul 31, 2026544Views
2likes
0Comments
Azure Monitor Logs sharing to Microsoft Fabric is now in public preview. In just a few steps, you can share the logs you already send to a Log Analytics workspace with OneLake in Delta Parquet—the op...
Jul 29, 2026624Views
2likes
0Comments
6 MIN READ
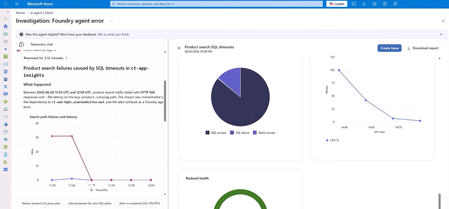
Generative AI (GenAI) agents are moving from prototypes to production, running as part of real distributed applications. When a Microsoft Foundry agent slows down, returns errors, or spikes in token ...
Jul 21, 2026478Views
2likes
0Comments
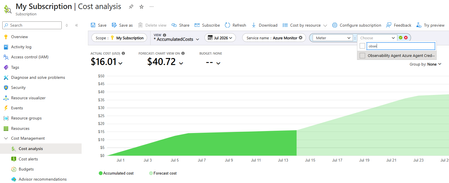
The Azure Copilot Observability Agent brings an agentic investigation experience directly into Azure Monitor. Teams can chat with their observability data, run deep investigations across application ...
Jul 16, 2026725Views
0likes
1Comment
Tags
- azure monitor225 Topics
- updates101 Topics
- application insights56 Topics
- opentelemetry41 Topics
- application monitoring33 Topics
- azure managed grafana32 Topics
- azure kubernetes service22 Topics
- msignite15 Topics
- Microsoft Build 20245 Topics