Turn on suggestions
Auto-suggest helps you quickly narrow down your search results by suggesting possible matches as you type.
- Home
- Microsoft 365
- Excel
- Problem with Date axis on Excel 365
Problem with Date axis on Excel 365
Discussion Options
- Subscribe to RSS Feed
- Mark Discussion as New
- Mark Discussion as Read
- Pin this Discussion for Current User
- Bookmark
- Subscribe
- Printer Friendly Page
- Mark as New
- Bookmark
- Subscribe
- Mute
- Subscribe to RSS Feed
- Permalink
- Report Inappropriate Content
Dec 07 2022 11:32 AM
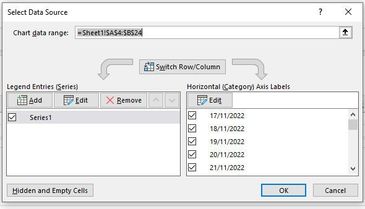
I am trying to plot some values (Y axis) with dates on the X axis.
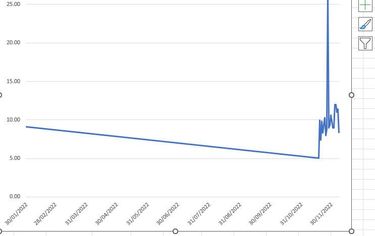
When I choose the dates as the horizontal axis the correct dates are not shown correctly.
The dates are displayed as the last day of each month, so as my dates are in November and December all the plot is up one end of the graph.
I could not see anything in the Format Axis to change this.
1 Reply
- Mark as New
- Bookmark
- Subscribe
- Mute
- Subscribe to RSS Feed
- Permalink
- Report Inappropriate Content
Dec 07 2022 12:06 PM
It looks like there must be at least one date in January. Perhaps a typo?

