- Home
- Microsoft 365
- Excel
- How to highlight specific data in dynamic charts.
How to highlight specific data in dynamic charts.
- Subscribe to RSS Feed
- Mark Discussion as New
- Mark Discussion as Read
- Pin this Discussion for Current User
- Bookmark
- Subscribe
- Printer Friendly Page
- Mark as New
- Bookmark
- Subscribe
- Mute
- Subscribe to RSS Feed
- Permalink
- Report Inappropriate Content
Mar 05 2021 07:44 PM
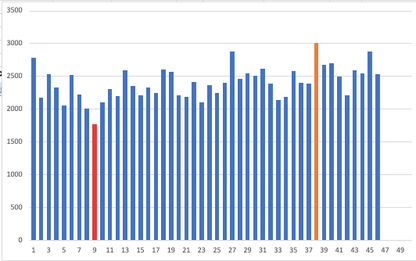
How do I highlight specific data in a various dynamic charts. I am trying to highlight in this case the maximum and minimum data in my dynamic charts. Attached is a copy of my excel.
- Mark as New
- Bookmark
- Subscribe
- Mute
- Subscribe to RSS Feed
- Permalink
- Report Inappropriate Content
Mar 05 2021 09:19 PM
@Liphor Just add the Minimum and Maximum as separate series. Make sure that the empty data points become #N/A by using NA() it the IF formula, rather than " ". Set the series overlap to 100% and reduce the gap width for the extra series slightly and colour each series to your liking.
See attached.
- Mark as New
- Bookmark
- Subscribe
- Mute
- Subscribe to RSS Feed
- Permalink
- Report Inappropriate Content
Mar 06 2021 02:03 AM
Thank you for your solution. However I realized that there is blank space in the charts that has fewer datas. I tried using countif and named range but not successful. How do I overcome this? Attached is the spreadsheet of what I have done.
- Mark as New
- Bookmark
- Subscribe
- Mute
- Subscribe to RSS Feed
- Permalink
- Report Inappropriate Content
Mar 06 2021 03:50 AM
@Liphor You can do that by declaring dynamic chart ranges. I've done that in the attached workbook. More information in the attached link.
- Mark as New
- Bookmark
- Subscribe
- Mute
- Subscribe to RSS Feed
- Permalink
- Report Inappropriate Content
Mar 06 2021 06:07 AM
- Mark as New
- Bookmark
- Subscribe
- Mute
- Subscribe to RSS Feed
- Permalink
- Report Inappropriate Content
Mar 06 2021 07:21 AM
@Liphor I merely used K7 to perform a count of the number of rows to be included in the chart.
The dynamic range starts on row 12 and a number of rows down, based on the value in K7.
Can't tell what you did wrong if you don't share your entire workbook, as long as it doesn't contain any confidential information.
- Mark as New
- Bookmark
- Subscribe
- Mute
- Subscribe to RSS Feed
- Permalink
- Report Inappropriate Content
Mar 06 2021 06:43 PM
@Riny_van_EekelenThank you and I understand your solution now. As for my error ,I guess it is because my formula for the named range involving maximum, counts cells "na". Attached here is my file that show my error for your perusal.
- Mark as New
- Bookmark
- Subscribe
- Mute
- Subscribe to RSS Feed
- Permalink
- Report Inappropriate Content
Mar 06 2021 10:22 PM
@Liphor See attached. Now, the chart looks at three dynamic ranges RF, rfMax and rfMin (in that order) for the data and a dynamic range "Year for the X-axis labels.
When you create new dynamic ranges, like "namax" in your last file, you need to follow the instructions precisely. I.e. include the sheet name and use absolute cell references (i.e. with the $ signs). When I looked at the reference for "namax" it point to cells in column AD and the range was 50 rows long, because you inserted the COUNTIF based on column O rather than just picking up the number in H2.
- Mark as New
- Bookmark
- Subscribe
- Mute
- Subscribe to RSS Feed
- Permalink
- Report Inappropriate Content
