- Home
- PowerShell Community
- Windows PowerShell
- Average CPU usage (%) over a few seconds
Average CPU usage (%) over a few seconds
- Subscribe to RSS Feed
- Mark Discussion as New
- Mark Discussion as Read
- Pin this Discussion for Current User
- Bookmark
- Subscribe
- Printer Friendly Page
- Mark as New
- Bookmark
- Subscribe
- Mute
- Subscribe to RSS Feed
- Permalink
- Report Inappropriate Content
Jan 11 2024 11:09 AM
I'd like for a process to be monitored over a few seconds then be given its average CPU usage (% over that time). eg every seconds for 5 seconds, and I might end up stretching that as its CPU usage tend to be erratic. If possible the Windows 10 scripts will also work for 11.
Thank you kindly for your solution or closely-related example scripts
- Labels:
-
Windows 10
- Mark as New
- Bookmark
- Subscribe
- Mute
- Subscribe to RSS Feed
- Permalink
- Report Inappropriate Content
Jan 11 2024 04:32 PM
Hi.
While in theory this can be done via script, in practice, it's not going to work well. PowerShell is not the best choice here - at least, not for performing the actual monitoring. Instead, you should be using the Windows performance counter framework.
The reason for this is very simple.
When run, the PowerShell script runs in something called "user mode" (the other mode being "kernel mode") which comes with the default behaviour of running at "normal" priority.
When Windows starts struggling with high CPU utilisation (be that on one core or all - there's still plenty of single-threading applications out there), the first processes to become "unresponsive" are user-mode processes, meaning your monitoring script itself will be heavily impacted.
Conversely, the key elements of the Windows performance counter framework are run in kernel mode, meaning they are implicitly run at the highest process priorities and therefore more responsive when the system is under serious CPU load.
The visual tool provided in Windows for interfacing with the performance counters is called "Performance Monitor" - or perfmon for short.
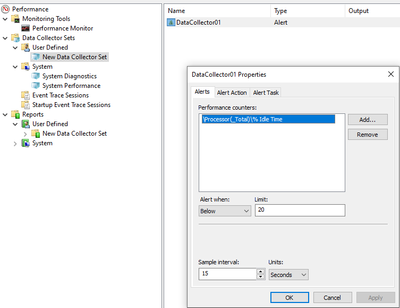
Perfmon can generate charts, logs and alerts - and it may be alerts that are most interesting to you as they can in turn trigger various actions, including starting performance counter logging (quite powerful for finding the root cause behind the CPU spike - such as transient low memory and therefore excessive paging), sending e-mails and running scripts.
Here's a simple view of Perfmon and the alerts dialog:
And here's some useful links relating to Perfmon - you can ignore the SQL context as the concepts and steps relate to all applications, and Perfmon is a Windows tool, not an SQL Server-specific tool:
- Create Charts, Alerts, Logs, and Reports in System Monitor - SQL Server | Microsoft Learn
- Monitor Resource Usage (Performance Monitor) - SQL Server | Microsoft Learn
- Monitor performance of remote computers - Windows Server | Microsoft Learn
- Create performance counter alert and send email - Windows Server | Microsoft Learn
Once a data collector has been defined, you can use the "Save as template" menu option to export the full definition as an XML file, which can then be imported to as many other computers as you like.
Lastly, the performance counters framework is available in all versions of Windows NT and has been since the 90's (the Perfmon tool hasn't changed much since Vista/2008), so the same approach not only works across Windows 10 and 11 but likely all future versions of Windows, too.
Anyhow, it's your decision as to whether you continue with the PowerShell script approach, but as it's negatively impacted by the very condition you're looking to identify, I wouldn't recommend it.
Cheers,
Lain
- Mark as New
- Bookmark
- Subscribe
- Mute
- Subscribe to RSS Feed
- Permalink
- Report Inappropriate Content
Jan 11 2024 05:16 PM - edited Jan 11 2024 05:18 PM
@LainRobertsonAs long as I don't have to load Task Manager nor the Resource Monitor nor anything that take as long to load I'm ok with it; I'm already doing the former and it's annoying me as it takes multiple seconds to load. The process I'd like monitored generally bothers me when it reaches ~10% average CPU usage, when it reaches ~20% it start affecting me seriously.
Perhaps at 10% (average CPU usage), a light alert sound could be made, say at 50% volume (of the current main %, eg 6% if at 12%). At 20% it could be a full alert sound regularly, eg every 5-15 mins, and the 1st of those could create a notification, as in the text bubble icon in the corner next to the clock in the task bar. I'm not always at my post so I'd like whichever sound alert you propose to be done regularly as long as the CPU % is somewhat high.
Let me know if you'd like clarification to a part of what's above.
