First published on TECHNET on Sep 25, 2009
Back at MMS this year we presented a session on authoring reports. During that session my colleague Vitaly created a SQL stored procedure that allowed us to create a server overview report showing key server metrics such as Processor Count, Physical Memory, CPU Utilization, Availability and Logical Disk Space. I have now eventually gotten round to making this report available in sample (non-production J ) form so you can see the approach we took.
This is a useful report as it draws server information from multiple data sources in the DW and presents them in a clear tabular form. It also enumerates all logical disks and presents their storage usage:

The report and the relevant stored procedures that it uses are in the Sample MP attached. Simply import and give it a go.
Requires R2 RTM.
This report takes group as a parameter and I also wanted to share this query as I have been asked about it several times. This returns a list of all groups similar to what you would see in the groups tab under authoring in the console.
SELECT DisplayName FROM vManagedEntity
Where ManagedEntityTypeRowID in (
SELECT ManagedEntityTypeRowID from dbo.ManagedEntityDerivedTypeHierarchy
((
SELECT ManagedEntityTypeRowId from vmanagedentitytype
Where managedentitytypesystemname = 'system.group'),0))
ORDER BY DisplayName

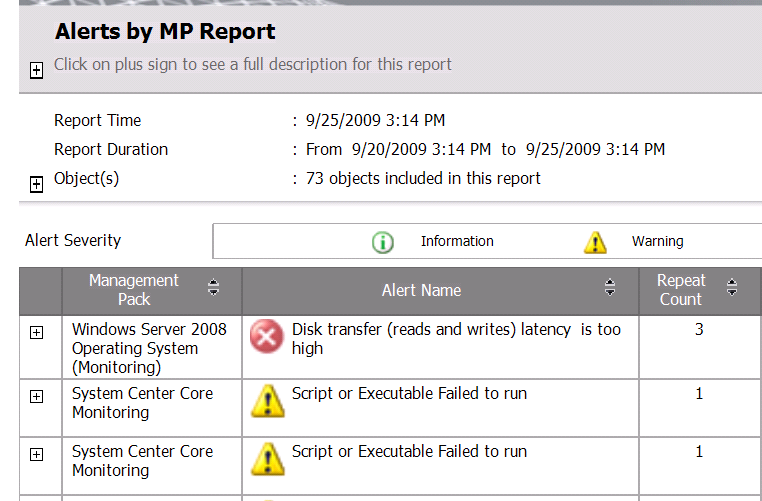
Lastly there is a second report in the Sample MP that allows you to view alerts generated by a particular MP:
This posting is provided "AS IS" with no warranties, and confers no rights.
Use of included utilities are subject to the terms specified at
http://www.microsoft.com/info/cpyright.htm
Daniel Savage
Sample.Report.Library.xml