- Home
- SQL Server
- SQL Server Blog
- Looking deeper into SQL Server using Minidumps
- Subscribe to RSS Feed
- Mark as New
- Mark as Read
- Bookmark
- Subscribe
- Printer Friendly Page
- Report Inappropriate Content
Authored by Thomas Kejser
Author: Thomas Kejser
Reviewers and Contributors: Bob Ward, Michael Thomassy, Juergen Thomas, Hermann Daeubler, Mark Souza, Lubor Kollar, Henk van der Valk (Unisys) and Peter Scharlock
For advanced troubleshooting and understanding of SQL Server, you can sometimes benefit from creating a dump file of the sqlservr.exe process.
What is a dump? It is a file containing a snapshot of the running process – and parts or all of the memory space of that process. The snapshot also contains the call stack of every thread the process has created.
There are two major types of dump files:
- A full dump – this contains the entire process space. A full dump can take a VERY long time to run. If you are only interested in learning more about SQL Servers internal structures – do not use this type of dump.
- A minidump – this much smaller file contains the memory for the call stack of all threads, the CPU registers and information about which modules are loaded. If you are just curious about the internals of SQL Server, this is the type of dump you want to create.
Using a debugger, such as WinDbg , you can analyze a dump file. Remember that you are only looking at a snapshot in time of the process – but even then, just showing the call stacks can be quite enlightening. In WinDdg , the command to show all call stacks is: ~*kn . If you are the kind of person who likes to have a mental model of how a product works – minidump can help you deepen your understanding. A trick I often use is to take three minidumps in a row, waiting a few seconds between each one. By comparing the thread stacks of dumps, I can get a rough idea what threads inside the SQL Server process space are doing. But remember – these are the threads of the sqlservr.exe process itself – not the session_id that you see from the DMV.
If you should run into errors in SQL Server itself, minidumps help CSS support you and perform deep level investigation. CSS will sometimes request that you perform such a minidump of the process – the engineer in CSS can then use the dump to analyze the issue.
Minidump files have the extension *.mdmp . In rare cases, you may find some of these files in your SQL Server or Analysis Services directory. CSS may request these files from you if you have a case open with them.
There are several ways to generate a minidump. One way is to use the sqldumper.exe file that ships with SQL Server. You can read about sqldumper.exe in:
- KB 827690 - How to use Sqldumper.exe to generate dump files for Windows applications
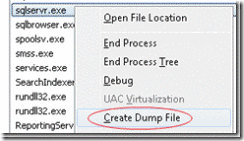
in Windows 2008 Server there is an easy way to get dumps from the GUI. If you bring up task manager and right click on a process, you get this new option:
But watch out! In the default configuration of Windows 2008 Server you will get a full dump. For a large SQL Server installation with hundreds of GB of memory – generating such a dump can take hours. And while the dump happens, the SQL Server process is frozen.
If you only want the minidump, you can re-configure Windows 2008 Server to generate mini dumps instead of full dumps. This is documented in:
- KB 931673 - How to create a user-mode process dump file in Windows Vista
Now that you know how to create minidumps. Let me show you an example of a curious investigation using a minidump. A question we often get is: Why do I see such high waits for CXPACKET in sys.dm_os_wait_stats . CXPACKET is a wait that SQL Server uses to coordinate parallelism – and you can generally ignore it. But, for those of you curious to know more, minidumps gives you the ability to understand this elusive wait type better.
Recently, I was running an highly parallel INSERT…SELECT statement. I was using the new minimally logged heap operations and the SELECT statement was doing a lot of hash joining. After some time, I saw a lot of tasks blocked on CXPACKET in sys.dm_os_waiting_tasks . I decided to perform a minidump to learn a bit more about SQL Server Parallelism. After opening the dump in WinDbg and running ~*kn I could now see all the thread call stacks in the snahpshot. I saw a lot of threads with this call stack:
Thread: <Many> call stack
ntdll!ZwWaitForSingleObject
KERNELBASE!WaitForSingleObjectEx
sqlservr!SOS_Scheduler::SwitchContext
sqlservr!SOS_Scheduler::SuspendNonPreemptive
sqlservr!SOS_Scheduler::Suspend
sqlservr!EventInternal<Spinlock<153,1,0> >::Wait
sqlservr!EventInternal<Spinlock<153,1,0> >::WaitAllowPrematureWakeup
sqlservr!CXPacketList::RemoveHead
sqlservr!CXPipe::Pull
sqlservr!CXTransLocal::AllocateBuffers
sqlservr!CQScanXProducerNew::AllocateBuffers
sqlservr!CQScanXProducerNew::GetRowHelper
sqlservr!FnProducerOpen
sqlservr!FnProducerThread
sqlservr!SubprocEntrypoint
sqlservr!SOS_Task::Param::Execute
From the highlight, it does not take much to guess that this is probably the CXPACKET waiting tasks. Searching for a task that is not waiting, I found this:
Thread: 117 call stack
msvcr80!memcpy
sqlservr!RowsetBulk::InsertRow
sqlservr!CXRowset::InsertRow
sqlservr!CValRow::SetDataX
sqlservr!CEs::GeneralEval
sqlservr!CQScanUpdateNew::GetRow
sqlservr!CQScanProfileNew::GetRow
sqlservr!CQueryScan::GetRow
sqlservr!CXStmtQuery::ErsqExecuteQuery
sqlservr!CXStmtDML::XretDMLExecute
sqlservr!CXStmtDML::XretExecute
sqlservr!CMsqlExecContext::ExecuteStmts<1,0>
sqlservr!CMsqlExecContext::FExecute
sqlservr!CSQLSource::Execute
sqlservr!process_request
sqlservr!process_commands
sqlservr!SOS_Task::Param::Execute
Now, you don’t really need source code access to guess what is going on here: SQL Server is inserting the rows and other threads are waiting to feed the insert thread. I can even see that the execution is using what looks like the bulk load function.
If you are curious to learn more about analyzing minidumps there is an excellent article about it found here:
- KB 315263 - How to read the small memory dump files that Windows creates for debugging
You must be a registered user to add a comment. If you've already registered, sign in. Otherwise, register and sign in.
