- Home
- System Center
- System Center Blog
- Troubleshooting Workflow Performance and Delays
- Subscribe to RSS Feed
- Mark as New
- Mark as Read
- Bookmark
- Subscribe
- Printer Friendly Page
- Report Inappropriate Content
Previously, I have posted another blog post on troubleshooting workflows . That blog post talks about troubleshooting a specific workflow that is having problems. This blog post describes how to troubleshoot general performance problems with workflows.
This blog post will describe how to troubleshoot Service Manager to figure out if workflows are not keeping pace with the transaction volume happening in the database. This problem would manifest itself as when an update to the database happens such as creating or updating an incident and then a notification or workflow that is supposed to be triggered by that update doesn't happen for several minutes, hours, or even days in really bad situations.
Before we get into troubleshooting, it is important to understand how the notification/workflow subscription infrastructure works. Notification subscriptions and workflows are implemented in the system in the same way by using rules in management packs. There are other kinds of rules such as connectors that run on a schedule. Since those types of rules run on a schedule instead of being triggered by an update in the database, we will not be considering those types of rules in this blog post. We will only be looking at those rules which have a subscription data source module in the rule. A rule with a subscription data source module in it basically queries the database looking for the specified criteria to occur. For example, you might have a notification subscription rule that has a subscription data source module in it with criteria that looks for all new incidents that are created. This is what a rule like that would look like in management pack XML:
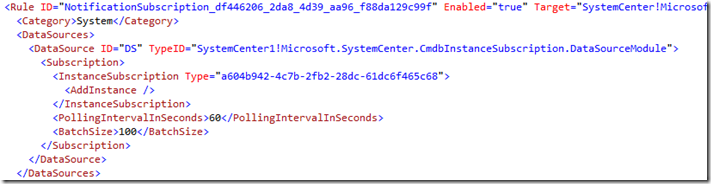
Notice how the DataSource uses the …CmdbInstanceSubscription.DataSourceModule. That module is implemented in the SCSM code base to take the input defined in the <Subscription> part of the XML here and query the database accordingly. This particular rule is configured as an ‘InstanceSubscription’. In SCSM parlance an instance is same as saying an ‘object’. An example of an object (or ‘instance’) is a particular incident or a particular computer. This particular subscription is looking for instances of the class (aka ‘type’) System.WorkItem.Incident (which is represented by the GUID ‘a604…). This criteria is also looking for new incidents that are added (see ‘AddInstance’ above). If you are subscribing for an update to an existing incident then the criteria would say ‘UpdateInstance’ instead of ‘AddInstance’. Lastly, you can see that this particular rule has a polling interval of 60 seconds and a batch size of 100. What that means is that every 60 seconds this rule will query the database looking for objects that meet the criteria. If it finds more than 100 then it will pass the oldest 100 to the write action part of the module for processing (in this case sending a notification). The remainder will be processed the next time the workflow runs. This batch size ensures that we don’t totally bog down the system by passing too many objects through at a time to the write action module to be acted upon.
Now, let’s think about this for a minute. This means that if this rule last ran at 11:04:40 and then an incident is created at 11:05:00 AM it will not be picked up and processed for notification for about 40 seconds after it is initially created at 11:05:40 when the rule next runs according to its 60 second polling interval. Because this rule has a polling interval of 60 seconds, on average a new incident will be notified about 30 seconds after it is created. If the rule runs right after the incident is created, the incident might be notified about within 1-2 seconds. If the rule runs right before the incident is created then it could take up to 60 seconds to notify.
Now, let’s assume that at the rule ran at 11:04:40. In between 11:04:40 and 11:05:40 when it is scheduled to run next, 125 incidents are created. When the rule runs at 11:05:40 it will process 100 of those 125 new incident leaving 25 incidents to be processed the next time the rule runs. If it was sort of a fluke that 125 incidents were created in that minute, then it won’t be a problem. The next time the rule runs at 11:06:40, it will catch up by processing those remaining 25 incidents and however many incidents that were created between 11:05:40 and 11:06:40. However, if you have a situation where 125 incidents are being created every minute, then the backlog of the number of incidents that need to be processed will start to increase. The longer that the situation happens where you have more incidents being created every minute than are processed each minute, the longer the delay comes between when an incident is created and when it is notified about!
Hopefully, that is fairly straightforward and easy to understand. Now, let’s take a look at how all of this is tracked in the database. There are two tables that are key to understanding this: EntityTransactionLog and CmdbInstanceSubscriptionState. EntityTransactionLog is a history table that keeps track of every transaction that occurs in the database. Every time an update is made to an object or a new object is added to the database, a new row is added to the EntityTransactionLog table. This is snapshot of the EntityTransactionLog table in my database:
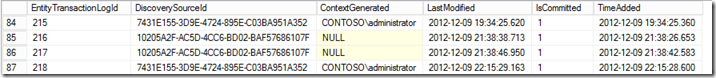
Every transaction has an ID (EntityTransactionLogID), a discovery source (identifies either the user or other data source like a connector that triggered the update), and a time stamp (TimeAdded).
The CmdbInstanceSubscriptionState table keeps track of what the last transaction was that was processed by each rule. Here is a snapshot of my CmdbInstanceSubscriptionState table (note: I’ve only selected the relevant columns):
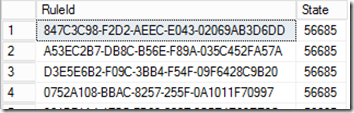
You can see here that each of these four rules has processed all of the transactions in the EntityTransactionLog up to transaction number 56685. Each time a rule runs, it will query the database to see if anything has happened in the database since the last time the rule ran (current value of the CmdbInstanceSubscriptionState.State column, e.g. 56685) and the most current transaction (the largest EntityTransactionLogId in the EntityTransactionLog table). Once the rule has completed evaluating the transactions it will update the CmdbInstanceSubscriptionState.State column with the ID of the most recent transaction it evaluated.
Now that you have an understanding of how the system works, we can learn how to troubleshoot workflow performance problems. There are some situations where these subscription rules start to fall behind:
Possible Causes
- There are too many subscriptions that are querying the database and the database is becoming overwhelmed processing all the subscription queries.
- The criteria for the subscriptions is complicated and requires multiple joins to many tables. If you have a lot of these that can also overwhelm the database.
- The SQL Server database hardware is insufficient to process the number of subscription queries that are coming in.
- The subscription query intervals are configured to happen too frequently and therefore the database is overwhelmed with queries.
- The batch size is too small. For example, if you regularly have 125 incidents coming in every minute and your subscription has a batch size of 100 and is configured to run every minute the subscription will just keep falling further and further behind.
- There is too much other activity happening on the database server, especially at certain times. For example, connectors can significantly slow down the database performance when they run. During peak times users using Service Manager may also slow down overall performance.
- If a workflow was disabled for a period of time and then enabled, the workflow engine will go back in time to when the workflow was disabled and resume processing all objects which match the subscription criteria from that point forward.
- You have added a custom relationship type. The relationship type target class is Z and the max cardinality is equal to 1. You have a subscription to Y class objects. This will trigger the Y class object subscription when the related Z class object is updated. If the Z class objects are frequently updated this can cause a slowdown in performance of the Y class subscription. You may want to consider excluding this relationship type such that an update to a Z object doesn't trigger a subscription to a Y object. Details on that can be found at the end of the blog post.
Again, the symptom of workflows falling behind is typically one of the following:
- Something you expect to be notified about or have a workflow run for is not happening. This could be because your subscription criteria is wrong and will never be triggered. It could also be that the subscription is running just fine and the criteria would be met for the object you are observing, but it will not be processed for a long time because the subscription has fallen behind. An example of this would be a manual activity that should have its status change from Pending to In Progress when the activity preceding it in the process has its status change to Completed.
- Something you expect to have a notification or workflow triggered for within a short period of time after the update happens doesn't have a notification or workflow triggered for some minutes, hours, or days later. An example of this would be when an incident is created, but the notification is not sent to the assigned analyst for 45 minutes after the incident was created.
The first step in troubleshooting this type of problem is to figure out if you have a problem! You can run this query in the ServiceManager database to figure out if you have some subscription rules that are falling behind.
Note : This query and all the others in this blog post can be downloaded from here:
http://gallery.technet.microsoft.com/Workflow-Performance-680438ae

The result will look something like this:
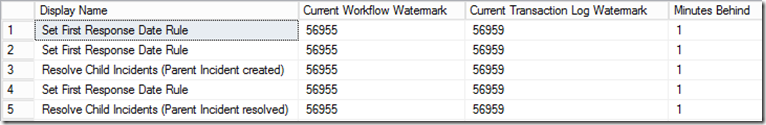
You can see that these 5 rules have all processed the transactions up to 56955, but the most recent transaction is 56959. There has been 4 transactions that have happened since the last time these rules ran. There is also a column which will indicate approximately how many minutes behind in the transaction history these rules are. In this case, the rules are about 1 minute behind which is to be expected since these rules are all configured to run every minute.
You have a problem if the delta between the Current Workflow Watermark and the Current Transaction Log Watermark is very large. The delta size will vary depending on how busy your Service Manager installation is. If you have a lot of people using Service Manager hundreds or even thousands of transactions can happen every minute. A more transaction-volume-independent way to see if you have a problem or not is to look at the Minutes Behind column. If that number is significantly larger than the polling interval for that rule you have a problem. You really have a problem if the watermark delta and/or the number of minutes behind is increasing over time for a given rule.
Before we go on, let me explain some of the parameters of the query above. The @Delta parameter allows you to filter out those rules which have a watermark delta less than the @Delta parameter. For example, in the default query the value is set to 100. Only those rules that have a watermark delta (the different between the Current Workflow Watermark and the Current Transaction Log Watermark) greater than the @Delta value will be shown. In the query I ran to get the results above, I set the value to zero so that it would show all of the rules. The @Language parameter allows you to choose which language to display the display name of the rule in. You can get the language codes by looking at this blog post . Note: if you want to look at a particular rule and you know the display name or part of the display name of it you can uncomment the comment at the end and provide the display name to filter it down to just that rule (or rules that match the LIKE criteria).
Now, let’s say that you have identified a rule (or rules) that are falling behind. What do you do now? This is the order of how I would troubleshoot this:
1) Look at the hardware first. Are you using at least the minimum recommended hardware for the ServiceManager database server? If you have a very busy/large scale Service Manager installation are you using significantly more than the recommended hardware? Have a look at the performance of the SQL Server. Is the _Total processor consistently busy more than 50% of the time? Is there at least some available RAM on the SQL Server? What do the disks look like?
2) Look at the Operations Manager event log on the SCSM management server where the workflows are running. You may see some events like this:
Log Name: Operations Manager
Source: SMCMDB Subscription Data Source Module
Date: 2010-09-10 10:15:16
Event ID: 33610
Task Category: None
Level: Warning
Keywords: Classic
User: N/A
Computer: SMMS.company.com
Description:The database subscription query is longer than expected. Check the database or simplify the database subscription criteria.
The following errors were encountered:
Exception message: Subscription query is taking long.
Subscription id: 44b7110a-d862-60e3-c644-bb879329844e
Time spent in new state: 00:00:10.0003365
Time spent in querying state: 00:00:10.0013130One or more subscriptions were affected by this.
Subscription name: ServiceManager.ChangeManagement.ActivityAddedRule
Instance name: Change Request Workflow Target
Instance ID: {901B03DB-7894-5DA5-0203-8D91D61A609F}
Management group: SCSM-Company
This is an indication that the database is being overwhelmed by the activity happening on the database. It could be because there are too many workflows. It could be because there are some connectors running that are hammering the database. It could also be that there are too many users updating the database. It could also be that the subscription criteria is too complicated and involves too many table joins. Or it could be some combination of all of those things. If you see this event consistently for one particular subscription and not others that is an indication that the criteria for that particular subscription may be too complicated or there are a lot of transactions that are happening frequently for the target class of that subscription.
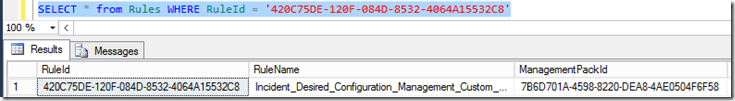
3) Take a look at the configuration of the Rule. To do this you need to figure out what management pack the rule is in. First, get the RuleID GUID from the query above for the rule that is apparently having a problem. Then use the RuleID GUID in this query:
SELECT * FROM Rules WHERE RuleId = ‘<the RuleID GUID>’
This will give you two things you need: the RuleName and the ManagementPackID. For example:
Now grab the ManagementPackID and use it in this query:
SELECT CONVERT(XML, MPXML) FROM ManagementPack WHERE ManagementPackID = ‘<The ManagementPackdId GUID>’
This will convert the MP XML stored in the database into an temporary XML file:
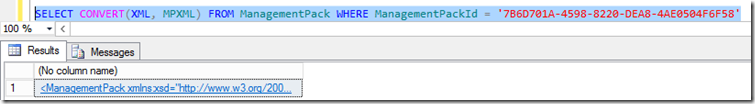
Now, just click the link in the Results tab and it will open the temporary XML file for you in SQL Management Studio as another document tab. For example:
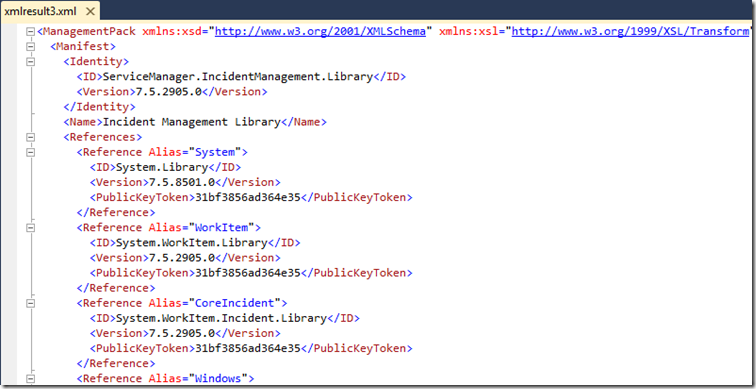
Now, take the RuleName that you found above in the Rules table query (e.g. ‘Incident_Desired_Configuration_…) and use Find (CTRL+F) to find that rule in the XML document. For example:
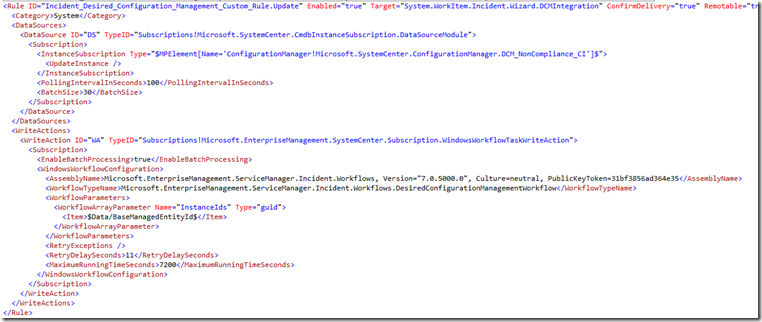
A few things to check here:
- Look at the polling interval. Is it set to something reasonable like 60, 90, or 100 (seconds)? If it is not, change it.
- Look at the batch size. Is it set to something reasonable like 50 or 100? If it is not, change it.
- Look at the criteria. Is it too complicated (i.e. has a lot of And/Or criteria with a lot of relationship traversals)? If you suspect that the criteria is too complicated try simplifying it if possible.
- Think about the combination of the polling interval and batch size. Are you going to consistently have more objects to process that meet the criteria in each polling interval than can be processed in a single batch? If so the polling interval should be decreased or the batch size should be increased.
- To figure out how many objects are typically processed by a rule each time it runs you can look at the EventCount and LastNonZeroEventCount columns on the query provided above. Each “Event” is a transaction that meets the criteria of the subscription rule since the last time it ran.
If you need to change a management pack, export it out from the Management Packs view in the console or use the Export-SCSMManagementPack PowerShell cmdlet. Keep in mind that you cannot change the configuration of subscription rules that are provided out of the box in sealed management packs . Once you have made the change in an XML editor, increment the version number in the management pack XML (near the top of the XML file) and re-import the management pack into Service Manager. After a few seconds, the new version of the management pack should be downloaded to the management server and the new version of the rule will be loaded into the System Center Management service.
If the workflows are hopelessly behind and you want them to catch up immediately, you can update the State column on the CmdbInstanceSubscriptionState table by running this query:
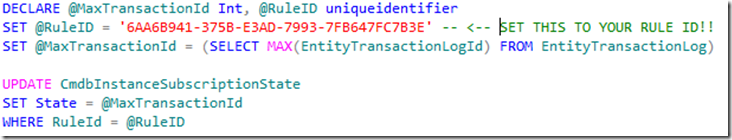
Keep in mind that running this query will move the watermark forward. Any transactions that would have triggered the subscription criteria and any resulting actions (notifications, workflows, etc) for those transactions that are being skipped over WILL NOT HAPPEN . Be very careful using this update query. Also, keep in mind that the EntityChangeLog table has a grooming routine that grooms rows from that table which are no longer needed. One of the criteria for determining whether or not a row is needed is the position of the watermarks for the workflows. We recommend slowly moving up the watermark so as not to trigger a massive grooming job that would slow down the overall system. We also recommend moving the watermark during non-peak hours in order to minimize the impact of grooming on people using the system.
Hopefully, this gives you some tools to help investigate why subscriptions are not being triggered (apparently) or are taking a long time to be triggered.
Appendix: Excluding Relationship Types with MaxCardinality=1 Targets
This is an advanced topic and refers to the last bullet point in the possible causes section above. To give an example of this problem, assume that there are 10,000 incidents that are assigned to Bob Jones. The WorkItemAssignedToUser relationship type has Source = System.WorkItem and Target = System.User. The MaxCardinality of the Target end of the relationship type is 1 meaning that only one user can be assigned to each work item. Unless this relationship type is excluded from subscription queries, an update to Bob will be treated as an update to the 10,000 incidents that are assigned to him. In this case, it doesn't really make sense to have all of the incidents be treated as updated just because Bob was updated. Thus, we want to exclude these updates. In other cases such as a Windows computer object being related to a physical computer object it does make sense. If the physical computer object is updated we should treat it as an update to the Windows computer object. Thus, with any custom relationship type where there is a Target with MaxCardinality = 1 where you will be subscribing to the Source objects, you need to decide if the relationship type should be included or excluded in determining whether or not the Source object is updated.
By default a relationship type with Target MaxCardinality=1 is included . Before you exclude a relationship type, you can determine how much impact it is likely having by running the following queries.
First, determine the minimum and maximum watermark values:
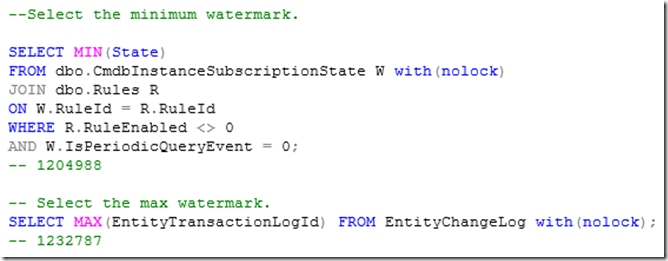
In this example, the minimum is 1204988 and the maximum is 1232787.
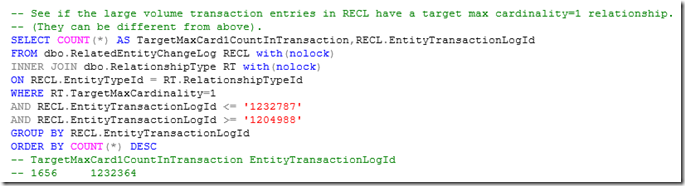
Now, use that watermark range (e.g. 1204988 –> 1232787) in the following query to look for updates where there is a large number of related objects that are treated as updated when a target object is updated. These related object changes are stored in the RelatedEntityChangeLog table (or RECL for short).
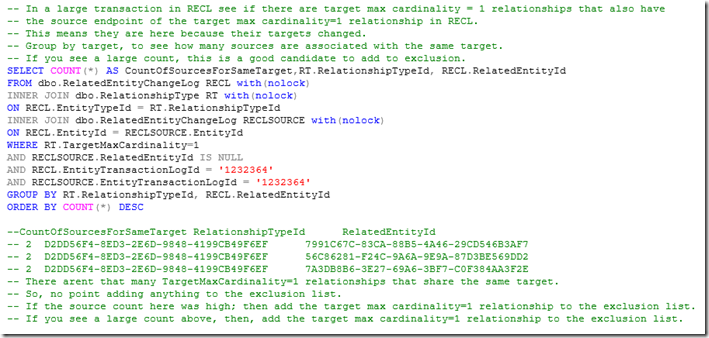
Next, using the TransactionLogId value(s) (e.g. 1232364) from the previous query where there is a large number of related objects, determine which transaction log entries have the most related transaction log entries where the target object is related by a MaxCardinality=1 relationship type.
To add a relationship type to the exclusion list insert a row into the ExcludedEntityChangeLog table, specifying the RelationshipType GUID from the RelationshipType table and the Target class GUID from the ManagedType table.
You must be a registered user to add a comment. If you've already registered, sign in. Otherwise, register and sign in.