Good morning AskPerf! Leonard here to chat about a performance issue we often see on the Windows performance team surrounding SQL and Working Set Trimming. I recently worked an issue on a 2003 SP2 x64 Server, running SQL 2005, that was experiencing periods of slow performance and filling up the SQL log with the following error:
A significant part of sql server process memory has been paged out. This may result in performance degradation.
This error is covered in detail in the following article:
How to reduce paging of buffer pool memory in the 64-bit version of SQL Server
http://support.microsoft.com/kb/918483
This error is logged when the working set of SQL is trimmed, meaning it is paged out to disk. The working set of a program is just the memory it is using. Normally working set trimming isn’t necessarily a bad thing. It’s the way Windows takes memory from one program that hasn’t been used most recently (and might never be used again) and gives it to other programs. But for SQL to operate efficiently, it must keep a large part of its data in memory. When it gets trimmed, then SQL operations can take a significantly longer time to complete. Therefore we needed to determine what was using a large amount of memory on the system causing the problem. For almost all Windows performance issues we gather Perfmon data, as I did in this case. We had it capturing a circular log, and stop it after the SQL error occurred. I then produced a summary of the Perfmon logs and the following data stood out:
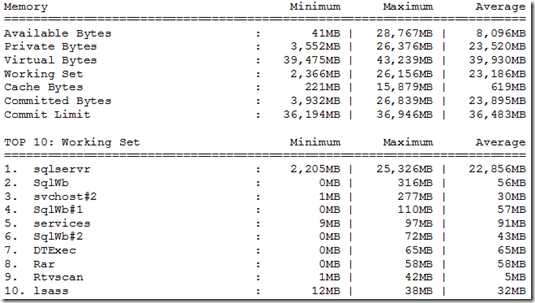
I could see a SIGNIFICANT range between Minimum and Maximum in Available Bytes, Private Bytes, Working Set, and Cache Bytes. This was occurring when there should have been a somewhat constant work load and therefore memory usage should not have varied greatly. The SQLserver process was the only process with significant working set values. When discovering something in the numbers like this, the next step is to see how some of the important counters change together over time. Looking at a visual graph is the best way to see that relationship.
Here we see a pattern where Available MB drops below 100 MB ~ every 2 hours and 10 min and working set is trimmed; mostly from SQL since it is the largest process:

Looking at the one where SQL gets trimmed to 2 GB at ~ 3:50 AM. I added in Cache bytes since we know it varies. I also wanted to know what processes were starting during this period. My favorite counter for that is Process\Elapsed Time. If you scale it to the graph, it is easy to see anything with a sharp angle (meaning it would intersect with the bottom of the graph) or that starts and stops. I removed all of the ones that were flat and was left with the following:

We can see above that Cache Bytes grow to 15 gig when all of this occurs. The processes that start at this time were bpcd and dbbackex, and the bphdb was restarted (these are all backup processes). Here is one with the bpcd process selected so we can see where it is running:

Zooming out we see the pattern repeats with a different backup process selected. This confirms that the cause of the working set trimming is always the same backup process:

Conclusion: The SQL backup (Veritas Netbackup) was causing cache bytes to grow up to ~15 GB and Windows was trimming SQL working set memory to give memory back to cache. This can be a common problem on 64 bit Windows where cache used for file IO can grow large enough to impact Windows performance. There were 2 possible solutions to this:
Solution 1
Implement SQL lock pages in memory. When memory is locked by SQL, it prevents Windows from taking that memory from SQL. The down side to that is Windows memory management might not be able to respond to even smaller request for memory from programs that need it. Because of this, only use lock pages in memory when need.
Solution 2
Another option would be to implement the Windows Dynamic Cache service. This is a service that was developed in-house to use Windows memory management API’s to control the amount of cache memory that is used on Windows. There are a number of registry keys that can be set to control the behavior and therefore it can be adapted to different issues and Windows configurations.
On this particular case, we decided to implement the Dynamic Cache service. To download the Microsoft Windows Dynamic Cache Service, check the following link:
http://www.microsoft.com/download/en/details.aspx?displaylang=en&id=9258
After it was installed, we set the following registry key:
[HKEY_LOCAL_MACHINE\SYSTEM\CurrentControlSet\Services\DynCache\Parameters]
RegValue: MaxSystemCacheMBytes
Type: REG_DWORD
Value: 1000
Setting this registry key allowed us to set a limit on cache memory to 1GB. We choose this value because it would provide some cache, but was small enough to not impact SQL.
Other possible values for this registry key are:
0 = Limit to 90% of Physical RAM (default)
1-99 = Limit the maximum size of the System File Cache to this percentage of Physical RAM
> 200 = Limit the maximum size of the System File Cache to x Mbytes
Once this was service was implemented, we monitored the system for a week. After this time, we confirmed that both SQL and the backup processes were stable with no performance related issues.
Hopefully this post will help you tackle those fun Working Set/Cache issues on your Windows Servers.
Additional Resources
- SQL and the Working Set
- Windows 7 and Windows Server 2008 R2: Do you still need the Microsoft Windows Dynamic Cache Service?
-Leonard Severt
 Microsoft