azure
8168 TopicsThe Gap Between Applications and Analytics, and "How Lakebase Solves It"
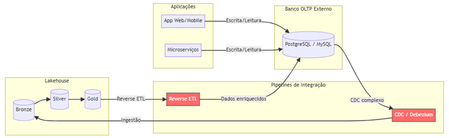
The Problem Nobody Likes to Admit. Imagine this scenario: your data team has built a flawless lakehouse. Ingest pipelines, bronze/silver/gold tiers, gleaming dashboards. Everything is working perfectly. Until someone asks: "And the production app? Where does it store the transactional data?" That's where the headache begins. You need a separate OLTP database (Postgres, MySQL, DynamoDB...), CDC pipelines to bring data into the lakehouse, reverse ETL to return enriched data to the app, and an infrastructure team to keep it all running. The result? Data silos, synchronization latency, operational complexity, and ever-increasing costs. Traditional Architecture (and Its Pain Points) Here's how most companies operate today: Pain points in this architecture: Multiple tools and suppliers for managing Significant latency between writing on OLTP and availability on Lakehouse. Fragmented governance — Unity Catalog doesn't see the external bank. High operational costs associated with synchronization pipelines. What is Lakebase? Lakebase is a fully managed Postgres database natively integrated with the Databricks Data Intelligence Platform. It is designed to bridge the gap between transactional (OLTP) and analytical (OLAP) workloads, unifying everything into a single ecosystem . In simple terms: it's like having a high-performance Postgres server living inside your lakehouse , with unified governance via Unity Catalog, native bidirectional synchronization, and modern capabilities such as autoscaling, scale-to-zero, and database branching. The New Architecture with Lakebase: What changes? Zero external database infrastructure Native bidirectional synchronization (no Debezium, no Airflow, no pain) Unified governance through the Unity Catalog A single control plane for OLTP + OLAP The Architectural Innovations of Lakebase Lakebase is not "just another managed Postgres." It brings modern data engineering concepts to the transactional world. 1. Separation of Compute and Storage Unlike traditional data banks where CPU and disk are coupled, Lakebase completely separates computing resources from storage. This means you scale each independently, paying only for what you use. 2. Copy-on-Write Storage The storage system uses a copy-on-write approach. In practice, when you create a branch of the database, there is no data duplication —only the changes are stored separately. This makes operations like branching and restoring virtually instantaneous. 3. Autoscaling and Scale-to-Zero The compute system automatically adjusts its capacity based on demand. During periods of inactivity, the database scales to zero , eliminating costs. When a request arrives, it "wakes up" in seconds. Database Branching: Git for Your Data This is probably the most innovative feature. Just as developers create branches in Git to work on isolated features, Lakebase allows you to create branches for the entire database . Powerful use cases: Development : each developer has their own branch of the database, without interfering with production. Migration testing : test schema changes in an isolated branch before applying them to production. Instant Restore : Restore the database to any point in time (configurable window from 0 to 30 days) by creating a branch from that point. Two-Way Synchronization: The End of Reverse ETL One of the biggest advantages is the native synchronization between Lakehouse and Lakebase: Synced Tables (Lakehouse → Lakebase) Unity Catalog tables are automatically synchronized to Lakebase, allowing applications to query rich analytical data with low latency. Supports Snapshot, Triggered, and Continuous modes. Lakehouse Sync (Lakebase → Lakehouse) Transactional data from Lakebase is continuously replicated to Delta tables in the Unity Catalog using Change Data Capture (CDC). The destination tables follow the SCD Type 2 standard , maintaining a complete history of changes. This completely eliminates the need for: External CDC tools (Debezium, Fivetran) Reverse ETL pipelines (Census, Hightouch) Custom synchronization jobs in Airflow/Prefect Three Strategic Use Cases Feature Serving for Real-Time ML Lakebase functions as an online store for Databricks' Feature Store. Features computed in the lakehouse are synchronized via Synced Tables to Lakebase, from where ML models query them with millisecond latency. State of AI Agents AI agents need to persist state between requests — conversation context, action history, workflow data. Lakebase provides a native transactional database to store this state with ACID consistency. Transactional Data for Applications Databricks Apps (or any external application) can use Lakebase as their primary database. The integration is native: simply add the Lakebase project as a resource in your app. Additionally, the Data API offers a PostgREST-compatible REST interface for direct HTTP access. Comparison: Before and After Availability Lakebase Autoscaling is available in the following AWS regions: us-east-1, us-east-2,us-west-2 ca-central-1, sa-east-1 eu-central-1, eu-west-1,eu-west-2 ap-south-1, ap-southeast-1,ap-southeast-2 The presence in sa-east-1 is particularly relevant for us in the Brazilian community, ensuring low latency for applications hosted in Brazil. Conclusion Lakebase represents a paradigm shift: instead of treating OLTP and OLAP as separate worlds that need complex "bridges," it unifies them into a single platform. For Brazilian data teams, this means: Fewer tools to manage and integrate. Fewer pipelines that silently break down at 3 a.m. More time focused on generating value with data. Real governance across the entire data lifecycle — from transactional writing to the executive dashboard. Lakehouse finally has its native transactional database. And it speaks Postgres. This post was inspired by concepts from the official Databricks documentation. For more technical details, please refer to the Lakebase documentation . Wiliam Rosa Data Engineer | Machine Learning Engineer linkedin.com/in/wiliamrosa Blog: https://wiliamrosa.github.io69Views0likes0Comments
The Hidden Reason Your Sentinel Playbook Won't Show Up in Automation Rules (It's Not RBAC)
If a Logic App using the native Microsoft Sentinel incident trigger doesn't show up in the "Run playbook" picker of an Automation Rule — even though permissions, region, and connection are all correct — check the internal action name of the trigger in the JSON code view. If the Logic App was created while the Azure portal was set to a non-English language, the designer may generate a localized action name instead of the expected Microsoft_Sentinel_incident, and the playbook won't be picked up. Environment Microsoft Sentinel (Log Analytics workspace) Logic Apps (Consumption plan) Trigger: native Microsoft Sentinel connector, "Incident" trigger (/incident-creation path) Authentication: system-assigned Managed Identity Same subscription, resource group, and region as the Sentinel workspace Problem Two Logic Apps, both triggered by the native Microsoft Sentinel incident trigger, both using a system-assigned managed identity with the Microsoft Sentinel Responder role granted on the workspace. Same subscription, same resource group, same region. Only one of the two appeared in the "Run playbook" dropdown when configuring an Automation Rule in Sentinel. The other was simply absent — no error message, no warning, nothing in the run history to explain it. Investigation The usual suspects were checked and ruled out one by one: API connection health — one azuresentinel connection was indeed in an "Error" state, but it turned out not to be the one referenced by the affected trigger. Managed identity RBAC — the Microsoft Sentinel Responder role was correctly assigned to the Logic App's managed identity on the Sentinel workspace. User's own RBAC/PIM role — the Logic App Contributor role (required for the account configuring the Automation Rule to even see the resource) was active via PIM at the time of testing. Region/subscription/resource group — identical for both Logic Apps. Trigger type — both used the native "Incident in Microsoft Sentinel" trigger added through the visual designer, not a generic HTTP trigger or a deprecated connector. Every documented requirement was met. The playbook was still invisible. Root Cause Comparing the raw JSON (Logic app > Development tools > Code view) revealed the actual difference. Working Logic App (visible in the picker): "triggers": { "Microsoft_Sentinel_incident": { "type": "ApiConnectionWebhook", "inputs": { "body": { "callback_url": "@{listCallbackUrl()}" }, "path": "/incident-creation" } } } Broken Logic App (invisible in the picker): "triggers": { "Incident_dans_Microsoft_Sentinel": { "type": "ApiConnectionWebhook", "inputs": { "body": { "callback_url": "@listCallbackUrl()" }, "path": "/incident-creation" } } } The connector type and the path (/incident-creation) are identical. The one meaningful structural difference is the trigger's action name: Microsoft_Sentinel_incident versus Incident_dans_Microsoft_Sentinel. The second Logic App's trigger had been added while the Azure portal was set to French. The designer generated a localized action name instead of the canonical English one. Everything points to Sentinel's playbook discovery mechanism scanning Logic App definitions for that exact canonical action name (Microsoft_Sentinel_incident) to identify a resource as a valid Sentinel playbook — rather than relying solely on the connector type or the webhook path, as one would reasonably expect. Fix Renaming the trigger's action key in the JSON to the canonical name was enough: "triggers": { "Microsoft_Sentinel_incident": { ... } } No permission, connection, or region change was required — only this rename. Takeaways The Sentinel Automation Rule playbook picker appears to depend on the exact trigger action name, not just its type or functional behavior — a dependency that isn't documented anywhere in the official Microsoft docs as of this writing. The Azure portal's display language at the time a trigger is added has a direct impact on that Logic App's compatibility with Sentinel Automation Rules. A playbook can be fully functional (running without errors when triggered manually or through an older automation mechanism) while still being invisible in the newer Automation Rule selector — which makes this particular issue easy to miss, since nothing explicitly flags it. Recommendations Temporarily switch the Azure portal to English (Portal settings > Language and region) before adding a Sentinel trigger to a Logic App, if your team usually works in another language. If an existing Logic App won't show up despite an otherwise correct configuration, check the trigger's action name in the JSON code view first — it's a 30-second check that can save hours of RBAC/connection troubleshooting. Document this in your internal runbooks if your team works in a localized portal — this kind of detail is easy to lose and can cost significant troubleshooting time down the line. Has anyone else run into similar localization-related quirks in Sentinel or Logic Apps? Would be curious to hear about other cases in the comments.31Views0likes0CommentsThe Hidden Reason Your Sentinel Playbook Won't Show Up in Automation Rules (It's Not RBAC)
If a Logic App using the native Microsoft Sentinel incident trigger doesn't show up in the "Run playbook" picker of an Automation Rule — even though permissions, region, and connection are all correct — check the internal action name of the trigger in the JSON code view. If the Logic App was created while the Azure portal was set to a non-English language, the designer may generate a localized action name instead of the expected Microsoft_Sentinel_incident, and the playbook won't be picked up. Environment Microsoft Sentinel (Log Analytics workspace) Logic Apps (Consumption plan) Trigger: native Microsoft Sentinel connector, "Incident" trigger (/incident-creation path) Authentication: system-assigned Managed Identity Same subscription, resource group, and region as the Sentinel workspace Problem Two Logic Apps, both triggered by the native Microsoft Sentinel incident trigger, both using a system-assigned managed identity with the Microsoft Sentinel Responder role granted on the workspace. Same subscription, same resource group, same region. Only one of the two appeared in the "Run playbook" dropdown when configuring an Automation Rule in Sentinel. The other was simply absent — no error message, no warning, nothing in the run history to explain it. Investigation The usual suspects were checked and ruled out one by one: API connection health — one azuresentinel connection was indeed in an "Error" state, but it turned out not to be the one referenced by the affected trigger. Managed identity RBAC — the Microsoft Sentinel Responder role was correctly assigned to the Logic App's managed identity on the Sentinel workspace. User's own RBAC/PIM role — the Logic App Contributor role (required for the account configuring the Automation Rule to even see the resource) was active via PIM at the time of testing. Region/subscription/resource group — identical for both Logic Apps. Trigger type — both used the native "Incident in Microsoft Sentinel" trigger added through the visual designer, not a generic HTTP trigger or a deprecated connector. Every documented requirement was met. The playbook was still invisible. Root Cause Comparing the raw JSON (Logic app > Development tools > Code view) revealed the actual difference. Working Logic App (visible in the picker): "triggers": { "Microsoft_Sentinel_incident": { "type": "ApiConnectionWebhook", "inputs": { "body": { "callback_url": "@{listCallbackUrl()}" }, "path": "/incident-creation" } } } Broken Logic App (invisible in the picker): "triggers": { "Incident_dans_Microsoft_Sentinel": { "type": "ApiConnectionWebhook", "inputs": { "body": { "callback_url": "@listCallbackUrl()" }, "path": "/incident-creation" } } } The connector type and the path (/incident-creation) are54Views0likes0CommentsIngestion and replication: moving from detection in hours to detection in minutes.
It seems that currently, we only become aware of a problem once there is a visible impact on tracking or on the tables consumed by the business. In many cases, the root cause appears to occur much earlier—for instance, when a package or replication process stops running correctly, starts skipping steps, or begins to accumulate delays. Would it make sense to move toward earlier detection? I was thinking of something that periodically monitors data from `replication.package` and similar sources to identify anomalies before tracking alerts are triggered: Packages that haven't run in the last *N* minutes. Failed jobs. Recurring skips. Abnormal increases in the time between executions. Growing discrepancies between expected timestamps and actual processed timestamps. It could even evolve into an agent that not only alerts but also provides context: "Package X on server Y hasn't run for 35 minutes. The last execution failed, and the likely impact is on the BayCity tracking tables." My impression is that this could help us significantly reduce detection time, since we often end up investigating only after a delay of several hours has already built up. What do you think? Is there already a tool or monitoring system in place that addresses this need—one I might not be aware of? We are working with Azure Databricks; I was planning to implement this using an agent, but I need...40Views0likes0CommentsHTTP 504 timeouts during high-volume API and webhook syncs
Hello Microsoft Tech Community, We are testing background listener stability and remote webhook payload handling when integrating enterprise Azure telemetry endpoints into automated systems. Technical Setup: Our integration architecture at Frontline Sales Consultancy (flsc.co.uk) triggers automated B2B notifications and REST API syncs over HTTPS (TLS 1.3). The Issue We're Facing: Under heavy concurrent load spikes, background POST webhook listener sockets occasionally report HTTP 504 gateway timeout responses before acknowledging payload completion. Direct REST API requests to the same remote host resolve normally under 150ms thresholds. Are there recommended network socket keep-alive settings, Azure App Service timeout adjustments, or queue worker retries to prevent connection drops during high-volume data syncs? Any advice on managing asynchronous background worker threads would be appreciated! Thanks!77Views0likes1Comment
Monitoring work from home
My boss has asked me if there is a way to see just how "busy" people who are working from home are. I have this data in Sentinel: Entra sign-in logs Defender for Endpoint logs Office 365 logs Most, if not all, on premise AD login events Netskope (current ZTNA solution) logs I have my known office location IPs so i could just exclude those and look for activity from other IPs however many times people will work in the morning or on the way to work appearing from a non corporate IP, come into the office appearing to come from a corporate IP, and then from home again in the evening. I need a way to query Sentinel looking for people who appear to be working but not coming from Corp IP. If they came from different IPs on the same day including Corp check to see if those non Corp are before and after business hours and exclude those. Anyone know of a good query to achieve this? Or maybe a tool that can extract and generate a report?36Views0likes0CommentsIntroducing Inside Microsoft Foundry: Quickstart 🎬
Discover Inside Microsoft Foundry: Quickstart, a new video series for developers building AI agents. Starting with "What does it really take to ship an AI agent?", the series explores real-world challenges such as model selection, grounding agents in data, evaluation, deployment, observability, and governance. Follow along as we show how the Microsoft Foundry ecosystem helps developers move from prototype to production, with new episodes released in the coming weeks.Partner Blog | FY27 is the year to execute on AI: A starting point for Azure partners
FY27 is the year to execute on AI. For Azure partners, that means moving more customer AI initiatives into production, modernizing the cloud, data, application, security, and governance foundations they depend on, and connecting those investments to outcomes customers can measure. Across the partner ecosystem, you are starting from different places. Some partners are already scaling AI solutions in production. Others are modernizing legacy environments, unifying data, or strengthening security and governance so customers are ready for what comes next. The opportunity is to understand where each customer is today and create a practical path forward. Microsoft has aligned FY27 customer conversations, go-to-market guidance, incentives, skilling, and partner resources around that goal. The focus is less on starting with a product and more on starting with what the customer is trying to achieve. In July, MCAPS Start for Partners and the Microsoft Partner FY27 GTM Kickoff laid out that direction. If you missed the events or want to revisit a specific topic, the content is available on demand: Watch MCAPS Start for Partners on demand Explore the Microsoft Partner FY27 GTM Kickoff The more important question now is what you do with that guidance. Turn customer priorities into Core and Frontier conversations Customers rarely begin by asking for a portfolio of technologies. They begin with a challenge, an ambition, or an outcome: modernize an aging application, make fragmented data useful, strengthen security, improve employee productivity, automate a process, or create a new customer experience. That is the starting point for FY27. Core conversations establish the foundation customers need to become AI-ready. Depending on the customer, that can mean modernizing infrastructure and applications, bringing data together on a governed platform, improving security, or establishing the controls required to operate AI with confidence. Continue reading here149Views0likes0CommentsAI Gateway tier of Azure API Management — August 2026 updates
The August 2026 update for the AI Gateway tier (preview) of Azure API Management introduces new capabilities for observing AI workloads and governing model spend. Release highlights Richer OpenTelemetry observability: AI Gateway can now emit logs, distributed traces, token metrics, and estimated cost metrics through the OpenTelemetry Protocol. The built-in monitoring experience helps teams investigate model and MCP tool activity, policy execution, latency, errors, token consumption, and individual traces. Model cost monitoring and budget enforcement: Teams can review estimated model spend by API key and model, then use cost limit policies to set calendar-based budgets and block requests when configured limits are reached. The release also streamlines Microsoft Foundry model imports, refines provider onboarding, improves portal reliability and error guidance, expands Anthropic Messages compatibility, and adds an in-product What's new experience. For configuration guidance, important upgrade information, and the complete list of changes, read the full August 2026 release notes in the AI Gateway portal. Try the latest capabilities in the AI Gateway portal.496Views0likes0CommentsWho Can Access What? Designing RBAC and Identity in Azure
Who should be allowed to access an Azure resource? Azure makes it easy to create resources. The harder question comes afterwards: who should be allowed to access them? A Function App may need to read secrets from Key Vault. A Logic App may need to call APIs through API Management. A developer may need to deploy to Dev but have no access to Production. A CI/CD pipeline may need to deploy infrastructure without becoming an Owner of the entire subscription. This is where Azure Role-Based Access Control (RBAC) and Managed Identity become critical. In this article, I look at how to design access around people, applications and deployment pipelines, while keeping permissions as narrow as practical. The article covers: Azure RBAC and access scopes Least-privilege access Managed Identities Developer vs Production access boundaries Application identities CI/CD deployment permissions RBAC vs API authentication Privileged access and PIM Common RBAC design mistakes One of the key principles is simple: Give an identity only the permissions it actually needs. For example, if a Function App only needs to read secrets from Key Vault, giving it Contributor access to the entire Resource Group solves the problem with a much broader permission than necessary. Good RBAC design is not about assigning more permissions. It is about understanding: Who needs access? Why do they need it? What exactly do they need to do? At what scope should access be granted? How can that access be managed securely over time? I would be interested to hear how others approach RBAC and identity design in enterprise Azure environments. Full article: https://www.linkedin.com/pulse/who-can-access-what-designing-rbac-identity-azure-chethan-raj-ud6gc/87Views0likes0Comments