azure
8181 TopicsOptimizing Oracle-to-Power BI Performance and the Path to Modern Analytics
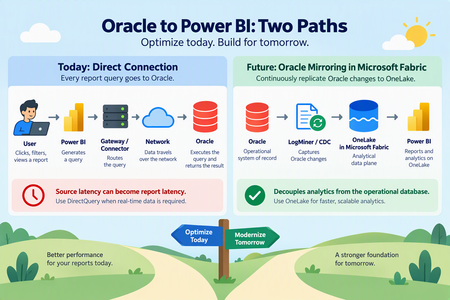
Organizations frequently rely on Oracle databases for large-scale operational workloads while using Microsoft Power BI as their enterprise analytics and visualization platform. Although connecting Power BI directly to Oracle is fully supported, performance can become challenging as datasets grow into the millions of rows. A recent enterprise scenario involving millions of Oracle records illustrates an important principle: Oracle-to-Power BI performance should not be attributed to a single component without first isolating the entire retrieval path. This article provides a practical framework for optimizing that architecture today, while also examining how Microsoft Fabric Mirroring can provide a different data-access pattern for future analytics workloads. The Performance Challenge Consider an Oracle environment containing approximately 15 million records. Testing showed substantially different behavior depending on the client used to retrieve the same Oracle data: A direct Oracle query executed through TOAD returned millions of rows in about eight minutes. Tableau connected to the same Oracle table from the same laptop and refreshed millions of rows in 20 to 30 minutes. Power BI Desktop, however, continued processing for multiple hours before the operation was terminated by network or database controls. Importantly, the Power BI query did not contain additional Power Query transformations. The customer was directly executing SQL and loading the resulting data. This is an extremely useful diagnostic comparison because it demonstrates that Oracle is capable of returning the underlying dataset considerably faster than the Power BI test. It does not, however, prove that the Power BI Oracle connector itself is the single root cause. Performance Is a Pipeline, Not a Single Component Oracle-to-Power BI performance involves several layers: A bottleneck at any one of these layers can affect overall refresh or query performance. Therefore, the first architectural principle is: Measure every layer before attempting to tune the entire solution. A troubleshooting exercise should evaluate: Oracle server-side execution time SQL execution plan Oracle provider/client behavior FetchSize behavior Network transfer Power Query evaluation Query folding Power BI model processing Report design Gateway behavior when the Power BI Service is introduced This approach avoids prematurely concluding that Oracle, Power BI, the gateway, or the connector is inherently responsible for the slowdown. Start With the Oracle Provider Power BI currently provides two important approaches for Oracle connectivity. Built-in Oracle provider Modern versions of Power BI Desktop include Microsoft's bundled Oracle Managed ODP.NET provider. This reduces the dependency on separately installing Oracle client software. For environments using the built-in provider, testing should be performed with a current Power BI Desktop release because provider behavior and defaults can change between releases. Oracle Client for Microsoft Tools Oracle Client for Microsoft Tools, or OCMT, remains another supported option. OCMT configures Oracle Data Provider for .NET and can therefore be tested independently from the built-in provider. This gives architects a useful isolation mechanism: Test A: Built-in Oracle provider vs. Test B: OCMT provider. Use the same: workstation SQL statement Oracle database table credentials network path expected row count Changing several variables simultaneously makes the results considerably harder to interpret. Understand FetchSize One of the most important areas identified during troubleshooting is FetchSize. FetchSize controls how much data the Oracle provider retrieves during each fetch operation. For large datasets, a small FetchSize can require many retrieval operations, increasing overhead. Increasing FetchSize allows the provider to retrieve more data at a time and may improve throughput. However, FetchSize tuning should be tested independently from the choice of Oracle provider. Switching to OCMT, for example, does not by itself demonstrate whether FetchSize tuning improves performance. Benchmark the same SQL and dataset using consistent test conditions and compare elapsed time and throughput. FetchSize controls how much Oracle data the provider pulls back in each retrieval batch. Think of FetchSize like the size of a delivery truck. Imagine Power BI needs to retrieve a very large dataset from Oracle. Small FetchSize: Oracle → 📦 → Power BI Oracle → 📦 → Power BI Oracle → 📦 → Power BI Oracle → 📦 → Power BI ...many retrieval operations Larger FetchSize: Oracle → 📦📦📦📦📦 → Power BI Oracle → 📦📦📦📦📦 → Power BI ...fewer retrieval operations The idea is simple: FetchSize determines how much data the Oracle provider fetches at a time. Examine Oracle Data Types FetchSize is not the only provider consideration. Schema matters. A troubleshooting package should include the table DDL rather than only a list of column names. Pay particular attention to large-object types such as: BLOB CLOB Large-object columns may materially change retrieval behavior and can make simply increasing FetchSize insufficient. Therefore capture: complete table DDL column names Oracle data types row width presence of BLOB/CLOB columns expected total result size Do not optimize FetchSize without understanding the shape of the data being transferred. Filter Rows and Columns as Early as Possible Probably the most universally applicable Power Query optimization is also one of the simplest: Do not retrieve data you do not need. Instead of retrieving every row and column and filtering afterward, reduce the dataset at Oracle whenever possible. Good Oracle SQL should therefore: select only required columns apply restrictive predicates at the source aggregate at Oracle where appropriate avoid unnecessary data transfer This matters substantially when Power BI and Oracle are separated by a network boundary. Preserve Query Folding Power Query query folding allows Power BI transformations to be translated back into SQL executed by the relational source. For relational sources such as Oracle, maintaining folding can substantially reduce the amount of work performed by the Power Query mashup engine. The preferred pattern is: Where practical: filter early remove unnecessary columns early avoid transformations that unexpectedly break folding inspect where folding stops push relational operations back into Oracle For DirectQuery, folding is particularly important because the source remains part of the interactive report-query path. Be Careful With Native SQL and Incremental Refresh Native SQL can be extremely valuable for troubleshooting. Running the same targeted SELECT statement through Power BI that is executed directly against Oracle creates a useful A/B test. It helps isolate questions such as: Is Oracle itself taking a long time? Is Power BI generating a different query? Is additional processing happening after Oracle returns the data? Is the retrieval/provider layer adding significant latency? However, architecture matters. Power BI guidance warns that later Power Query steps cannot necessarily fold after a native SQL query, and native SQL has important implications for incremental refresh. Therefore, native SQL is useful both as an optimization technique in some architectures and as a diagnostic isolation technique, but it should not automatically be substituted for a well-folded Power Query design. Prefer Import for Traditional Oracle BI Workloads If the business does not require near-real-time data, Import should generally be evaluated before DirectQuery for large Oracle analytical workloads. With Import: The latency of Oracle, networking, and the provider is mostly experienced during refresh rather than repeatedly during user interaction. This usually provides a more predictable interactive experience. DirectQuery produces a different dependency chain: As a result, source latency can become report latency. Use DirectQuery when its architectural benefits are required, rather than simply because the source database supports it. Make Incremental Refresh Truly Incremental Import does not necessarily mean repeatedly loading the entire Oracle dataset. For large fact tables, incremental refresh should be evaluated so that only required partitions are refreshed. However, there is an important condition: RangeStart and RangeEnd filtering needs to be pushed back to Oracle. If partition filters do not fold, Power BI can end up retrieving considerably more source data than expected before applying the filtering. Therefore incremental refresh testing should verify that the Oracle query generated by Power BI contains the expected predicates. Treat the Gateway as Its Own Performance Layer Once the workload moves into the Power BI Service, however, the on-premises data gateway becomes another measurable component. For production deployments examine: gateway version Oracle provider/client version CPU memory network proximity to Oracle refresh concurrency DirectQuery concurrency competing workloads Where necessary, large refresh workloads and latency-sensitive DirectQuery workloads can be isolated onto different gateway resources. Do not diagnose gateway performance from a Power BI Desktop test where the gateway is not involved. Optimize DirectQuery If It Cannot Be Avoided Sometimes Import is not viable because users require data with very low latency. If Oracle must remain behind DirectQuery, reduce unnecessary work at every level. At Oracle index frequently filtered columns appropriately review execution plans select only necessary columns reduce returned rows avoid unnecessarily expensive calculations In Power Query maintain query folding push filtering to Oracle minimize transformations requiring local evaluation In the semantic model use efficient dimensional modeling avoid unnecessary high-cardinality columns consider aggregation strategies where appropriate In reports limit visual density use selective filters avoid generating unnecessary simultaneous source queries test with realistic user concurrency DirectQuery performance needs to be assessed as an end-to-end architecture, rather than as an individual SQL benchmark. Collect Diagnostics Before Declaring a Root Cause For difficult Oracle performance cases, establish a repeatable diagnostic package. Capture: Oracle database version execution plan SQL execution duration table DDL data types row count approximate returned data size Provider built-in provider versus OCMT provider/client version FetchSize configuration Power BI Power BI Desktop version generated SQL Query Diagnostics Mashup traces Applied Steps or M code total execution time Network Oracle-to-client path throughput latency connection interruptions or timeouts Comparison clients If Tableau or another Oracle client appears dramatically faster, reproduce the same SQL, same columns, same records, same database and preferably the same machine. Only then does the comparison become a useful engineering benchmark. Future Architecture: Oracle Mirroring in Microsoft Fabric Optimizing the direct Oracle connection solves one class of problem. Microsoft Fabric Mirroring provides a different architecture altogether. Instead of repeatedly placing Oracle in the analytical query path, Fabric can continuously replicate Oracle changes into OneLake. Conceptually: Fabric Mirroring uses Oracle LogMiner to capture changes and maintain an analytical copy in OneLake. This separates many downstream analytical reads from the operational Oracle database. The key architectural advantage isn't simply "a faster connector." The advantage is decoupling analytics from the operational database. Recommended Architecture Decision Tree Requirement: traditional BI with scheduled freshness Use: Oracle → Import → Power BI semantic model. Then optimize: FetchSize provider query folding source-side filtering incremental refresh Requirement: operational or near-real-time reporting where Oracle must remain the source Evaluate: Oracle → DirectQuery → Power BI. But aggressively optimize: Oracle SQL execution plans query folding visual density provider configuration concurrency gateway architecture Requirement: enterprise analytics with frequent Oracle changes and growing BI/AI requirements Evaluate: Oracle → Fabric Mirroring → OneLake → Fabric / Power BI. This reduces repeated analytical pressure against the operational Oracle environment and creates a reusable analytical data foundation for additional workloads. A Practical Troubleshooting Sequence A useful Oracle-to-Power BI performance investigation can be organized into five phases. Phase 1: Establish the Oracle baseline Execute exactly the same query directly against Oracle. Record: SQL → rows → bytes → execution time Phase 2: Isolate the provider Run the same dataset through: Built-in Oracle provider and OCMT. Record the results independently. Phase 3: Test FetchSize Test controlled FetchSize values while holding every other variable constant. Measure throughput rather than relying on subjective impressions. Phase 4: Optimize Power Query Validate: query folding source filtering column projection transformations incremental refresh behavior Phase 5: Decide whether the architecture itself should change If extremely large Oracle datasets must continually feed analytical workloads, consider whether repeatedly querying Oracle remains the appropriate long-term design. At that point, Fabric Mirroring becomes an architectural discussion rather than simply another troubleshooting step. Final Takeaway Oracle-to-Power BI performance problems should not immediately be categorized as an Oracle problem, a Power BI problem, or a gateway problem. They are usually best investigated as a data retrieval pipeline. For existing Power BI architectures, the strongest optimization sequence is: Efficient Oracle SQL For the longer term, Microsoft Fabric Mirroring changes the architecture: Oracle becomes the operational system of record while OneLake becomes the analytical data plane. That separation can be particularly valuable as organizations expand from traditional Power BI reporting into broader Fabric analytics, data engineering and AI workloads.23Views0likes0Comments
Cannnot delete tenant
Hello, I am trying to delete one of our customers MS 365 Tenant, however this seems to keep failing due to a single Application Registration which cannot be deleted through Entra ID. The error i am getting is "Failed to delete application Tenant Schema Extension App. Error detail: Deletion of system application is not allowed." I have looked online for solutions but the only solution i can find is "Create a support ticket". I would love to do this but there is no support contract linked to this tenant so that option is not available. Any help would be appreciated! Kind regards, Jos Verhallen8Views0likes0Comments
What is the best way to handle networking during a long-running cloud migration?
Hi everyone, I'd like to get some opinions from people who have worked on large-scale cloud migrations. Consider a migration where workloads are gradually moved from AWS to Azure over several weeks or months rather than being migrated in a single cutover. During the migration period, both environments need to remain operational. A simplified architecture could look like: AWS workloads | | Existing connectivity | AWS Network | | Inter-cloud connectivity | Azure Network | | Azure workloads The challenge is that applications may temporarily become distributed across both clouds. For example: • Application servers may still be running in AWS. • New application components may already be deployed in Azure. • Databases or shared services may remain in AWS temporarily. • DNS and routing may need to support both environments. • Migration tools may require connectivity to source and target environments. • Some workloads may be migrated much earlier than their dependent services. For a long-running migration like this, what architecture would you recommend? Some options I have been considering are: 1. Site-to-site VPN between AWS and Azure 2. Dedicated connectivity such as AWS Direct Connect + Azure ExpressRoute 3. A combination of dedicated connectivity and VPN for backup 4. A hub-and-spoke architecture in Azure with controlled connectivity back to AWS 5. Application-level connectivity rather than relying heavily on network-level connectivity Another question is how you would handle routing. Would you prefer to: • Keep AWS and Azure routing domains mostly independent? • Use a centralized hub for cross-cloud traffic? • Advertise routes dynamically using BGP? • Restrict cross-cloud communication to only the application dependencies that require it? For a migration lasting several months, what approach have you found to be the most reliable and easiest to operate? I'm particularly interested in lessons learned around: • Routing • DNS • Security • Latency • Failover • Monitoring • Avoiding unexpected cross-cloud traffic costs Would appreciate experiences from anyone who has handled a production AWS-to-Azure or Azure-to-AWS migration.Should AI agents receive permissions dynamically instead of having fixed access?
Hi everyone, As AI agents move from simple chat-based assistants toward performing real actions—such as querying databases, creating resources, modifying configurations, sending notifications, or executing workflows—I have been thinking about how their permissions should be designed. A traditional application typically has a relatively well-defined permission model. An AI agent, however, may perform different tasks depending on the conversation and the user's request. For example: • Task A may only require read access. • Task B may require creating a resource. • Task C may require modifying an existing configuration. • Task D may involve a potentially destructive operation. This raises an interesting security question: Should an AI agent have a fixed set of permissions for its entire lifetime, or should permissions be granted progressively based on the task it is currently performing? For example: User → AI Agent → Read-only permissions Then, if the user explicitly requests a change: User approval → Temporary elevated permission → AI Agent performs the operation → Permission revoked I see some potential advantages to this approach: 1. Reduced blast radius if the agent behaves unexpectedly. 2. Better alignment between permissions and the actual task. 3. Easier auditing of elevated operations. 4. Reduced risk from prompt injection or unintended actions. 5. Human approval could be required only for high-impact operations. However, it also introduces additional complexity around identity, token issuance, approval workflows, session management, and auditing. I'm curious how others are approaching this. Would you prefer: A. Fixed least-privilege permissions for each agent B. Dynamic/task-based permissions C. Fixed permissions with human approval for sensitive operations D. A combination depending on the workload For production AI agents, which model do you think provides the best balance between security and usability? Would be particularly interested in experiences from people implementing agents in enterprise environments.6Views0likes0Comments
When Should Enterprise AI Workflows Use Azure Logic Apps, Durable Functions, or Power Automate?
As AI-enabled business workflows become more complex, the orchestration layer becomes just as important as the AI model itself. I’m interested in how teams are deciding between Azure Logic Apps, Durable Functions, and Power Automate when building production workflows that may include AI models or agents. For example, consider a workflow such as: AI request → data lookup → business-rule validation → external API call → human approval → final action Some areas I’m particularly interested in: When is Logic Apps the better option for integration-heavy workflows? When do Durable Functions become preferable for stateful or long-running processes? Where does Power Automate fit for business-user-driven automation? How are teams handling retries and partial failures? What patterns work best when an AI agent is only one component of the overall workflow? How are human approval steps being implemented? I’d be interested to hear how others are approaching this architecture in production environments.37Views0likes0CommentsAzure Databricks Cost and Workload Assessment: a Local Web UI
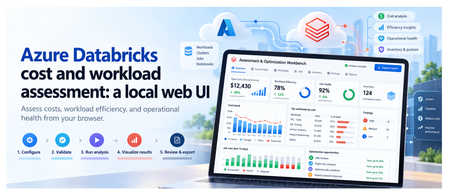
Introduction To review an Azure Databricks environment, you need to know what it costs, how its compute is used, and which jobs need attention. That information is spread across Azure billing and Databricks. The Assessment & Optimization Workbench is a local web application that brings these details together. Select your workspaces and dates, check access, and run an assessment. You can then explore the results in your browser and download a report to discuss with your team. The walkthrough below shows each step. 1. What you can assess The assessment covers costs, workload behavior, and selected configuration checks: Area What you can inspect Cost Actual and Amortized costs, top drivers, attribution gaps, and commitment scenarios with eligible hourly inputs. Efficiency CPU/memory samples, idle observations, sizing candidates, query duration, and queueing. Job health Failures, retries, failure notifications, and network observations. Inventory and posture Workspace assets, IP access list settings, and Unity Catalog metastore assignment. Evidence Collection coverage, snapshots, raw-data imports, and offline re-analysis. Handoff Prioritized findings, optional review decisions, formatted reports, and Excel exports. If some data could not be collected, the UI shows what is missing. Recommendations are suggestions for you to review and test; the assessment does not apply them automatically. Actual savings must be measured after you make the recommended changes. 2. The five-step workflow The UI guides you from choosing what to assess to downloading a report. First, select your workspaces and check access. Then start the assessment, explore the results, and export what you need. The walkthrough below shows each step. Configure → Validate → Run analysis → Visualize results → Review & export Configure This Configure step defines what the assessment will cover: which workspaces to review, the date range, and the data to collect. These choices prepare the assessment; they do not start collection. The GIF shows the scope selection, warehouse choices, and date settings before moving to validation. Select the scope: choose the subscriptions, resource groups, and Databricks workspaces to include. Set the dates and cost basis: choose the period to assess. ActualCost shows charges as recorded; AmortizedCost spreads eligible commitment costs over time. Choose the collection profile: use Standard for core assessment data, Extended to include workspace asset metadata, or Custom to select optional data and analysis modules. Select SQL Warehouses: choose a warehouse for each workspace that needs system-table queries. Selection does not start compute. Queries can incur charges, so warehouse use requires approval in Validate. Next: Select Validate configuration. Validate Validation checks your setup and access to the selected Azure and Databricks data. It helps you identify missing permissions or approvals before starting the assessment. Select Run validation, approving warehouse auto-start if required. The UI shows which checks are running, which have passed, and what needs attention. The GIF shows an approval issue being resolved, followed by the access checks. Fix any blockers that prevent the assessment from running, and read warnings about data that may be limited or unavailable. If permissions are missing, the permission panel provides commands for an authorized administrator to run. Validation itself does not grant access. Next: Once validation allows you to proceed, select Continue to run below the permission panel. You will review the setup and start the assessment separately. Run analysis This step collects data from your selected Azure and Databricks workspaces, analyzes it, and creates the assessment report. You can follow the progress and see which sources returned data. Review the selected workspaces and date range, then select Start read-only assessment. The screen shows: Progress: the current stage, from initial checks and collection through analysis and report generation, plus elapsed time. Collection sources: cards grouped into Azure data and Databricks workspaces. Each card shows its status and the number of items collected, such as cost records, inventory, or billing data. Console: detailed messages to help explain delays or collection problems. When the run finishes, green means collection and analysis succeeded, not that every workload is healthy. Red means the run failed or some data needs attention. A skipped source was not collected, often because an optional check was not selected. The report and collected data are saved locally, including any reported gaps. Next: Select Visualize results to explore the saved assessment. Visualize results This step turns the collected data into charts, tables, and findings you can explore. Start with the overall cost and collection summary, then look at individual workspaces, compute resources, and jobs to understand what needs attention. You are viewing saved results, so switching tabs does not collect data again. The GIF follows the results from cost and workload details through findings, data quality, and a proposed roadmap. The tabs are grouped into Overview, Technical, and Decisions. Overview: understand the cost Executive summary: see total cost, spending mapped to workspaces, optimization candidates, and collection status. Check whether the detailed costs match the billing total and how much supporting data is available. Cost analysis: use Cost evidence to compare Actual and Amortized trends. Break down spending by Service, Meter category, SKU, Resource group, Workspace, or Owner tag, then inspect the largest cost drivers and unmapped spend. Commitment opportunities lets you enter a proposed number of committed nodes and calculate a scenario when the required hourly usage and pricing data is available. It does not purchase a commitment. Technical: inspect resources and workloads Compute and SQL has five views: Inventory: cluster and warehouse settings, including node types, worker counts, Photon, and automatic shutdown, plus job run and failure summaries. Utilization: CPU, memory, idle observations, and sample counts. Select a resource and a driver or worker instance to view its CPU and memory chart. Sizing: current node and worker configuration, with candidates to benchmark before resizing. Job health: runs, failures, notification settings, tasks, and retry policies. Network: data sent and received by nodes, plus CPU-wait measurements. These are traffic observations, not billed network charges. Queries: switch between Individual queries, Warehouse summaries, and User summaries. Review durations, queue times, and failures; search and sort to find queries that need investigation. Posture: inspect IP access list settings and Unity Catalog metastore assignment. Each check shows its observed value and outcome; this is not a full security audit. Assets: browse collected repositories, notebook metadata, MLflow experiments, serving endpoints, SQL alerts, Genie spaces, and Unity Catalog volumes. These appear only when the relevant optional data was collected. Decisions: check findings and plan the next steps Findings: browse recommendations by category, status, and confidence. Select a row to read what was observed, the recommended next step, supporting records, and any limitations. Evidence quality: see coverage by workspace, missing data, failed or skipped sources, and records excluded from scope. Open Inspect effective rules / create another analysis to review or change analysis settings, then Create child analysis to rerun them on saved data without changing the original snapshot. Roadmap: review proposed work across Days 0-30, 31-60, and 61-90, including owners and dependencies. The measurement plan explains the baseline for checking savings after a change; the roadmap is not an approved implementation schedule. Use Filters to narrow findings by subscription, resource group, workspace, workload, category, confidence, or status. Scope selections also apply to supported technical tables, which have their own search, sorting, and paging controls. Select a resource name to inspect its saved details. If data is unavailable, check Evidence quality before drawing a conclusion. A missing measurement does not mean that a resource was unused. Next: Select Review & export to read the report or download the results. Review & export This final step lets you read the assessment report and download files to discuss with your team. You can also record decisions on individual findings. Review is optional, so you do not need to approve every finding before exporting. The GIF shows a finding being reviewed, the formatted report and supporting files being opened, and an Excel workbook being generated and downloaded. Read the report: select Preview report to move directly to the formatted report in your browser. Use its contents links to jump to sections, and open supporting evidence links to inspect the saved files. Download the report: select Download report to save the original Markdown version. Downloading a file completes this workflow step, but does not approve findings or apply changes. Record a decision: expand Record a decision, choose a finding and decision, then enter the reviewer and an optional note. Select Save review decisions to retain the changes. A decision other than pending requires a reviewer. Inspect supporting files: use Run artifacts to preview supported files or download individual outputs. Reports appear as formatted pages; CSV and JSON previews show the file contents as text. Create an Excel workbook: choose the modules under Excel workbook, then select Generate workbook artifact and download the generated file. It includes summary, rules, quality, findings, saved review decisions, and the selected module sheets. It covers the full saved assessment, not just the rows currently filtered in the UI. Save or discard pending review edits before generating a workbook. Exports include saved decisions only. Check the files before sharing them because supporting evidence can contain sensitive environment details. Optional dashboard publication is a separate cloud action for publishing coverage counts, not the full assessment. It requires a destination workspace and warehouse, a preview of the publication plan, and explicit approval of the write and possible warehouse charges. 3. Reopen saved assessments A snapshot is a locally saved assessment, including the selected scope, collected data, findings, reports, and review decisions. It lets you return to earlier results, continue a review, or download files later without querying Azure or Databricks again. Reopen an assessment: choose a run from Saved snapshots. Entries show the run date, customer, status, and run ID, with the newest first. You can then explore its results or continue in Review & export. Try different analysis settings: open Evidence quality, expand Inspect effective rules / create another analysis, adjust the settings, and select Create child analysis. This creates a separate assessment using the same saved data. The original remains unchanged, and the new findings need their own review. Remove old assessments: use Manage snapshots to delete individual snapshots or clear the saved history. Deletion requires confirmation and permanently removes the selected runs, including their evidence, reports, and review decisions. Back up important runs first. Snapshots show what was collected at the time, not the current environment. To get newer data or collect a missing source, start a new assessment. 4. Architecture and collection flow The workbench runs on your machine, with a browser interface connected to a local Python server at http://127.0.0.1:8765. Azure and Databricks supply the data; collection scripts, analysis, and saved results stay local. No Azure-hosted application is needed. The diagram follows an assessment through seven stages: Configure: the React and TypeScript browser UI captures your selected workspaces, dates, and collection options. Coordinate: the Python API receives requests from the browser, launches assessment processes, and tracks progress. Check access: validation checks the selected scope, permissions, and required approvals. These checks use live access, but full collection starts only when you select Start read-only assessment. Collect: PowerShell scripts read Azure resource inventory and billing data, plus Databricks APIs and system tables. Requests to these external sources use HTTPS. Save evidence: each run stores the returned data, configuration, source outcomes, and logs in a local folder. Analyze: Python combines the saved data, checks costs against billing totals, identifies data gaps, and applies rules to produce findings and reports. Review and export: the API returns saved results to the browser, where you explore findings, record decisions, and download reports or data files. Keep in mind: the assessment does not apply recommendations. SQL Warehouse queries can incur charges, and exported files should be checked for sensitive details before sharing. 5. Get started Try it Prerequisites: PowerShell 7+, Python 3, Node.js 22.12+/npm for the build, and Azure CLI signed in. Collection needs Azure Reader/Cost Management Reader and the required Databricks source access. From the repository root: Set-Location .\ui npm ci npm run build Set-Location .. .\ui\Start-AssessmentUi.ps1 Open http://127.0.0.1:8765 and keep the launcher running. If already built, only the final command is needed. Learn more User guide Required permissions Test record and limitations Contribute Report issues in the repository with reproduction steps and redacted source statuses. Never include credentials or raw customer evidence. Publishing check: redact environment identifiers in GIFs and upload media when posting outside the repository. Displayed timings and amounts are not benchmarks or savings claims.276Views5likes3Comments
Matching customer invoices to multiparty private offers
What’s the best way for a reseller to match an Azure Marketplace customer invoice to its multiparty private offer and subscription in Partner Center? We’ve had invoices missing from our reporting and multiple charges tied to the same offer with different Asset IDs. Which reports or fields should we use to match them? Can we also see whether a credit was issued, or does that require the customer’s billing access or Microsoft Support?11Views0likes0Comments
Partner credits (billing profile redemption): Cost Analysis shows $0 everywhere
Hi all, I'm a Microsoft partner (MAICPP, Partner Success Core) and I'm stuck on cost visibility for the Azure credit benefit. Has anyone run into this with the new redemption model? Redeemed the $2,400 Azure credit in Sep 2026 through the new Partner Center flow, where credits are deposited directly onto an MCA billing profile. No separate "sponsored" subscription was created. The credit sits on the billing profile and applies to the subscriptions under it. The subscription runs Azure DevOps and Microsoft Fabric. The problem Billing profile > Payment methods > Azure credits shows the credit as Active, with about $320 already consumed (balance around $2,079). Cost Analysis shows $0.00 for everything, at both subscription scope and billing account scope. Services appear in the breakdown, but every value is zero and Actual cost shows "--". So the credit is clearly being drawn down, but I can't see what is consuming it. What I already know / tried I know Cost Analysis doesn't show credits themselves, but it should still show pre-credit usage cost for an Azure plan subscription. The older threads about Sponsorship subscriptions (MS-AZR-0036P) and microsoftazuresponsorships.com seem to describe the legacy model, not this one. I've seen that Microsoft documents a "Transactions" view on the credit resource for MAICPP credits issued after Aug 1, 2026, but I'm still checking it. Questions Has anyone on the new billing profile model seen Cost Analysis stay at $0 while credits were consumed? Did it eventually fix itself? Where did you finally get per-resource usage? The credit Transactions page, the usage CSV on the invoice, the Cost Details or Consumption APIs, or a support ticket? If you opened a billing ticket, what did support say? Is this expected or a bug? Any tips for budgets or alerts while credits are active, so usage doesn't burn silently? Thanks!42Views0likes1CommentPlanning your move to Microsoft Defender portal for all Microsoft Sentinel customers
In November 2023, Microsoft announced our strategy to unify security operations by bringing the best of XDR and SIEM together. Our first step was bringing Microsoft Sentinel into the Microsoft Defender portal, giving teams a single, comprehensive view of incidents, reducing queue management, enriching threat intel, streamlining response and enabling SOC teams to take advantage of Gen AI in their day-to-day workflow. Since then, considerable progress has been made with thousands of customers using this new unified experience; to enhance the value customers gain when using Sentinel in the Defender portal, multi-tenancy and multi-workspace support was added to help customers with more sophisticated deployments. Our mission is to unify security operations by bringing all your data, workflows, and people together to unlock new capabilities and drive better security outcomes. As a strong example of this, last year we added extended posture management, delivering powerful posture insights to the SOC team. This integration helps build a closed-loop feedback system between your pre- and post-breach efforts. Exposure Management is just one example. By bringing everything together, we can take full advantage of AI and automation to shift from a reactive to predictive SOC that anticipates threats and proactively takes action to defend against them. Beyond Exposure Management, Microsoft has been constantly innovating in the Defender experience, adding not just SIEM but also Security Copilot. The Sentinel experience within the Defender portal is the focus of our innovation energy and where we will continue to add advanced Sentinel capabilities going forward. Onboarding to the new unified experience is easy and doesn’t require a typical migration. Just a few clicks and permissions. Customers can continue to use Sentinel in the Azure portal while it is available even after choosing to transition. Today, we’re announcing that we are moving to the next phase of the transition with a target to retire the Azure portal for Microsoft Sentinel by July 1, 2026. Customers not yet using the Defender portal should plan their transition accordingly. “Really amazing to see that coming, because cross querying with tables in one UI is really cool! Amazing, big step forward to the unified [Defender] portal.” Glueckkanja AG “The biggest benefit of a unified security operations solution (Microsoft Sentinel + Microsoft Defender XDR) has been the ability to combine data in Defender XDR with logs from third party security tools. Another advantage developed has been to eliminate the need to switch between Defender XDR and Microsoft Sentinel portals, now having a single pane of glass, which the team has been wanting for some years.” Robel Kidane, Group Information Security Manager, Renishaw PLC Delivering the SOC of the future Unifying threat protection, exposure management and security analytics capabilities in one pane of glass not only streamlines the user experience, but also enables Sentinel customers to realize security outcomes more efficiently: Analyst efficiency: A single portal reduces context switching, simplifies workflows, reduces training overhead, and improves team agility. Integrated insights: SOC-focused case management, threat intelligence, incident correlation, advanced hunting, exposure management, and a prioritized incident queue enriched with business and sensitivity context—enabling faster, more informed detection and response across all products. SOC optimization: Security controls that can be adjusted as threats and business priorities change to control costs and provide better coverage and utilization of data, thus maximizing ROI from the SIEM. Accelerated response: AI-driven detection and response which reduces mean time to respond (MTTR) by 30%, increases security response efficiency by 60%, and enables embedded Gen AI and agentic workflows. What’s next: Preparing for the retirement of the Sentinel Experience in the Azure Portal Microsoft is committed to supporting every single customer in making that transition over the next 12 months. Beginning July 1, 2026, Sentinel users will be automatically redirected to the Defender portal. After helping thousands of customers smoothly make the transition, we recommend that security teams begin planning their migration and change management now to ensure continuity and avoid disruption. While the technical process is very straightforward, we have found that early preparation allows time for workflow validation, training, and process alignment to take full advantage of the new capabilities and experience. Tips for a Successful Migration to Microsoft Defender 1. Leverage Microsoft’s help: Leverage Microsoft documentation, instructional videos, guidance, and in-product support to help you be successful. A good starting point is the documentation on Microsoft Learn. 2. Plan early: Engage stakeholders early including SOC and IT Security leads, MSSPs, and compliance teams to align on timing, training and organizational needs. Make sure you have an actionable timeline and agreement in the organization around when you can prioritize this transition to ensure access to the full potential of the new experience. 3. Prepare your environment: Plan and design your environment thoroughly. This includes understanding the prerequisites for onboarding Microsoft Sentinel workspaces, reviewing and deciding on access controls, and planning the architecture of your tenant and workspace. Proper planning will ensure a smooth transition and help avoid any disruptions to your security operations. 4. Leverage Advanced Threat Detection: The Defender portal offers enhanced threat detection capabilities with advanced AI and machine learning for Microsoft Sentinel. Make sure to leverage these features for faster and more accurate threat detection and response. This will help you identify and address critical threats promptly, improving your overall security posture. 5. Utilize Unified Hunting and Incident Management: Take advantage of the enhanced hunting, incident, and investigation capabilities in Microsoft Defender. This provides a comprehensive view for more efficient threat detection and response. By consolidating all security incidents, alerts, and investigations into a single unified interface, you can streamline your operations and improve efficiency. 6. Optimize Cost and Data Management The Defender portal offers cost and data optimization features, such as SOC Optimization and Summary Rules. Make sure to utilize these features to optimize your data management, reduce costs, and increase coverage and SIEM ROI. This will help you manage your security operations more effectively and efficiently. Unleash the full potential of your Security team The unified SecOps experience available in the Defender portal is designed to support the evolving needs of modern SOCs. The Defender portal is not just a new home for Microsoft Sentinel - it’s a foundation for integrated, AI-driven security operations. We’re committed to helping you make this transition smoothly and confidently. If you haven’t already joined the thousands of security organizations that have done so, now is the time to begin. Resources AI-Powered Security Operations Platform | Microsoft Security Microsoft Sentinel in the Microsoft Defender portal | Microsoft Learn Shifting your Microsoft Sentinel Environment to the Defender Portal | Microsoft Learn Microsoft Sentinel is now in Defender | YouTube48KViews9likes22Comments