Forum Discussion
maggiegrigs
May 21, 2020Copper Contributor
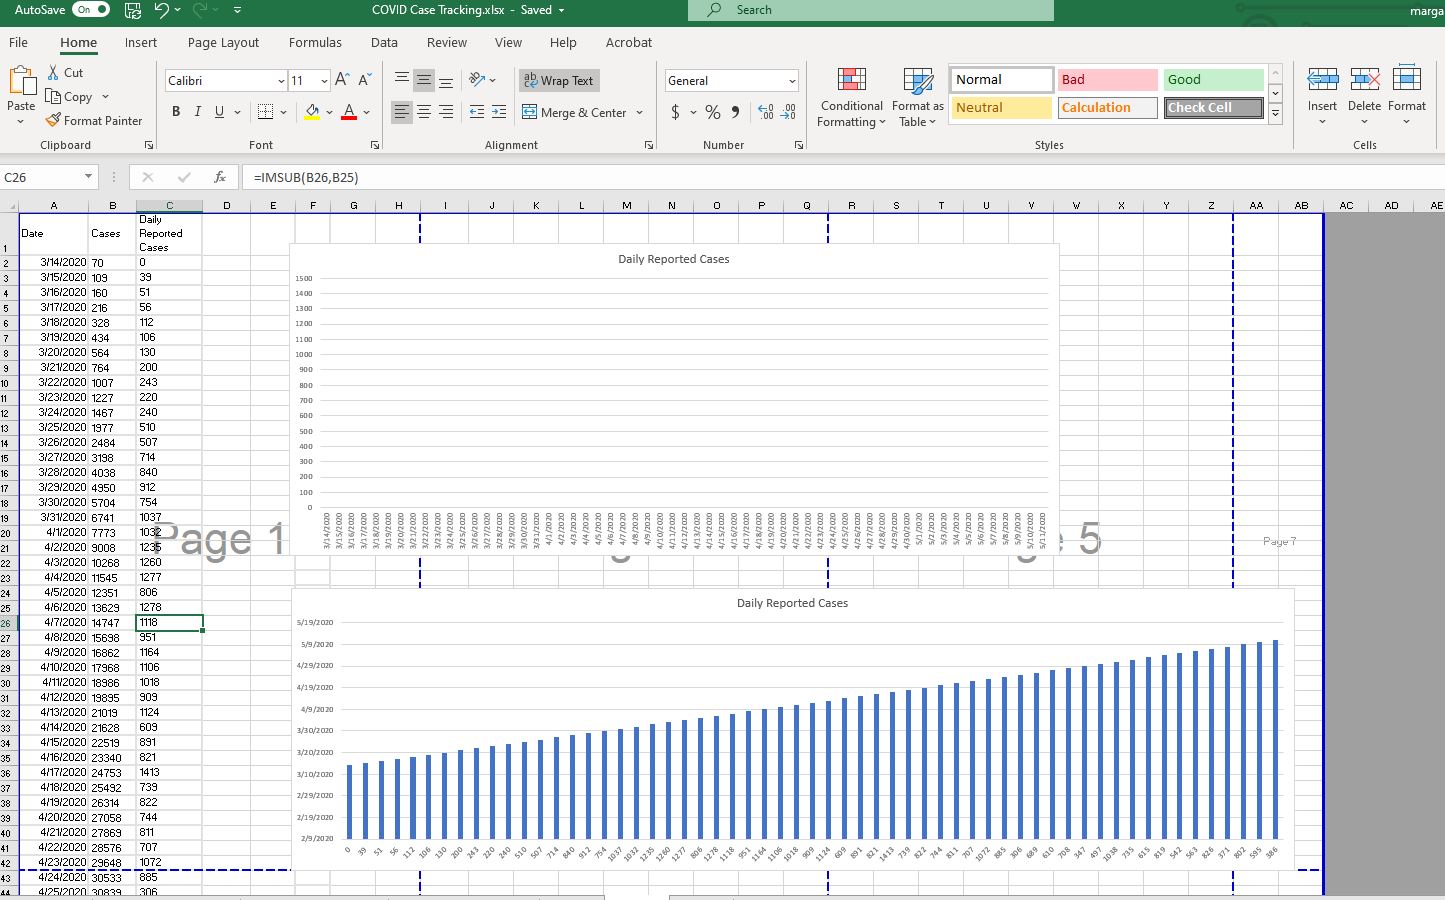
Chart values all appear in title, nothing on actual chart
ADDITION (original post below): I used the =SERIES function to get a chart with the X and Y axis with the correct numbers, but I can't get any bars to show up. See "NEW" attached image.
ORIGINAL:
I am trying to make a basic bar chart of values and dates.
- Column A is dates.
- Column C is a list of plain numbers.
- Column B is =IMSUB(C3,C2) -- the difference between numbers, cell by cell, in Column C.
I've attached a picture of what I get when I select A1thru B20 --> Insert --> 2D Column.
All of the values from B1-B20 in the title
- "Daily Reported Cases #NUM! 39 51 56 112 106 130 200 243 220 240 510 507 714 840 912 754 1037 1032 1235 1260"
A single date at the bottom
- "4/1/20" which is the value of B20
Numbers along the side
- 0.00 at the bottom, 1.00 at the top
What on earth is happening???
1 Reply
- Riny_van_EekelenPlatinum Contributor
maggiegrigs Use normal subtraction of numbers to calculate the Daily Reported Cases. The IMSUB function is for calculating with imaginary numbers, and it returns a Text, not a real number. That's why you see no columns for the daily values in your chart.
Have a look at the attached workbook with a working example of what you probably want to achieve.