Forum Discussion
maggiegrigs
May 21, 2020Copper Contributor
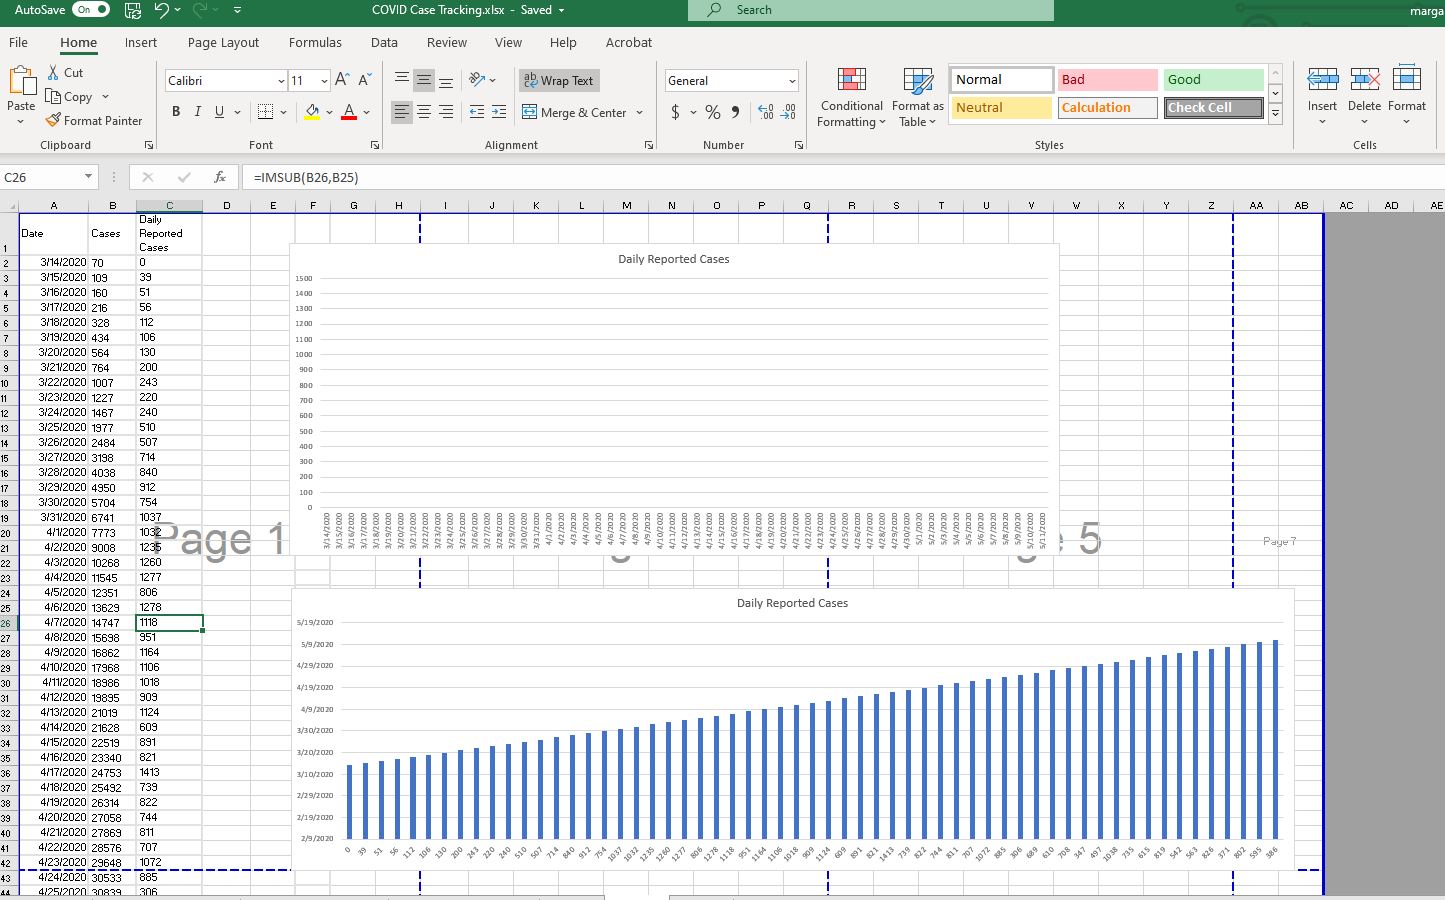
Chart values all appear in title, nothing on actual chart
ADDITION (original post below): I used the =SERIES function to get a chart with the X and Y axis with the correct numbers, but I can't get any bars to show up. See "NEW" attached image. ORIGINAL:...
Riny_van_Eekelen
May 21, 2020Platinum Contributor
maggiegrigs Use normal subtraction of numbers to calculate the Daily Reported Cases. The IMSUB function is for calculating with imaginary numbers, and it returns a Text, not a real number. That's why you see no columns for the daily values in your chart.
Have a look at the attached workbook with a working example of what you probably want to achieve.