linux
142 Topics
Finding the Elusive MDE PUA Audit Events on Linux
Potentially Unwanted Applications, or PUA, they aren't necessarily malware, but they are applications you probably don't want running across your environment either. Microsoft defines potentially unwanted applications as software that can adversely affect endpoint performance or use. Examples include advertising software, software bundlers, and applications that use behaviors intended to evade security products. Microsoft Defender can also consider an application's reputation when determining whether software qualifies as potentially unwanted. That sounds straightforward. On Windows, it generally is. On Linux, finding the resulting audit events requires knowing exactly where to look. And that is where things get interesting. PUA, PUP… Same Neighborhood, Slightly Different Address Before going further, it is worth clearing up some terminology. Across the security industry, you will commonly encounter both PUP, or Potentially Unwanted Program, and PUA, or Potentially Unwanted Application. The terms are frequently used for software that isn't necessarily malicious but has characteristics that make its presence undesirable, such as intrusive advertising, bundling additional software, or other behavior the user might not have knowingly requested. Microsoft uses Potentially Unwanted Application (PUA) as its product and detection terminology. Microsoft specifically distinguishes PUA from malware. A PUA might cause poor system performance, display unexpected advertisements, install other software, or have a poor reputation because of undesirable behavior, but those characteristics don't automatically make the application malware. Microsoft's classification criteria include examples such as: Advertising software that displays advertisements or promotions, including injecting advertisements into webpages. Bundling software that offers to install additional software that isn't digitally signed by the same entity, or that itself qualifies as PUA. Evasion software that actively attempts to avoid detection by security products or behaves differently when security software is present. Applications that have developed a poor reputation based on undesirable behavior. Microsoft's broader software-classification model also distinguishes between unknown software, malware, unwanted software, and other classifications. Software can therefore be legitimate and functional while still meeting Microsoft's criteria for classification as potentially unwanted. For the rest of this article, we'll use PUA, because that is the terminology used by Microsoft Defender and, more importantly for our investigation, the Linux product logs identify these detections explicitly as: potentially_unwanted_application That string is going to become very useful once we start looking for the supposedly elusive audit events. PUA Audit and Block on Windows On Windows, PUA protection is part of Microsoft Defender Antivirus. Administrators can configure Defender to identify applications that Microsoft considers potentially unwanted and determine how those applications should be handled. Microsoft documents PUA protection and provides the AMTSO Potentially Unwanted Application test file (Feature Settings Check - Potentially Unwanted Applications - AMTSO) as its standard demonstration scenario. Microsoft's demonstration documentation identifies Windows, Windows Server, macOS, and Linux among the supported operating systems for the PUA demonstration. The two operating modes we're interested in are conceptually simple: Audit Defender identifies the PUA but doesn't block it. This is useful when you want to understand the potential impact of enabling PUA protection before enforcing it. Block Defender identifies the PUA and takes the configured protection action. On Windows, for a device onboarded to Microsoft Defender for Endpoint – that telemetry and audit information is available in the XDR Security portal. You can find PUA detections in the Additional Fields of the AntivirusDetection action type in the DeviceEvents table – and an alert will fire when in PUA is in block mode: DeviceEvents | where ActionType == "AntivirusDetection" | extend x = parse_json(AdditionalFields) | project Timestamp, DeviceName, FolderPath, FileName, SHA256, ThreatName = tostring(x.ThreatName), WasExecutingWhileDetected = tostring(x.WasExecutingWhileDetected), WasRemediated = tostring(x.WasRemediated) | where ThreatName startswith_cs 'PUA:' Microsoft Defender Antivirus events can be investigated through: Applications and Services Logs > Microsoft > Windows > Windows Defender > Operational Defender detection events can provide information such as the threat name, threat ID, category, path, detection origin, detection type, and detection source. That makes auditing and troubleshooting reasonably familiar territory for Windows administrators. The experience on Linux, however, is different. PUA Protection on Linux Microsoft Defender for Endpoint on Linux also supports PUA protection. Microsoft documents three PUA actions: Off: PUA protection is disabled. Audit: PUA files are reported in the product logs, but no remediation is performed. Block: PUA files are reported and action is taken against them. The distinction between Audit and Block is particularly important. In PUA Audit mode: PUA files are reported in the product logs. They aren't reported in the Defender portal through this PUA mechanism. No infection record is stored in threat history. No action is taken against the file. In Block mode: The detection is reported in the product logs. It is reported in the Defender portal. A record is stored in threat history. Defender takes action on the PUA. PUA behavior can be configured locally with mdatp. To configure Audit: sudo mdatp threat policy set --type potentially_unwanted_application --action audit To configure Block: sudo mdatp threat policy set --type potentially_unwanted_application --action block There is one important distinction worth calling out here: PUA Audit mode isn't the same thing as the broader Microsoft Defender for Endpoint Antivirus Passive Mode on Linux. PUA Audit is specifically the handling policy for applications that are detected and classified as potentially unwanted. For this article, we're testing and focusing on PUA Audit. A Windows PUA on Linux? Yes. Here's where the test gets more interesting. The AMTSO PUA test artifact is a Windows executable. At first glance, that doesn't seem particularly useful when we're trying to validate PUA protection on Linux. After all, we're testing on Linux. But Defender's file inspection isn't limited to applications that can execute natively on the operating system. A Windows PE file sitting on a Linux filesystem can still be inspected and classified. And we can demonstrate that directly. Microsoft's PUA demonstration directs administrators to the AMTSO Potentially Unwanted Application test file, and Microsoft's current demonstration documentation includes Linux among the supported operating systems. On our Linux test machine, we downloaded: PotentiallyUnwanted.exe The important point is that we don't need to execute the Windows executable on Linux. In our testing, simply causing filesystem activity against the file was sufficient to make Defender inspect it. The file initially resided in: /home/ritter/Downloads/PotentiallyUnwanted.exe We then used the Linux graphical file manager to move it into: /home/ritter/Music/PotentiallyUnwanted.exe That was enough to generate another PUA Audit observation. The Defender record showed: "scan_reason":"move" And, more importantly, Defender classified the file as: "name":"PUA:Win32/EICAR_Test_File" with: "type":"potentially_unwanted_application" and: "status":"infected" The event also recorded information about the process responsible for the filesystem operation. In our test, moving the file graphically resulted in the process being recorded as: /usr/bin/nautilus So although the test artifact is a Windows executable, MDE running on Linux still inspected and classified it as PUA:Win32/EICAR_Test_File. That's exactly what we needed. So Where Is the Audit Event? This is the elusive part. If you immediately start looking in the Defender portal or expect PUA Audit to behave like PUA Block, you're likely to come away wondering whether anything happened. Microsoft's Linux documentation tells us that Audit-mode PUA files are reported in the product logs and that no infection record is stored in threat history. Fair enough. But that naturally leads to another question: Which product log? Instead of guessing, we asked Linux. A recursive grep across the MDE log directory provides a simple way to find anything containing the PUA classification string: sudo grep -RniH 'potentially_unwanted' /var/log/microsoft/mdatp/ Where: R searches recursively. n displays the matching line number. i makes the search case-insensitive. H forces grep to display the filename. And there it was. On our test system, the PUA Audit records were located in: /var/log/microsoft/mdatp/microsoft_defender_core_err.log If you only want to determine which log files contain PUA records: sudo grep -Rli 'potentially_unwanted' /var/log/microsoft/mdatp/ Once you've identified the log, you can search it directly: sudo grep -ni 'potentially_unwanted' /var/log/microsoft/mdatp/microsoft_defender_core_err.log Or include surrounding lines for additional context: sudo grep -ni -B5 -A10 'potentially_unwanted' /var/log/microsoft/mdatp/microsoft_defender_core_err.log Our test produced records containing information similar to: [Audit]: Source: { "$type":"real_time", "scan_reason":"move", "process":{ "path":"/usr/bin/nautilus" } }, File: /home/ritter/Music/PotentiallyUnwanted.exe, Threat: { "name":"PUA:Win32/EICAR_Test_File", "type":"potentially_unwanted_application", "status":"infected" } And there it is. The PUA audit event exists. You just have to go spelunking through the local Defender product logs to find it. The Microsoft documentation is technically correct: PUA Audit detections are written to the product logs. Knowing what string to search for and which log actually contained the events on our test system makes that guidance considerably more actionable. That's Fine for One Server. What About 1,000? Running grep on a test machine is easy. Running grep individually across hundreds or thousands of Linux servers obviously isn't the operational model we want. Once we know where the information resides, however, the problem changes from a Defender problem into a log collection problem. And that's a much easier problem to solve. One option is Azure Monitor Agent (AMA). AMA supports collecting custom text logs from Linux systems through an Azure Monitor Data Collection Rule (DCR) and sending those records to a Log Analytics workspace. Conceptually: A DCR can be configured to collect the Defender text log identified during testing. Azure Monitor supports Linux custom-text-log file patterns and wildcards for appropriate log-file collection scenarios. Azure Monitor Custom Text Logs also supports ingestion-time transformations, allowing records to be filtered or formatted before they're written to the destination table. That creates an interesting opportunity. Rather than collecting every line from a verbose Defender diagnostic log, a collection strategy could focus on the records containing: potentially_unwanted_application Once centralized in Log Analytics, those records become queryable with KQL. For example, if the records were ingested into a custom table called MDEPUAAudit_CL, an initial investigation could start with: MDEPUAAudit_CL | where RawData contains "potentially_unwanted" From there, the raw records could be parsed for useful reporting fields including: Host Timestamp File path Detection name PUA classification Scan reason Initiating process First occurrence Last occurrence Number of observations Turning Audit Mode into a Deployment Tool This is ultimately where the exercise becomes useful. PUA Audit doesn't have to be merely a configuration checkbox. It can become a pre-enforcement assessment mechanism. The workflow looks something like this: Instead of asking: "What happens if we turn PUA Block on?" we can start answering a much better question: "What has Defender already identified as PUA while we've been running in Audit?" And now we know where the answer is hiding. Reference Live link Detect and block potentially unwanted applications with Microsoft Defender for Endpoint on Linux https://learn.microsoft.com/en-us/defender-endpoint/linux-pua Detect and block potentially unwanted applications with Microsoft Defender Antivirus https://learn.microsoft.com/en-us/defender-endpoint/detect-block-potentially-unwanted-apps-microsoft-defender-antivirus How Microsoft identifies malware and potentially unwanted applications https://learn.microsoft.com/en-us/unified-secops/criteria Potentially unwanted applications (PUA) demonstration https://learn.microsoft.com/en-us/defender-endpoint/defender-endpoint-demonstration-potentially-unwanted-applications AMTSO Feature Settings Check: Potentially Unwanted Applications https://www.amtso.org/feature-settings-check-potentially-unwanted-applications/ Microsoft Defender Antivirus event IDs and error codes https://learn.microsoft.com/en-us/defender-endpoint/troubleshoot-microsoft-defender-antivirus Microsoft Defender for Endpoint on Linux resources https://learn.microsoft.com/en-us/defender-endpoint/linux-resources Collect text file from virtual machine with Azure Monitor https://learn.microsoft.com/en-us/azure/azure-monitor/vm/data-collection-log-text Collect logs from text files with Azure Monitor Agent and ingest to Microsoft Sentinel https://learn.microsoft.com/en-us/azure/sentinel/connect-custom-logs-ama Collect guest log data from virtual machines with Azure Monitor https://learn.microsoft.com/en-us/azure/azure-monitor/vm/data-collection DeviceEvents table in the Advanced Hunting schema https://learn.microsoft.com/en-us/defender-xdr/advanced-hunting-deviceevents-table Microsoft Defender XDR Advanced Hunting schema tables https://learn.microsoft.com/en-us/defender-xdr/advanced-hunting-schema-tables
Solution for PWAs not appearing as separate apps on Linux taskbars
Hi everyone, I recently Installed Microsoft Edge stable on Kubuntu Linux, and I ran into some problems using Progressive Web Applications (PWAs). Launch one Edge PWA (say, Microsoft Teams). It appears normally. Launch a second PWA (say, Microsoft Outlook). Both windows — and every PWA you launch afterward — collapse into a single taskbar group under the first PWA’s icon, identified as msedge. Pinned PWA launchers never show as running. Pinning a running PWA window produces a generic page icon that launches the bare Edge browser when clicked. Launching a PWA from the application menu briefly shows the launcher’s startup placeholder in the taskbar, which then disappears and is replaced by a separate, unassociated entry. This isn’t KDE-specific. GNOME users have also reported issues. After some troubleshooting with Claude, the issues were traced to a mismatch between how the PWAs are identified in the .desktop PWA launchers created by Edge and the app ids reported to Wayland, starting in September 2025, when Wayland was used by default. Identifier Value Example (Microsoft Outlook) Window app_id (native Wayland) msedge-_<appid>-Default msedge-_lkkahpbimdkjdjjiijflmhaeameegbcm-Default Desktop entry filename msedge-<appid>-Default msedge-lkkahpbimdkjdjjiijflmhaeameegbcm-Default StartupWMClass= in that file crx__<appid> crx__lkkahpbimdkjdjjiijflmhaeameegbcm So the solution is StartupWMClass in the .desktop launcher for the PWA to the Wayland app_id. I have a simple Bash script that will do this for all currently installed PWAs as a workaround, but the automod removed that post the last time I tried to post it. The suggested fix for Microsoft This should be a small change to Edge’s desktop-entry generation on Linux: write the Wayland app_id (msedge-_<appid>-<profile>) into StartupWMClass=, or better, make the window app_id match the desktop entry basename per the freedesktop convention. No compositor-side changes are needed — the verified workaround above demonstrates that. I’ve reported this through Edge’s in-browser feedback tool (Alt+Shift+I) with the full diagnosis. If you’re affected, sending your own feedback referencing the same details is the best way to get it prioritized — the in-browser channel is what reaches the Edge team’s triage.663Views3likes1CommentUnderstanding Hash Join Memory Usage and OOM Risks in PostgreSQL
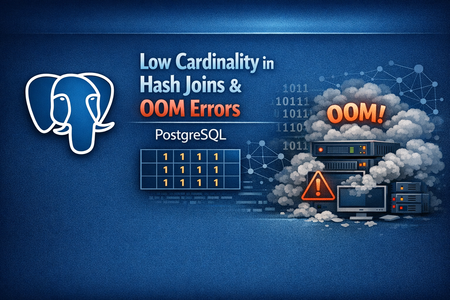
Background: Why Memory Usage May Exceed work_mem work_mem is commonly assumed to be a hard upper bound on per‑query memory usage. However, for Hash Join operations, memory consumption depends not only on this parameter but also on: ✅ Data cardinality ✅ Hash table internal bucket distribution ✅ Join column characteristics ✅ Number of batches created ✅ Parallel workers involved Under low‑cardinality conditions, a Hash Join may place an extremely large number of rows into very few buckets—sometimes a single bucket. This causes unexpectedly large memory allocations that exceed the nominal work_mem limit. Background: What work_mem really means for Hash Joins work_mem controls the amount of memory available per operation (e.g., a sort or a hash) per node (and per parallel worker) before spilling to disk. Hash operations can additionally use hash_mem_multiplier×work_mem for their hash tables. [postgresql.org], [postgresqlco.nf] The Hash Join algorithm builds a hash table for the “build/inner” side and probes it with the “outer” side. The table is split into buckets; if it doesn’t fit in memory, PostgreSQL partitions work into batches (spilling to temporary files). Skewed distributions (e.g., very few distinct join keys) pack many rows into the same bucket(s), exploding memory usage even when work_mem is small. [postgrespro.com], [interdb.jp] In EXPLAIN (ANALYZE) you’ll see Buckets:, Batches:, and Memory Usage: on the Hash node; Batches > 1 indicates spilling/partitioning. [postgresql.org], [thoughtbot.com] The default for hash_mem_multiplier is version‑dependent (introduced in PG13; 1.0 in early versions, later 2.0). Tune with care; it scales the memory that hash operations may consume relative to work_mem. [pgpedia.info] A safe, reproducible demo (containerized community PostgreSQL) The goal is to show that data distribution alone can drive order(s) of magnitude difference in hash table memory, using conservative settings. In order to simulate the behavior we´ll use pg_hint_plan extension to guide the execution plans and create some data distribution that may not have a good application logic, just to force and show the behavior. Start PostgreSQL 16 container docker run --name=postgresql16.8 -p 5414:5432 -e POSTGRES_PASSWORD=<password> -d postgres:16.8 docker exec -it postgresql16.8 /bin/bash -c "apt-get update -y;apt-get install procps -y;apt-get install postgresql-16-pg-hint-plan -y;apt-get install vim -y;apt-get install htop -y" docker exec -it postgresql16.8 /bin/bash vi /var/lib/postgresql/data/postgresql.conf -- Adding pg_hint_plan to shared_preload_libraries psql -h localhost -U postgres create extension pg_hint_plan; docker stop postgresql16.8 docker start postgresql16.8 To connect to our docker container we use: psql -h localhost -p 5414 -U postgres Connect and apply conservative session-level settings We’ll discourage other join methods so the planner prefers Hash Join—without needing any extension. set hash_mem_multiplier=1; set max_parallel_workers=0; set max_parallel_workers_per_gather=0; set enable_parallel_hash=off; set enable_material=off; set enable_sort=off; set pg_hint_plan.debug_print=verbose; set client_min_messages=notice; set pg_hint_plan.enable_hint_table=on; Create tables and load data We´ll create two tables for the join, table_1, with a single row, table_h initially with 10mill rows drop table table_s; create table table_s (column_a text); insert into table_s values ('30020'); vacuum full table_s; drop table table_h; create table table_h(column_a text,column_b text); INSERT INTO table_h(column_a,column_b) SELECT i::text, i::text FROM generate_series(1, 10000000) AS t(i); vacuum full table_h; Run Hash Join (high cardinality) We´ll run the join using column_a in both tables, that was created previously having high cardinality in table_h explain (analyze,buffers,costs,verbose) SELECT /*+ HashJoin(s h) Leading((s h)) */ COUNT(*) FROM table_s s JOIN table_h h ON s.column_a= h.column_a; You should see a Hash node with small Memory Usage (a few MB) and Batches: 256 or similar due to our tiny work_mem, but no ballooning. Exact numbers vary by hardware/version/stats. (EXPLAIN fields and interpretation are documented here.) [postgresql.org] QUERY PLAN -------------------------------------------------------------------------------------------------------------------------------------------------- Aggregate (cost=280930.01..280930.02 rows=1 width=8) (actual time=1902.965..1902.968 rows=1 loops=1) Output: count(*) Buffers: shared read=54055, temp read=135 written=34041 -> Hash Join (cost=279054.00..280805.01 rows=50000 width=0) (actual time=1900.539..1902.949 rows=1 loops=1) Hash Cond: (s.column_a = h.column_a) Buffers: shared read=54055, temp read=135 written=34041 -> Seq Scan on public.table_s s (cost=0.00..1.01 rows=1 width=32) (actual time=0.021..0.022 rows=1 loops=1) Output: s.column_a Buffers: shared read=1 -> Hash (cost=154054.00..154054.00 rows=10000000 width=32) (actual time=1896.895..1896.896 rows=10000000 loops=1) Output: h.column_a Buckets: 65536 Batches: 256 Memory Usage: 2031kB Buffers: shared read=54054, temp written=33785 -> Seq Scan on public.table_h h (cost=0.00..154054.00 rows=10000000 width=32) (actual time=2.538..638.830 rows=10000000 loops=1) Output: h.column_a Buffers: shared read=54054 Query Identifier: 334721522907995613 Planning: Buffers: shared hit=10 Planning Time: 0.302 ms JIT: Functions: 11 Options: Inlining false, Optimization false, Expressions true, Deforming true Timing: Generation 0.441 ms, Inlining 0.000 ms, Optimization 0.236 ms, Emission 2.339 ms, Total 3.017 ms Execution Time: 1903.472 ms (25 rows) Findings (1) When we have the data totally distributed with high cardinality it takes only 2031kB of memory usage (work_mem), shared hit/read=54055 Force low cardinality / skew and re‑run We´ll update table_h to have column_a all values to '30020', so, having only 1 distinct value for all the rows in the table update table_h set column_a='30020', column_b='30020'; vacuum full table_h; Checking execution plan: QUERY PLAN ------------------------------------------------------------------------------------------------------------------------------------------------- Aggregate (cost=279056.04..279056.05 rows=1 width=8) (actual time=3568.936..3568.938 rows=1 loops=1) Output: count(*) Buffers: shared read=54056, temp read=63480 written=63480 -> Hash Join (cost=279055.00..279056.03 rows=1 width=0) (actual time=2650.696..3228.610 rows=10000000 loops=1) Hash Cond: (s.column_a = h.column_a) Buffers: shared read=54056, temp read=63480 written=63480 -> Seq Scan on public.table_s s (cost=0.00..1.01 rows=1 width=32) (actual time=0.007..0.008 rows=1 loops=1) Output: s.column_a Buffers: shared read=1 -> Hash (cost=154055.00..154055.00 rows=10000000 width=7) (actual time=1563.987..1563.989 rows=10000000 loops=1) Output: h.column_a Buckets: 131072 (originally 131072) Batches: 512 (originally 256) Memory Usage: 371094kB Buffers: shared read=54055, temp written=31738 -> Seq Scan on public.table_h h (cost=0.00..154055.00 rows=10000000 width=7) (actual time=2.458..606.422 rows=10000000 loops=1) Output: h.column_a Buffers: shared read=54055 Query Identifier: 334721522907995613 Planning: Buffers: shared hit=6 read=1 dirtied=1 Planning Time: 0.237 ms JIT: Functions: 11 Options: Inlining false, Optimization false, Expressions true, Deforming true Timing: Generation 0.330 ms, Inlining 0.000 ms, Optimization 0.203 ms, Emission 2.311 ms, Total 2.844 ms Execution Time: 3584.439 ms (25 rows) Now, the Hash node typically reports hundreds of MB of Memory Usage, with more/larger temp spills (higher Batches, more temp_blks_*). What changed? Only the distribution (cardinality). (Why buckets/batches behave this way is covered in the algorithm references.) [postgrespro.com], [interdb.jp] Findings (2) When we have the data distributed with LOW cardinality it takes 371094kB of memory usage (work_mem), shared hit/read=54056 So, same amount of data being handled by the query in terms of shared memory, but totally different work_mem usage pattern due to the low cardinality and the join method (Hash Join) that put most of those rows in a single bucket and that is not limited by default, so, it can cause OOM errors at any time. Scale up rows to observe linear growth We´ll add same rows in table_h repeat times so we can play with more data (low cardinality) insert into table_h select * from table_h; vacuum full table_h; You’ll see Memory Usage and temp I/O scale with rowcount under skew. (Beware: this can become I/O and RAM heavy—do this incrementally.) [thoughtbot.com] NumRows table_h Shared read/hit Dirtied Written Temp read/written Memory Usage (work_mem) 10M 54056 0 63480+63480 371094kB 20M 108110 0 126956+126956 742188kB 80M 432434 (1,64GB) 0 0 253908+253908 2968750kB (2,8GB) Observability: what you will (and won’t) see EXPLAIN is your friend EXPLAIN (ANALYZE, BUFFERS) exposes Memory Usage, Buckets:, Batches: in the Hash node and temp block I/O. Batches > 1 is a near‑certain sign of spilling. [postgresql.org], [thoughtbot.com] Query Store / pg_stat_statements limitations Azure Database for PostgreSQL – Flexible Server Query Store aggregates runtime and (optionally) wait stats over time windows and stores them in azure_sys, with views under query_store.*. It’s fantastic to find which queries chew CPU/I/O or wait, but it doesn’t report per‑query transient memory usage (e.g., “how many MB did that hash table peak at?”) you can estimate reviewing the temporary blocks. [learn.microsoft.com] Under the hood, what you do get—whether via Query Store or vanilla PostgreSQL pg_stat_statements—are cumulative counters like shared_blks_read, shared_blks_hit, temp_blks_read, temp_blks_written, timings, etc. Those help confirm buffer/temp activity, yet no direct hash table memory metric exists. Combine them with EXPLAIN and server metrics to triangulate. [postgresql.org] Tip (Azure Flexible Server) Enable Query Store in Server parameters via pg_qs.query_capture_mode and (optionally) wait sampling via pgms_wait_sampling.query_capture_mode, then use query_store.qs_view to correlate temp block usage and execution times across intervals. [learn.microsoft.com] Typical OOM symptom in logs In extreme skew with concurrent executions, you may encounter: ERROR: out of memory DETAIL: Failed on request of size 32800 in memory context "HashBatchContext". This is a classic signature of hash join memory pressure. [postgresql.org], [thisistheway.wiki] What to do about it (mitigations & best practices) Don’t force Hash Join unless required If you used planner hints (e.g., pg_hint_plan) or GUCs (Grand Unified Configuration) to force Hash Join, remove them and let the planner re‑evaluate. (If you must hint, be aware pg_hint_plan is a third‑party extension and not available in all environments.) [pg-hint-pl...thedocs.io], [pg-hint-pl...thedocs.io] Fix skew / cardinality at the source Re‑model data to avoid low‑NDV (Number of Distinct Values in a column) joins (e.g., pre‑aggregate, filter earlier, or exclude degenerate keys). Ensure statistics are current so the planner estimates are realistic. (Skew awareness is limited; poor estimates → risky sizing.) [postgresql.org] Pick a safer join strategy when appropriate If distribution is highly skewed, Merge Join (with supporting indexes/sort order) or Nested Loop (for selective probes) might be more memory‑predictable. Let the planner choose, or enable alternatives by undoing GUCs that disabled them. [postgresql.org] Bound memory consciously Keep work_mem modest for mixed/OLTP workloads; remember it’s per operation, per node, per worker. Adjust hash_mem_multiplier judiciously (introduced in PG13; default now commonly 2.0) if you understand the spill trade‑offs. [postgresqlco.nf], [pgpedia.info] Observe spills and tune iteratively Use EXPLAIN (ANALYZE, BUFFERS) to see Batches (spills) and Memory Usage; use Query Store/pg_stat_statements to find which queries generate the most temp I/O. Raise work_mem for a session only when justified. [postgresql.org], [postgresql.org] Parallelism awareness Each worker can perform its own memory‑using operations; parallel hash join has distinct behavior. If you aren’t sure, temporarily disable parallelism to simplify analysis, then re‑enable once you understand the footprint. [postgresql.org] Validating on Azure Database for PostgreSQL – Flexible Server The behavior is not Azure‑specific, but you can reproduce the same sequence on Flexible Server (e.g., General Purpose). A few notes: Confirm/adjust work_mem, hash_mem_multiplier, enable_* planner toggles as session settings. (Azure exposes standard PostgreSQL parameters.) [learn.microsoft.com] Use Query Store to confirm stable shared/temporary block patterns across executions, then use EXPLAIN (ANALYZE, BUFFERS) per query to spot hash table memory footprints. [learn.microsoft.com], [postgresql.org] Changing some default parameters We´ll repeat previous steps in Azure Database for PostgreSQL Flexible server: set hash_mem_multiplier=1; set max_parallel_workers=0; set max_parallel_workers_per_gather=0; set enable_parallel_hash=off; set enable_material=off; set enable_sort=off; set pg_hint_plan.debug_print=verbose; set client_min_messages=notice; set pg_hint_plan.enable_hint_table=on; Creating and populating tables drop table table_s; create table table_s (column_a text); insert into table_s values ('30020'); vacuum full table_s; drop table table_h; create table table_h(column_a text,column_b text); INSERT INTO table_h(column_a,column_b) SELECT i::text, i::text FROM generate_series(1, 10000000) AS t(i); vacuum full table_h; vacuum full table_s; Query & Execution plan explain (analyze,buffers,costs,verbose) SELECT /*+ HashJoin(s h) Leading((s h)) */ COUNT(*) FROM table_s s JOIN table_h h ON s.column_a= h.column_a; QUERY PLAN ------------------------------------------------------------------------------------------------------------------------------------------------- Aggregate (cost=279052.88..279052.89 rows=1 width=8) (actual time=3171.186..3171.191 rows=1 loops=1) Output: count(*) Buffers: shared hit=33 read=54023, temp read=135 written=34042 I/O Timings: shared read=184.869, temp read=0.278 write=333.970 -> Hash Join (cost=279051.84..279052.88 rows=1 width=0) (actual time=3147.288..3171.182 rows=1 loops=1) Hash Cond: (s.column_a = h.column_a) Buffers: shared hit=33 read=54023, temp read=135 written=34042 I/O Timings: shared read=184.869, temp read=0.278 write=333.970 -> Seq Scan on public.table_s s (cost=0.00..1.01 rows=1 width=32) (actual time=0.315..0.316 rows=1 loops=1) Output: s.column_a Buffers: shared read=1 I/O Timings: shared read=0.018 -> Hash (cost=154053.04..154053.04 rows=9999904 width=7) (actual time=3109.278..3109.279 rows=10000000 loops=1) Output: h.column_a Buckets: 131072 Batches: 256 Memory Usage: 2551kB Buffers: shared hit=32 read=54022, temp written=33786 I/O Timings: shared read=184.851, temp write=332.059 -> Seq Scan on public.table_h h (cost=0.00..154053.04 rows=9999904 width=7) (actual time=0.019..1258.472 rows=10000000 loops=1) Output: h.column_a Buffers: shared hit=32 read=54022 I/O Timings: shared read=184.851 Query Identifier: 5636209387670245929 Planning: Buffers: shared hit=37 Planning Time: 0.575 ms Execution Time: 3171.375 ms (26 rows) Findings (3) In Azure Database for PostgreSQL Flexible server, when we have the data totally distributed with high cardinality it takes only 2551kB of memory usage (work_mem), shared hit/read=54056 Skew it to LOW cardinality As we did previously, we change column_a to having only one different value in all rows in table_h update table_h set column_a='30020', column_b='30020'; vacuum full table_h; In this case we force the join method with pg_hint_plan: explain (analyze,buffers,costs,verbose) SELECT /*+ HashJoin(s h) Leading((s h)) */ COUNT(*) FROM table_s s JOIN table_h h ON s.column_a= h.column_a; QUERY PLAN ------------------------------------------------------------------------------------------------------------------------------------------------- Aggregate (cost=279056.04..279056.05 rows=1 width=8) (actual time=4397.556..4397.560 rows=1 loops=1) Output: count(*) Buffers: shared hit=2 read=54055, temp read=63480 written=63480 I/O Timings: shared read=89.396, temp read=90.377 write=300.290 -> Hash Join (cost=279055.00..279056.03 rows=1 width=0) (actual time=3271.145..3987.154 rows=10000000 loops=1) Hash Cond: (s.column_a = h.column_a) Buffers: shared hit=2 read=54055, temp read=63480 written=63480 I/O Timings: shared read=89.396, temp read=90.377 write=300.290 -> Seq Scan on public.table_s s (cost=0.00..1.01 rows=1 width=32) (actual time=0.006..0.008 rows=1 loops=1) Output: s.column_a Buffers: shared hit=1 -> Hash (cost=154055.00..154055.00 rows=10000000 width=7) (actual time=1958.729..1958.731 rows=10000000 loops=1) Output: h.column_a Buckets: 262144 (originally 262144) Batches: 256 (originally 128) Memory Usage: 371094kB Buffers: shared read=54055, temp written=31738 I/O Timings: shared read=89.396, temp write=149.076 -> Seq Scan on public.table_h h (cost=0.00..154055.00 rows=10000000 width=7) (actual time=0.159..789.449 rows=10000000 loops=1) Output: h.column_a Buffers: shared read=54055 I/O Timings: shared read=89.396 Query Identifier: 8893575855188549861 Planning: Buffers: shared hit=5 Planning Time: 0.157 ms Execution Time: 4414.268 ms (25 rows) NumRows table_h Shared read/hit Dirtied Written Temp read/written Memory Usage (work_mem) 10M 54056 0 63480+63480 371094kB 20M 108110 0 126956+126956 742188kB 80M 432434 0 0 253908+253908 2968750kB We observe the same numbers compared with our docker installation. See the extension docs for installation/usage and the hint table for cases where you want to force a specific join method. [pg-hint-pl...thedocs.io], [pg-hint-pl...thedocs.io] FAQ Q: I set work_mem = 4MB. Why did my Hash Join report ~371MB Memory Usage? A: Hash joins can use up to hash_mem_multiplier × work_mem per hash table, and skew can cause large per‑bucket chains. Multiple nodes/workers multiply usage. work_mem is not a global hard cap. [postgresqlco.nf], [pgpedia.info] Q: How do I know if a Hash Join spilled to disk? A: In EXPLAIN (ANALYZE), Hash node shows Batches: N. N > 1 indicates partitioning and temp I/O; you’ll also see temp_blks_read/written in buffers and Temp I/O timings. [postgresql.org], [thoughtbot.com] Q: Can Query Store tell me per‑query memory consumption? A: Not directly. It gives time‑sliced runtime and wait stats (plus temp/shared block counters via underlying stats), but no “peak MB used by this hash table” metric. Use EXPLAIN and server metrics. [learn.microsoft.com], [postgresql.org] Q: I hit “Failed on request … in HashBatchContext.” What’s that? A: That’s an OOM raised by the executor while allocating memory. Reduce skew, avoid forced hash joins, or review per‑query memory and concurrency. [postgresql.org] Further reading Server parameters & memory (official docs): guidance on work_mem, shared_buffers, parallelism. [postgresql.org] Hash joins under the hood: deep dives into buckets, batches, and memory footprints. [postgrespro.com], [pgcon.org] hash_mem_multiplier: history and defaults by version. [pgpedia.info] EXPLAIN primer: how to read Hash node details, Batches, Memory Usage. [postgresql.org], [thoughtbot.com] Query Store (Azure Flexible): enable, query, and interpret. [learn.microsoft.com] Ready‑to‑use mitigation checklist (DBA quick wins) Remove joins hints/GUC overrides that force Hash Join; re‑plan. [pg-hint-pl...thedocs.io] Refresh stats; confirm realistic rowcount/NDV estimates. [postgresql.org] Consider alternate join strategies (Merge/Index‑Nested‑Loop) when skew is high. [postgresql.org] Keep work_mem conservative for OLTP; consider session‑scoped bumps only for specific analytic queries. [postgresql.org] Tune hash_mem_multiplier carefully only after understanding spill patterns. [postgresqlco.nf] Use EXPLAIN (ANALYZE, BUFFERS) to verify Batches and Memory Usage. [postgresql.org] Use Query Store/pg_stat_statements to find heavy temp/shared I/O offenders over time.
RHEL10 or Ubuntu 26.04 LTS Support
Hi, Is there any time lines when Microsoft Intune client for Linux will be updated to support the latest versions of these operating systems? Is there a published timeline anywhere that says when new releases for Linux will be released? Thanks in advance.764Views4likes1CommentIntegrating Microsoft Foundry with OpenClaw: Step by Step Model Configuration
Step 1: Deploying Models on Microsoft Foundry Let us kick things off in the Azure portal. To get our OpenClaw agent thinking like a genius, we need to deploy our models in Microsoft Foundry. For this guide, we are going to focus on deploying gpt-5.2-codex on Microsoft Foundry with OpenClaw. Navigate to your AI Hub, head over to the model catalog, choose the model you wish to use with OpenClaw and hit deploy. Once your deployment is successful, head to the endpoints section. Important: Grab your Endpoint URL and your API Keys right now and save them in a secure note. We will need these exact values to connect OpenClaw in a few minutes. Step 2: Installing and Initializing OpenClaw Next up, we need to get OpenClaw running on your machine. Open up your terminal and run the official installation script: curl -fsSL https://openclaw.ai/install.sh | bash The wizard will walk you through a few prompts. Here is exactly how to answer them to link up with our Azure setup: First Page (Model Selection): Choose "Skip for now". Second Page (Provider): Select azure-openai-responses. Model Selection: Select gpt-5.2-codex , For now only the models listed (hosted on Microsoft Foundry) in the picture below are available to be used with OpenClaw. Follow the rest of the standard prompts to finish the initial setup. Step 3: Editing the OpenClaw Configuration File Now for the fun part. We need to manually configure OpenClaw to talk to Microsoft Foundry. Open your configuration file located at ~/.openclaw/openclaw.json in your favorite text editor. Replace the contents of the models and agents sections with the following code block: { "models": { "providers": { "azure-openai-responses": { "baseUrl": "https://<YOUR_RESOURCE_NAME>.openai.azure.com/openai/v1", "apiKey": "<YOUR_AZURE_OPENAI_API_KEY>", "api": "openai-responses", "authHeader": false, "headers": { "api-key": "<YOUR_AZURE_OPENAI_API_KEY>" }, "models": [ { "id": "gpt-5.2-codex", "name": "GPT-5.2-Codex (Azure)", "reasoning": true, "input": ["text", "image"], "cost": { "input": 0, "output": 0, "cacheRead": 0, "cacheWrite": 0 }, "contextWindow": 400000, "maxTokens": 16384, "compat": { "supportsStore": false } }, { "id": "gpt-5.2", "name": "GPT-5.2 (Azure)", "reasoning": false, "input": ["text", "image"], "cost": { "input": 0, "output": 0, "cacheRead": 0, "cacheWrite": 0 }, "contextWindow": 272000, "maxTokens": 16384, "compat": { "supportsStore": false } } ] } } }, "agents": { "defaults": { "model": { "primary": "azure-openai-responses/gpt-5.2-codex" }, "models": { "azure-openai-responses/gpt-5.2-codex": {} }, "workspace": "/home/<USERNAME>/.openclaw/workspace", "compaction": { "mode": "safeguard" }, "maxConcurrent": 4, "subagents": { "maxConcurrent": 8 } } } } You will notice a few placeholders in that JSON. Here is exactly what you need to swap out: Placeholder Variable What It Is Where to Find It <YOUR_RESOURCE_NAME> The unique name of your Azure OpenAI resource. Found in your Azure Portal under the Azure OpenAI resource overview. <YOUR_AZURE_OPENAI_API_KEY> The secret key required to authenticate your requests. Found in Microsoft Foundry under your project endpoints or Azure Portal keys section. <USERNAME> Your local computer's user profile name. Open your terminal and type whoami to find this. Step 4: Restart the Gateway After saving the configuration file, you must restart the OpenClaw gateway for the new Foundry settings to take effect. Run this simple command: openclaw gateway restart Configuration Notes & Deep Dive If you are curious about why we configured the JSON that way, here is a quick breakdown of the technical details. Authentication Differences Azure OpenAI uses the api-key HTTP header for authentication. This is entirely different from the standard OpenAI Authorization: Bearer header. Our configuration file addresses this in two ways: Setting "authHeader": false completely disables the default Bearer header. Adding "headers": { "api-key": "<key>" } forces OpenClaw to send the API key via Azure's native header format. Important Note: Your API key must appear in both the apiKey field AND the headers.api-key field within the JSON for this to work correctly. The Base URL Azure OpenAI's v1-compatible endpoint follows this specific format: https://<your_resource_name>.openai.azure.com/openai/v1 The beautiful thing about this v1 endpoint is that it is largely compatible with the standard OpenAI API and does not require you to manually pass an api-version query parameter. Model Compatibility Settings "compat": { "supportsStore": false } disables the store parameter since Azure OpenAI does not currently support it. "reasoning": true enables the thinking mode for GPT-5.2-Codex. This supports low, medium, high, and xhigh levels. "reasoning": false is set for GPT-5.2 because it is a standard, non-reasoning model. Model Specifications & Cost Tracking If you want OpenClaw to accurately track your token usage costs, you can update the cost fields from 0 to the current Azure pricing. Here are the specs and costs for the models we just deployed: Model Specifications Model Context Window Max Output Tokens Image Input Reasoning gpt-5.2-codex 400,000 tokens 16,384 tokens Yes Yes gpt-5.2 272,000 tokens 16,384 tokens Yes No Current Cost (Adjust in JSON) Model Input (per 1M tokens) Output (per 1M tokens) Cached Input (per 1M tokens) gpt-5.2-codex $1.75 $14.00 $0.175 gpt-5.2 $2.00 $8.00 $0.50 Conclusion: And there you have it! You have successfully bridged the gap between the enterprise-grade infrastructure of Microsoft Foundry and the local autonomy of OpenClaw. By following these steps, you are not just running a chatbot; you are running a sophisticated agent capable of reasoning, coding, and executing tasks with the full power of GPT-5.2-codex behind it. The combination of Azure's reliability and OpenClaw's flexibility opens up a world of possibilities. Whether you are building an automated devops assistant, a research agent, or just exploring the bleeding edge of AI, you now have a robust foundation to build upon. Now it is time to let your agent loose on some real tasks. Go forth, experiment with different system prompts, and see what you can build. If you run into any interesting edge cases or come up with a unique configuration, let me know in the comments below. Happy coding!12KViews2likes2Comments
Legal question on Bing Wallpapers
Is it legal to use Bing Wallpaper on Linux, using tools available there, like Gnome plugin "Bing Wallpaper" and such? Would it be legal for Ubuntu to add it directly in the distro (not images, those are obviously copyrighted by Getty et al, just the tool that downloads it daily) ? I tried to figure this from terms of use, but it is really hard to understand what is actually allowed.472Views1like2Comments
Edge 144 Creates Multiple GNOME Menu Icons
Starting in Edge 144, there are now 2 icons displaying in the GNOME applications menu. com.microsoft.Edge.desktop microsoft-edge.desktop Both of these files are installed as part of the RPM; the first has "NoDisplay=true" at the bottom, but that doesn't seem to work as intended. I think this value needs to be in the first section, under "[Desktop Entry]", in order for it to work properly.Solved257Views1like2CommentsPostgreSQL: Migrating Large Objects (LOBs) with Parallelism and PIPES
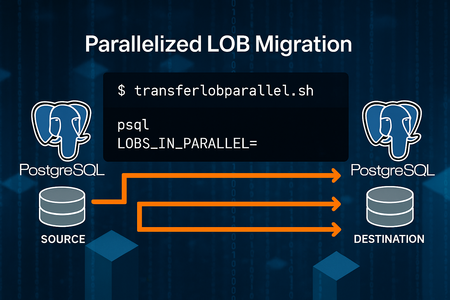
Why This Approach? Migrating large objects (LOBs) between PostgreSQL servers can be challenging due to size, performance, and complexity. Traditional methods often involve exporting to files and re-importing, which adds overhead and slows down the process. Also, there could be some Cloud restrictions that limit the usage of other tools like: Pgcopydb: Welcome to pgcopydb’s documentation! — pgcopydb 0.17~dev documentation Or other techniques like using RLS: SoporteDBA: PostgreSQL pg_dump filtering data by using Row Level Security (RLS) This solution introduces a parallelized migration script that: Reads directly from pg_largeobject. Splits work across multiple processes using the MOD() function on loid. Streams data via PIPES—no intermediate files. Scales easily by adjusting parallel degree. *Possible feature*: Commit size logic to supports resume logic by excluding already migrated LOBs. Key Benefits Direct streaming: No temporary files, reducing disk I/O. Parallel execution: Faster migration by leveraging multiple processes. Simple setup: Just two helper scripts for source and destination connections. Reference Scripts reference: Moving data with PostgreSQL COPY and \COPY commands | Microsoft Community Hub Source Connection -- pgsource.sh -- To connect to source database -- PLEASE REVIEW CAREFULLY THE CONNECTION STRINGS TO CONNECT TO SOURCE SERVER PGPASSWORD=<password> psql -t -h <sourceservername>.postgres.database.azure.com -U <username> <database> -- Permissions to execute chmod +x pgsource.sh Destination Connection -- pgdestination.sh -- To connect to target database -- PLEASE REVIEW CAREFULLY THE CONNECTION STRINGS TO CONNECT TO DESTINATION SERVER PGPASSWORD=<password> psql -t -h <destinationservername>.postgres.database.azure.com -U <username> <database> -- Permissions to execute chmod +x pgdestination.sh Parallel Migration Script -- transferlobparallel.sh -- To perform the parallel migrations of lobs echo > nohup.out echo 'ParallelDegree: '$1 'DateTime: '`date +"%Y%m%d%H%M%S"` # Check if no large objects to migrate count=$(echo "select count(1) from pg_largeobject;"|./pgsource.sh) count=$(echo "$count" | xargs) if [ "$count" -eq 0 ]; then echo "There are no large objects to migrate. Stopping the script." exit 0 fi par=$1 for i in $(seq 1 $1); do nohup /bin/bash <<EOF & echo "\copy (select data from (select 0 as rowsort, 'begin;' as data union select 1, concat('SELECT pg_catalog.lo_create(', lo.loid, ');SELECT pg_catalog.lo_open(', lo.loid, ', 131072);SELECT pg_catalog.lowrite(0,''', string_agg(lo.data, '' ORDER BY pageno), ''');SELECT pg_catalog.lo_close(0);') from pg_largeobject lo where mod(lo.loid::BIGINT,$par)=$i-1 group by lo.loid union select 2, 'commit;') order by rowsort) to STDOUT;"|./pgsource.sh|sed 's/\\\\\\\/\\\\/g'|./pgdestination.sh; echo "Execution thread $i finished. DateTime: ";date +"%Y%m%d%H%M%S"; EOF done tail -f nohup.out|grep Execution -- Permissions to execute chmod +x transferlobparallel.sh -- NOTE Please pay attention during the script execution, it will never finish as last line is “tail -f nohup…”, you need to monitor if all the threads already finished or checking in a different session the “psql” processes are still working or not. How to Run ./transferlobparallel.sh <ParallelDegree> Example: ./transferlobparallel.sh 3 Runs 3 parallel processes to migrate LOBs directly to the destination server. Performance Results Please find basic metrics taking into consideration that client linux VM with accelerated networking was co-located in same region/AZ than source and target Azure Database for PostgreSQL Flexible servers, servers and linux client based in Standard 4CPU SKUs, no other special configurations. 16 threads: ~11 seconds for 500MB. CPU usage: ~15% at 16 threads. Estimated migration for 80GB: ~30 minutes Key Takeaways This approach dramatically reduces migration time and complexity. By combining PostgreSQL’s pg_largeobject with parallelism and streaming, without intermediate storage, and using only psql client command as required client software. Disclaimer The script is provided as it is. Please review carefully when running/testing, the script is just a starting point to show how to migrate large objects in a parallelized way without intermediate storage, but it can be also implemented/improved using other methods as mentioned.
[Wayland] PWAs no longer appear as separate app windows — all group under main Edge icon
Hi, Since around 2025-09-07 to 2025-09-10, I’ve noticed that on GNOME (Wayland) all installed PWAs (even across different profiles) now appear grouped under the main Edge browser icon in the GNOME Shell dash/taskbar. Previously, each PWA would open in its own window group with its own icon. This is still the behavior in Chromium/Brave/Chrome, and can be restored there by editing the PWA’s .desktop file to set: StartupWMClass=<same value as Icon> However, Edge now seems to ignore StartupWMClass completely on Wayland, breaking workspace separation and making task switching hard. Environment: Ubuntu 25.04 GNOME 48.0 / Mutter (Wayland) Kernel 6.14.0-29 Intel Iris Xe GPU Edge (latest stable, observed post 2025-09-13) Repro steps: Install any PWA (e.g. Outlook, Teams, Spotify) from Edge Launch it (from any profile) Observe that it appears grouped under the main Edge browser icon Expected: PWA shows under its own icon and window group like in Chromium-based browsers Actual: All PWAs are bundled into the main Edge window group Editing StartupWMClass in the .desktop file no longer helps This regression makes PWAs much harder to manage on Wayland. Please route to the Linux/Wayland team if possible. Thanks!4.8KViews13likes20Comments