governance
231 TopicsManaging apps built in Copilot Studio
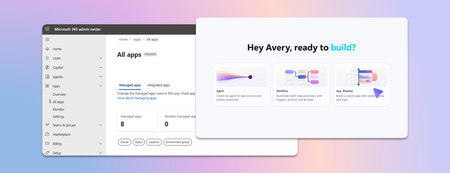
Last week we announced app building in Copilot Studio and Copilot Cowork. Makers can now describe business outcomes and produce full-stack apps with built-in source control, deployment stages, and version isolation—all on Microsoft-hosted infrastructure that requires no infrastructure provisioning, hosting configuration, or deployment pipeline. With those capabilities built in, your administrative scope is narrower and more familiar. Apps are created in the maker's personal developer environment following the environment routing policies you already have. That means things like connector permissions and data policies apply to an app both while it is being built and after it is published. Apps also access connected data on behalf of the signed-in user, which means publishing or sharing an app never grants anyone access to data they could not already reach. With these new capabilities, there are three things that every admin should be thinking about: Review your app estate Control cost with credit caps Choose where makers can build apps Review your app estate Published apps are inventoried in the Microsoft 365 admin center. Each app shows: Who built it Its lifecycle state Which data sources and connectors it uses Which policies apply to it Usage and operational metrics From the same experience, you can also block or disable a published app, remove a connector, bring an app back within policy, control whether it can be shared, and retire apps that are no longer used. Control cost with credit caps Building and running apps are both charged through Copilot Credits usage-based billing, and are metered as two separate services. This distinction lets you manage maker cost and app runtime cost independently. Build consumption varies with the language model used, the complexity of the app, and how much iteration is involved. Runtime consumption, on the other hand, varies with the volume and complexity of the tasks the app processes. At runtime, if the user holds a Power Apps Premium license, usage is included within existing request limits. Beyond those limits, or without a license, usage bills through Copilot Credits. You can learn more by reviewing the Copilot Credits licensing guide. As an admin, you can define credit cap policies to manage your costs. For both maker and runtime usage, caps are set per user, and the controls are managed through usage-based billing. For makers, think of a cap as a per-user budget: you can set the same budget for everyone, or different budgets for groups of users, such as departments that carry separate budgets of their own. Choose where makers can build apps By default, app creation is available to all users in both Copilot Studio and Copilot Cowork. However, you may want to limit where people can build apps. To do so: In the Microsoft 365 admin center, navigate to Apps, then Overview, and find ‘Choose where people can make apps’. Two paths appear: Copilot Studio, where makers build directly, which is on by default and recommended Copilot Cowork, where people create apps through chat, with availability managed by your organization's participation in the Frontier program Note that turning a path off prevents new apps being created that way. However, apps that are already published through that path will continue to run. Key takeaways for managing apps built in Copilot Studio The Microsoft 365 admin center is the one place to review the app estate, adjust app policies, and decide which creation paths stay open. Set credit caps as per-user budgets today, uniformly or by group, and plan for environment-level caps as project budgets when they arrive. Decide who is accountable for overseeing published apps before makers start publishing, as you would for any other application estate. Go to the Microsoft 365 admin center758Views0likes0Comments
How to Integrate Copilot Studio Agent with a Website Using API?
Hello Team, I have created a Copilot Agent using Copilot Studio and published it on our public website using an iframe. Currently, the agent does not have any authentication configured because we want it to be publicly accessible. However, our website development team has raised a security concern with this approach, as embedding the Copilot Agent directly using an iframe may not be the most secure or recommended approach. We are looking for an alternative integration approach. For example: Is it possible to expose the Copilot Studio Agent through an API or another secure endpoint? Can our website development team call the agent through an API, receive the response, and build their own custom UI instead of embedding the agent using an iframe? Is there any recommended architecture or Microsoft-supported approach for securely integrating a Copilot Studio Agent with a public-facing website? If anyone has implemented a similar solution or has any recommendations, I would appreciate your suggestions.234Views0likes1Comment
Copilot Studio Agent Shows Usage Limit Error Despite Low Credit Usage
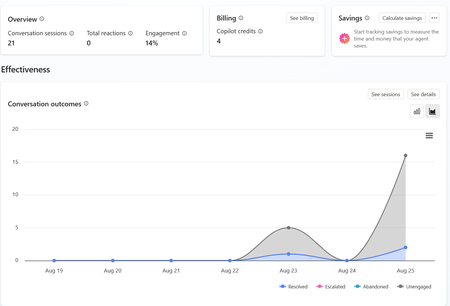
a { text-decoration: none; color: #464feb; } tr th, tr td { border: 1px solid #e6e6e6; } tr th { background-color: #f5f5f5; } Hi everyone, We are experiencing an issue with a Copilot Studio agent and would appreciate any guidance from the community. Scenario: The agent works correctly in the Copilot Studio test environment and responds as expected. However, after integrating the same agent into our web application, users receive the following error: "This agent is currently unavailable. It has reached its usage limit. Please try again later." Additional Information: In Copilot Studio Usage Monitoring, we can only see approximately 4 credits consumed. Based on the reported consumption, we would not expect a usage limit to have been reached. The issue occurs only when accessing the agent through the web application. The Copilot Studio test interface continues to work normally. Questions: Has anyone experienced a similar issue? Could this be related to licensing, capacity allocation, authentication, or channel configuration? Is there any difference in credit consumption or capacity enforcement between the Copilot Studio test environment and embedded web channels? Are there additional monitoring locations where we can verify the actual credit usage and capacity status? Any insights or recommendations would be greatly appreciated.229Views0likes1CommentUnanswered Questions on GitHub Copilot Harness in Copilot Studio
We're piloting the GitHub Copilot harness in Copilot Studio (GA August 2026) and several operational and architectural details remain undocumented in the GA FAQ, Microsoft Learn, or licensing guides. Looking for official answers or PM contacts on: Architecture & Execution – When the harness breaks tasks into subtasks, does it use internal sub-agents or only skills/connected agents, what are the exact timeout/retry/max-execution-duration limits for long-running workflows, and are planning/context-retrieval/orchestration internals documented anywhere or is the orchestrator a black box? Model Selection – Can individual skills within one agent use different models or is selection strictly agent-level, how are models chosen internally when multiple skills execute, are any internal models developer-configurable, and what's the roadmap for models being added/retired/deprecated plus the lag between public release and Copilot Studio availability? Cost & Token Optimization – How exactly is the ~45% token reduction achieved, how much control do makers have over context/caching/retrieval/tool calls, what are per-model credit consumption characteristics, which models are most cost-effective for specific workloads, and what's the minimum credit cost for trivial interactions? Memory Management – What are retention periods for session/working/agent memory beyond the documented 28-day user-memory expiry, is true long-term memory supported, and what changed versus earlier implementations? Knowledge Retrieval – Can skills or system instructions influence retrieval strategy/document selection/prioritization/filtering, can planning stages perform conflict/duplicate/version detection before retrieval, and how does the harness decide which sources to search? Apps Feature – What is the "Apps (preview)" capability for, when does it GA, and how does it differ from workflows/skills/adaptive cards/agents? Billing & Credit Sizing – Is there a framework to classify users/agents by expected consumption and size credit allocation per group (citizen vs pro developers), and what's the minimum/typical consumption for simple/medium/heavy interactions? Governance & Admin – Can usage limits be set at user level (not just environment/agent), is there an API/IaC path for large-scale credit assignment, can non-admins view their own consumption/remaining allocation, and is there a self-service request-more-credits dashboard? ALM & Environments – What's the recommended path to move harness agents across Dev/Test/UAT/Prod (Solutions/ALM "setup differs" per parity chart—how?), does GitHub integration replace or complement solution-based deployment, are there recommended AgentOps practices for source control/releases/versioning, and what baseline credits and onboarding model are suggested for citizen developers under usage billing—any enterprise reference implementations?425Views2likes1CommentMCP safety & evaluation with the Agent 365 CLI & Agent Governance Toolkit
Co Author: JiteshThakur AI agents are useful because they can act. They call tools, query databases, send messages, and hand work to other agents. That same freedom creates a problem: access control can tell you which service an agent may reach, but it does not always tell you whether a particular action is sensible, safe, or permitted. MCP is how most agents now act. Two Control Points: This post examines two control points that address different parts of the MCP lifecycle. Agent 365 CLI evaluates the MCP server before an agent uses it. Agent Governance Toolkit (AGT) governs sensitive tool calls while the agent runs. One improves what the agent sees. The other governs what the agent does. The Agent 365 CLI is a cross-platform command-line tool for Agent 365 applications on Azure. Its evaluation command examines MCP tool definitions and scores their quality. AGT evaluates actions against policy and records each decision. Together, these tools support a practical model: evaluate the server first, then provide proper scaffolding for the developer to test this in a dry run. Agent 365 CLI: Score an MCP server from the command line: The Agent 365 CLI can evaluate an MCP server against research-based practices for production readiness. The result is more useful than a simple pass or fail. The evaluation gives you: A score for each tool name, description, and parameter schema; A prioritized list of improvements; An overall maturity score for the server; and Local output that you can use early in development. This report turns a vague question, "Is this MCP server ready?", into a concrete list of work. The evaluate command a365 develop-mcp evaluate --server-url <server-url> [--auth-token <auth-token>] [options] The command reads the tool schemas from the server. It then produces guidance for names, descriptions, parameters, and schema structure. A local coding-agent CLI scores the semantic checks. You can use GitHub Copilot CLI or Claude Code under your account and AI subscription. The command does not send tool-schema data to Microsoft. Prerequisites: Install the following software: Agent 365 CLI; Node.js 18 or later for GitHub Copilot CLI; and A supported coding-agent CLI for semantic scoring. For example, install GitHub Copilot CLI with this command: powershell npm install -g @github/copilot This bring-your-own-LLM model keeps the scoring step in your local development environment. It is useful when model calls must remain inside an approved deployment. How the evaluation works The command runs a five-step pipeline and logs progress as it goes. Fig 1: MCP Evaluation using Agent 365 Cli Connect to the MCP server and collect its tool schemas. Generate an evaluation checklist in the output directory. Score the semantic checks with the selected coding agent. Calculate the maturity level and action priorities. Write the JSON and HTML reports. The evaluation contains two types of checks: Deterministic checks use exact rules in the CLI. For example, a tool name cannot be empty. Semantic checks use a coding agent to score clarity and meaning. Each result includes a reason for the score. Examples Set the authentication token in an environment variable. Then evaluate an authenticated server and write the artifacts to a subfolder. powershell $env:A365_MCP_AUTH_TOKEN = "<bearer-token>" a365 develop-mcp evaluate --server-url "https://my-mcp-server.contoso.com/mcp" --output-dir "./eval" Use a specific scoring engine with the `--eval-engine` option: powershell a365 develop-mcp evaluate --server-url "http://localhost:5000/mcp" --eval-engine claude-code Scenario: Evaluate a malicious MCP server For this demonstration, we hosted a deliberately malicious MCP server at `http://127.0.0.1:8124/`. It exposes tools that demonstrate tool poisoning, credential leakage, prompt injection, schema mismatch, sandbox escape, and other attacks. The server is intentionally unsafe and is for demonstration only. Fig 2: Setting up a test MCP server for evaluation We ran the evaluation in two steps. First, we generated the checklist without automatic semantic scoring: a365 develop-mcp evaluate --server-url "http://127.0.0.1:8124/" --eval-engine none Fig 3: Agent365CLI MCP Evaluation The command wrote the checklist and a semantic-evaluation prompt to the output directory. It also displayed the next steps. Second, we gave the prompt and checklist to a coding agent. The agent completed each unscored semantic check with a Boolean score and a short reason. After we saved the completed checklist, we ran the command again to generate the report: a365 develop-mcp evaluate --server-url "http://127.0.0.1:8124/" --output-dir "C:\temp\MaliciousMCP" Fig 4: Creating the report with Agent365 CLI MCP Evaluate command Understanding the evaluation report Open `<server-name>_eval_report.html` from the output directory. The report contains: The overall score from 0 to 100; The maturity level from 0 to 4; Scores for each tool and quality category; and A prioritized action list for the next maturity level. Fig 5: MCP Evaluation Report In our demonstration, the server scored 86.0 and reached Level 3: Optimized for AI. That strong overall score did not mean that every tool was safe or clear. The report found 58 action items, including one critical item and 33 high-priority items. That contrast matters. A server can have valid schemas and consistent names while still exposing misleading or dangerous tools. Fig 6: MCP Evaluation Report - Tool-By-Tool Detail What to look for Read the per-tool results before the overall score. A single weak tool can create more risk than the server average suggests. Focus on these report sections: Tool names: Can an agent select the correct tool from its name? Tool descriptions: Does each description explain the purpose and correct use? Parameter names: Do the names identify the data that the tool requires? Parameter descriptions: Do they explain the format, type, and constraints? Schema structure: Are the schemas valid and processable? Action items: Which changes have the highest effect on tool selection and use? The command processes static tool schemas from `tools/list`. It does not process runtime payloads, end-user data, or personal data. The command keeps the `--auth-token` value in memory. It sends the value only in the HTTP `Authorization` header. It does not write the token to disk or give it to the coding agent. AGT: Put governance in the execution path: Microsoft's open-source Agent Governance Toolkit (AGT) evaluates an action before execution. It adds identity and policy context, records the decision, and can send risky work for approval. This can be used by developers during the build time for dynamic evaluation of the MCP server. AGT lets developers put part of that intent into the execution path. Remote tools still need secure implementations, sandboxes need hard boundaries, and audit records need appropriate storage and access controls. You do not need to replace your agent framework to use it. What sits in the decision path? AGT wraps the tools that an agent already uses. You can start to govern a tool with two lines of Python: python from agentmesh.governance import govern safe_tool = govern(my_tool, policy="policy.yaml") On each call, `safe_tool` evaluates the configured policy. An allowed action reaches the original tool. A denied action raises `GovernanceDenied` and creates a decision record. This wrapper model reduces the cost of adoption. Teams can add governance to an existing agent stack without rebuilding it. AGT supports Python, TypeScript, .NET, Rust, and Go. Its documented integrations include popular agent frameworks, MCP, and A2A. Teams can also adopt AGT in stages. A team can begin with policy checks and audit records. It can add identity, approvals, sandboxing, and operational controls as risk increases. Each control answers a different question: Policy: Is this action allowed? Identity and trust: Which agent made the request? Runtime controls: What limits apply to execution? Audit evidence: Why did AGT allow or deny the action? A low-risk assistant can need only a deny rule and basic logging. An agent that moves money or changes production systems needs stronger controls. Fig 7: AGT Architecture Scenario: Govern the same malicious MCP server For this scenario demonstration, we used AGT Python packages as an MCP gateway. The gateway sat between an agent and the same malicious server from the earlier evaluation. This setup let us examine both control points against one target. The Agent 365 CLI examined the server's static tool definitions. The AGT gateway examined real requests and responses for the developer during its testing. Fig 8: AGT findings at runtime In the policy interface, a developer can edit runtime limits and detection rules. The developer can also validate the policy against sample tool metadata, save a revision, and activate it with a recorded reason. Fig 9: AGT control coverage The control-coverage view shows which AGT capabilities are active in the gateway. It also links each capability to package checks and end-to-end evidence. In our demonstration, we included the following controls: Tool metadata poisoning detection; Tool change and rug-pull detection; Dangerous argument blocking; Tool-response content scanning; Per-client tool-call budgets; and A redacted decision audit trail. You can build your detection & input security by reading more about it here. The gateway detected malicious content. For one blocked `tools/list` request, it recorded the findings. The important result was not only that AGT blocked the request. It also preserved the matched evidence, affected tool locations, policy modes, and request context. Fig 10: Example detection via AGT The dashboard then summarized block-mode findings, leading risk drivers, and tools that required review. This evidence can help a team prioritize policy changes and investigate repeated attacks. Fig 11: Sample AGT metrics AGT does not require this UI, gateway, or architecture. Its structured decisions can feed an admin console, SIEM, incident workflow, or approval queue. AGT also includes an Agent Compliance package with mappings for OWASP and other controls. These mappings give developers and governance teams a common record of applied controls. Teams do not need to reconstruct the agent's behavior after an incident. Check Compliance - Agent Governance Toolkit for more information. Conclusion: MCP safety needs controls before and during execution. The Agent 365 CLI improves the MCP interface before deployment. It exposes unclear tool definitions, scores server maturity, and turns quality gaps into prioritized work. While AGT is implemented at the build phase, it provides developers the ability to test policy, identity, execution context & preserve evidence for allowed or denied decisions. Neither tool replaces secure server code, strong sandbox boundaries, or protected audit storage. Instead, they make those controls easier to evaluate and explain. Start with one MCP server and one consequential tool call. Evaluate the server with the Agent 365 CLI. Then put an AGT policy around the action that carries the most risk. While these controls help secure the build phase of an agent, once agents move into production, runtime controls become essential. Agent365 provides those controls at runtime. With thanks to Ashik Kuppil for his inputs and collaboration on this post.
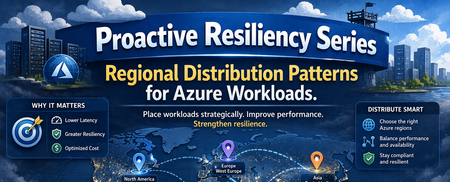
Proactive Reliability Series — Article 2: Regional Distribution Patterns for Azure Workloads
Public cloud platforms — including Microsoft Azure — are built on three foundational principles that distinguish them from traditional on-premises infrastructure: Elasticity: The platform can automatically expand and contract resource capacity in response to demand. Capacity is not statically provisioned; it is drawn from a shared pool and released when no longer needed. Scaling: Workloads can scale horizontally (adding more instances) or vertically (increasing instance size) on demand, without pre-procurement of physical hardware. Consumption-based billing: Customers pay for what they use, when they use it. Cost is proportional to resource consumption, not to physical capacity reserved in advance. These principles are properties of the platform, not of any single location. Microsoft Azure Cloud is not a single region — it is a globally distributed platform comprising dozens of regions across every major geography, interconnected by a private backbone network. When an organisation deploys to Azure, it is deploying into this global system; the choice of which region or regions to use is based on an organizational strategy and architectural decision. Using a single Azure region is a valid choice in many scenarios, but it has to be a deliberate architecture decision, not an omission. Why Multi-Region? Microsoft Azure CTO Mark Russinovich summarises the case for multi-region in Achieve agility and scale in a dynamic cloud world: organisations that span multiple regions gain scalability and flexibility (choosing from the full Azure region portfolio, including differentiated pricing, AI capabilities, and deployment options), resilience and availability (reducing the impact of regional disruptions through multiple backup and recovery options), and performance and reduced latency (serving users from infrastructure that is geographically closer to them). The post's closing recommendation — "leverage Azure as a cloud platform, not a datacenter region" — makes explicit what the multi-region decision ultimately is: a choice to treat the platform's global footprint as an asset, not a constraint. Mark Russinovich — Achieve agility and scale in a dynamic cloud world (Microsoft Azure, September 2024) This article also does not argue whether to adopt a multi-region strategy — that is a business and risk decision. It describes what the options are: the available regional distribution patterns, the forces each resolves, and the trade-offs each accepts. Regional workload distribution is not simply an application-level decision — it is an organisational one. It shapes how a company scales its cloud presence, manages cost and operational complexity across a growing portfolio, meets data residency and regulatory obligations, and positions itself to respond to changing conditions. Multi-region is often a necessity, not a free choice: growth ambitions, compliance requirements, or risk obligations may demand it. But necessity does not determine form. These patterns define the decision space: whether operating across multiple regions is warranted at all, and if so, which structural arrangement fits the organisation's scale, objectives, and operational capability. Several patterns are adapted from Gregor Hohpe's multi-cloud strategy patterns, originally described in Multi Cloud Architecture: Decisions and Options and further elaborated in Multi-cloud: From Buzzword to Decision Model. Important This is an unofficial guide to regional distribution patterns for Azure workloads. It is not an official Microsoft publication and is not officially supported, endorsed, or maintained by Microsoft. All descriptions and recommendations are based on publicly available Azure documentation and general distributed systems principles. Always refer to official Azure documentation and the Azure Well-Architected Framework for authoritative guidance. The Risks and Opportunities Pattern selection is a direct response to specific risks or solution quality requirements. Before evaluating patterns (options), it is necessary to understand what risks are actually relevant — infrastructure faults, capacity constraints, service coverage gaps, and compliance or business obligations — and what their scope of impact is. Azure infrastructure is complex and distributed. While Microsoft invests heavily in reliability, faults can and do occur across a wide range of blast radii — from a single compute instance at the narrowest end, through Availability Zone and regional failures, to global service disruptions at the widest. The appropriate pattern is the one that reduces unacceptable risks to a tolerable level. The Azure Well-Architected Framework — Reliability pillar recommends Failure Mode Analysis (FMA) as the structured technique for enumerating failure modes, assessing their impact, and identifying mitigations before they are needed in production. The fault types below are the infrastructure-layer inputs to that analysis. For a detailed breakdown of each fault type — including likelihood analysis, real-world incident examples, and detection guidance — see Proactive Reliability Series — Article 1: Fault Types in Azure. Risk Catalog (Sample) The following is a representative sample of risks relevant to regional workload distribution decisions, not an exhaustive catalogue. Not all entries are infrastructure faults — some represent business and compliance obligations. The Category column identifies the type of each risk. Likelihood values are relative planning heuristics to help prioritise resilience investments — they are not statistical probabilities and do not represent Azure SLA commitments. Risk Category Blast Radius Likelihood Primary Mitigation Service Fault (Region) Infrastructure Fault Single service within a region Medium Region redundancy Region Fault Infrastructure Fault Regional degradation or full regional loss (partial-to-full region impact) Low Region redundancy; cross-region failover Network POP Location Fault Infrastructure Fault Network colocation site (affects connectivity, not compute) Low ExpressRoute Metro (dual peering locations); network path redundancy Service Fault (Global) Infrastructure Fault Worldwide or multiple regions simultaneously Very Low Accept risk; use alternative service if downtime is intolerable Regional Service Capacity Constraint Infrastructure Capacity Single region (required capacity unavailable — whole service or specific SKU — at failover time or sustained shortage) Low Region redundancy; Capacity Reservations; Hot Standby; alternative region Service Regional Unavailability Infrastructure Fault Single region (desired service not offered in that region) Low Deploy to a region where the service is available Geopolitical Risk Compliance One or more regions (regulatory or political mandate to relocate) Low Portable pattern; pre-validated alternative region Sustainability Constraint Compliance One or more regions (sustainability targets unachievable in current region) Low Portable pattern; relocate to region with required sustainability profile The Patterns While there could be many ways to distribute workloads across Azure regions, the following patterns represent the most common and widely applicable approaches. Each pattern is a structural topology that defines how workloads are deployed and how they respond to Risks and Quality Requirements. The patterns are not mutually exclusive — they can be combined or layered to meet specific requirements. The following patterns describe the principal ways workloads can be distributed across Azure regions. Patterns 1-3 are described and found very often, while patterns 4-5 are less common but still important to consider. The table below summarises the patterns, their intent, and the primary driver for their adoption. # Pattern Intent Primary Driver 1 Single All resources in one Azure region; AZ redundancy optional Simplicity; cost; data residency constraints 2 Failover Primary region serves traffic; secondary region is a cold or hot standby for DR Business continuity 3 Parallel Same workload deployed to multiple regions simultaneously; all active Continuous availability; zero-downtime failover 4 Segmented Services or service portfolio distributed across regions by BU, LOB, tenant, or data residency Isolation; sovereignty; independent release cadence 5 Portable Full portability; workloads can be relocated between regions without application changes Operational flexibility; on-demand relocation 1. Single Region Pattern Pattern Name: Single Region Workload Distribution Classification: Regional workload distribution Scope: Workload — applies to a single application or service deployment, Workload (Application) Portfolio Intent: Deploy all workload resources in one Azure region; Context: A workload is being deployed to Azure and must decide how many regions to use. The business impact of a regional outage has been assessed — either as tolerable within the workload’s criticality tier, or as not applicable because data sovereignty constraints prohibit cross-region replication. The team needs to treat Single Region as an explicitly chosen architecture, not an omission. Problem: Every additional Azure region adds infrastructure cost and workload integration complexity due to the introduced network latency. Not all workloads justify this overhead. The question is not “should I always use multiple regions?” but “when is a single region the correct and explicitly chosen answer, and when does adding a second region produce risk-reduction that justifies the cost?” Forces: The workload’s risk profile does not justify cross-region redundancy: the business impact of a regional outage is tolerable, data sovereignty rules prohibit cross-region replication, or reliability requirements are fully met within a single region with Availability Zone redundancy. The cost of multi-region infrastructure produces no corresponding risk-reduction return for this workload. Solution Place all compute, data, and networking resources in a single Azure region. Apply Availability Zone redundancy within that region for protection against datacenter-level failures. Formally accept region-level risk as within tolerance for this workload’s criticality tier — this is a deliberate architecture decision, not an omission. Implementation: Enable Availability Zones for all production resources where supported. Use Azure Infrastructure Resiliency Manager (AIRM) to validate zone-redundancy posture across the workload. Document the risk-acceptance decision explicitly at the application level. Consequences Benefits: Lowest cost and operational footprint of all patterns. No cross-region routing, replication lag, or failover coordination complexity. Simplest deployment pipeline, observability surface, and incident response. Liabilities: No mitigation for any region-level fault — full workload loss on regional failure. Data concentrated in one geography; no cross-region durability without explicit configuration. No pre-deployed capacity in an alternative region. Risk posture: Risk Assessment Region Fault ❌ Primary unaddressed risk — partial degradation or full regional failure has no cross-region recovery path; accept or upgrade pattern Service Fault (Region) ❌ Regional service failures have no cross-region alternative Regional Service Capacity Constraint ❌ No alternative region available; both on-demand failover provisioning and sustained SKU shortages have no mitigation path Network POP Location Fault ✅ Addressable within this pattern via ExpressRoute Metro (dual peering locations in the same metro); does not require a multi-region distribution change Known Uses Development and test environments; Bronze- or Non-Critical-tier workloads; workloads with strict data residency constraints that prohibit cross-region replication; proof-of-concept and time-limited deployments. See Azure Services - Sample Multi-Region Capabilities Pattern Mapping for how individual Azure services implement this pattern. 2. Failover Pattern (Primary + Standby Region) Pattern Name: Failover Workload Distribution Also Known As: Active-Passive, Disaster Recovery (DR), Business Continuity and Disaster Recovery (BCDR) Classification: Regional workload distribution, Application Design, Platform/Infrastructure Design, Disaster Recovery Scope: Workload — an application and infrastructure design pattern that requires both layers to work in tandem; Workload (Application) Portfolio Intent: Recover from a regional disaster or other longer duration region outage by designating a primary region to carry all production traffic and a standby region to absorb that traffic upon primary region failure. The typical quality attribute metrics that govern its design are RTO (Recovery Time Objective — maximum tolerable downtime), RPO (Recovery Point Objective — maximum tolerable data loss), and MTTR (Mean Time To Recovery — the observed average recovery time, measured through drills and real incidents, that validates whether the RTO target is achievable in practice). Context: A workload must survive region-level failures, but the architectural complexity of running two fully active deployments simultaneously — with multi-region write-conflict resolution — is not justified. The business can tolerate a bounded recovery time and, depending on the sub-variant chosen, a bounded data loss window. Problem: A fully active multi-region deployment (Parallel pattern) introduces multi-region write-conflict complexity that the application cannot or need not absorb. The Failover pattern trades continuous availability for single-writer simplicity: one region is active, one is standby, and recovery is bounded by RTO/RPO targets. The sub-variant choice (Cold / Warm / Hot) then determines how much cost is invested in standby readiness — from minimal (~1.1×) to near-full duplication (~2×) — based on how fast recovery must be. Forces: A single active write region is required — multi-region write-conflict resolution adds unacceptable consistency risk or development complexity. RTO and RPO targets must be met, but budget constrains how pre-warmed the standby region can be, driving the Cold / Warm / Hot sub-variant selection. Regional Service Capacity Constraint in the standby region is a residual risk for Cold and Warm sub-variants — the standby may fail to scale at failover time unless capacity is pre-reserved. Solution Designate one region as primary (all production traffic under normal conditions) and a second as standby (no production traffic until failover). The standby’s readiness level — the sub-variant choice — is determined by the RTO/RPO requirements and cost envelope. Replication from primary to standby is continuous; failover is triggered manually or automatically when the primary becomes unavailable. Note on "Active-Passive": This pattern is often called Active-Passive in Microsoft documentation. That framing is accurate at the traffic level (one region active, one passive), but it can obscure the architectural intent. The Failover label here emphasises the capability being purchased: the ability to redirect the entire workload to a pre-designated region when the primary is unavailable. Implementation: The key design decision is how ready the standby is at the moment it is needed. Three sub-variants define this readiness spectrum: Sub-variant Secondary state Cost multiplier Cold Standby No running compute; data either in scheduled backups or continuously replicated ~1.1–1.5× Warm Standby Reduced-scale compute running; data continuously replicated ~1.5–1.8× Hot Standby Full-scale compute running; data continuously replicated ~2× Cold Standby — No compute is running in the standby region under normal conditions. Cold Standby covers two positions within this state, differing in how the data layer is protected: Backup/Restore: Data is backed up or geo-replicated on a scheduled basis. On failover, infrastructure must be deployed from scratch and data restored before traffic can be redirected. RTO is measured in hours; RPO equals the interval between the last backup cycle and the failure event. Data-layer live, compute stopped: Core infrastructure (networking, identity, data tier) is kept running with continuous replication to the standby region; compute is stopped or scaled to zero. On failover, compute is started and scaled up to meet full load. RTO is typically 15–60 minutes; RPO is bounded by async replication lag rather than backup interval. Both positions share the defining characteristic of Cold Standby: no production-equivalent compute running in the secondary region under normal conditions. The difference is the investment in keeping the data layer live, which reduces both RTO and the data loss window at a modestly higher steady-state cost. Warm Standby — The standby region runs a scaled-down but functionally complete version of the workload. Traffic is not routed there under normal conditions. On failover, the secondary scales up and traffic is redirected. A brief scale-out lag occurs before the secondary absorbs full traffic; the running environment eliminates cold-start delay. Hot Standby — The standby region runs a full, production-equivalent deployment — same compute capacity, same configuration — but receives no traffic under normal conditions. Data is continuously and near-synchronously replicated. Failover is fast and often automated because no scale-up is required. Consequences Benefits: Enables recovery from region-level faults at a fraction of Parallel pattern cost. Flexible cost-vs-RTO trade-off across Cold / Warm / Hot sub-variants. No multi-region write-conflict complexity; single active write region throughout normal and recovery operation. Liabilities: Cold and Warm standby introduce meaningful RTO (minutes to hours). Replication lag creates a data loss window (RPO > 0) at the moment of failover. The failover path is the least-exercised code path — untested recovery inflates actual RTO. Failover is often neglected and not properly and regularly tested - this leads toward a fear to execute failover when needed (and it is not only full region disaster). Risk posture: Risk Assessment Region Fault ⚠️ Primary driver; standby region absorbs traffic on full regional loss, but partial regional degradation may not trigger automated failover. RTO depends on sub-variant Regional Service Capacity Constraint ⚠️ Cold/Warm Standby are exposed to both on-demand provisioning failure and sustained SKU shortages — mitigated by Capacity Reservations or Hot Standby Service Fault (Region) ✅ Standby region provides an alternative deployment for regional service failures Service Regional Unavailability ⚠️ Secondary region must be verified for full service parity at design time — absent services block failover regardless of compute readiness Known Uses Business-critical workloads with defined RTO/RPO targets that cannot accept region-level risk but do not require continuous multi-region availability; workloads with single-writer data models where multi-region write-conflict resolution is unacceptable; regulatory environments where a designated recovery region must be pre-approved. See Azure Services - Sample Multi-Region Capabilities Pattern Mapping. 3. Parallel Workload Distribution (Simultaneous Active Deployment) Pattern Name: Parallel Workload Distribution (Simultaneous Active Deployment) Also Known As: Active-Active Classification: Regional workload distribution, Application Design Scope: Workload — an application-level design pattern; requires the application and its data layer to be explicitly designed for concurrent multi-region operation, Workload (Application) Portfolio Intent: Deploy the same workload simultaneously to two or more Azure regions, all serving production traffic. Context: Two independent drivers lead to this pattern, often simultaneously: the workload serves geographically distributed users who require regional proximity to meet latency targets, and the availability tier demands zero-downtime through region-level failures. A single deployment point cannot satisfy both. Manual failover timelines, standby region promotion, and RPO windows are incompatible with the required availability tier. This pattern is the mandated baseline for Mission-Critical workloads in the Azure Well-Architected Framework. Problem: Passive standby and failover mechanisms introduce recovery time and data loss windows that are incompatible with high-availability targets (e.g. 99.99%+). Meeting both demands requires all regions to be equal active participants — not a primary and a standby. But this demands that the data layer either supports concurrent writes across regions, relies on continuous cross-region replication with a defined consistency model, or is predominantly read-heavy — and that pre-provisioned capacity is maintained in every active region at all times. Forces: Regional failure must produce zero downtime — manual failover timelines cannot satisfy the availability target. Traffic originates from geographically distributed users who require regional proximity to meet latency SLAs. Availability targets (e.g. 99.99%+) eliminate passive standby as a viable option. The application can tolerate eventual consistency or is read-heavy enough that multi-region write complexity is manageable. Once multi-region data access is solved, every region's compute actively serves production traffic — the capacity that Failover Hot Standby holds idle is fully utilised; the cost multiplier buys active production capacity, not idle insurance. Solution Deploy the workload identically to two or more Azure regions. Route production traffic to all active deployments simultaneously via a global load balancer — under normal conditions, each user is directed to the nearest active region, minimising latency. On regional failure, the load balancer automatically rebalances traffic to the remaining healthy regions — no manual promotion, no scale-up delay. All regions are equal peers; there is no concept of primary and secondary. Implementation: Deployment Stamps are commonly used to implement Parallel at scale — multiple active regional instances behind global routing. See Deployment Stamps pattern — Azure Architecture Center. Stamps are not exclusive to Parallel: the same approach can also support Segmented and, in some designs, Failover. Regions active: 2+ (all serving production traffic simultaneously). Typical cost multiplier: ~2–3×. Microsoft guidance — Mission-Critical workloads: The Azure Well-Architected Framework’s Mission-Critical design methodology explicitly advises active-active multi-region deployment as the baseline for workloads targeting 99.99% availability or higher. The application design guidance states: “The application must be able to withstand regional and zone failures. It must be deployed in an active/active model so that the load is distributed among all regions.” The regions and availability zones guide reinforces this: “Mission-critical workloads should use both multiple availability zones and multiple regions.” The WAF Reliability pillar describes active-active as the mechanism to achieve zero downtime, noting it is “ideal for mission-critical workloads that require uninterrupted availability.” Consequences Benefits: Regional failure triggers automatic traffic rebalancing — no manual failover, no service interruption. Lowest RTO of all patterns; zero-downtime regional failure recovery. On regional failure, remaining regions absorb redirected traffic immediately — if at capacity, the workload degrades under load rather than failing completely; degraded performance is a fundamentally better failure mode than an unavailability window. Serves geographically distributed users within latency bounds simultaneously from the nearest active region. Compute deployed per region actively generates production value under normal conditions — the nominal cost multiplier buys utilised capacity, not idle standby insurance. Liabilities: Highest nominal cost (~2–3×) — though compared to Failover Hot Standby (~2×), the effective cost of resiliency is lower: every unit of deployed capacity actively serves production traffic rather than sitting idle as insurance. Requires the application to support multi-region writes or be predominantly read-heavy; write-conflict resolution is an application responsibility. Multi-region CI/CD, distributed observability, and write-conflict handling add steady-state operational overhead — but eliminate the failure-event burden: no failover procedure, no drill schedule, no risk of untested recovery paths inflating actual RTO. Risk posture: Risk Assessment Region Fault ✅ Primary driver; automatic traffic rebalancing handles both partial regional degradation and full regional loss — no promotion or manual steps required Service Fault (Global) ⚠️ No regional workload distribution pattern mitigates a truly global service disruption — but the impact is often partial: only specific SKUs, tiers, or versions of a service may be affected, leaving workloads on unaffected variants operational. Where the risk is intolerable, the mitigation is service substitution: switching to an alternative Azure service with equivalent functionality, or a third-party / self-hosted equivalent Service Fault (Region) ✅ Automatic rebalancing redirects traffic away from the affected region without manual failover Regional Service Capacity Constraint ✅ All regions are pre-deployed and running; no on-demand capacity provisioning required at failover time — if a region fails and remaining regions reach capacity limits, the result is degraded performance under load, not complete unavailability Known Uses Mission-Critical workloads targeting 99.99%+ availability per WAF guidance; globally distributed consumer applications where regional proximity is a primary SLA requirement; financial trading and payment platforms where any recovery window is commercially unacceptable; real-time communication and streaming services where failover lag degrades the user experience. See Azure Services - Sample Multi-Region Capabilities Pattern Mapping. 4. Segmented Workload Distribution (Regional Distribution by Boundary) Pattern Name: Segmented Workload Distribution Also Known As: Deployment Boundaries, Regional Portfolio Allocation Classification: Regional workload distribution (portfolio scope) Scope: Portfolio / Organisation — a structural pattern for distributing a portfolio of workloads, tenants, or business units across regions; individual workloads within a segment may independently apply any other pattern Intent: Assign each Azure region a distinct, non-overlapping responsibility boundary so that regions are differentiated by ownership and isolation rather than by redundancy. Context: A portfolio of workloads, a multi-tenant application, or a multi-LOB organisation must distribute services or data across regions. The drivers include regulatory boundaries, tenant isolation, blast-radius containment, or operational independence — not simply increasing redundancy. Individual boundaries within the portfolio have materially different criticality tiers, release cadences, and recovery requirements. Problem: Running a second Azure region purely as a Failover standby generates ongoing cost without delivering business value under normal conditions. How can an organisation operate multiple regions so that every region carries real production workload, the cost is justified by utilisation rather than insurance alone, and each region's scope is independent enough that faults and changes in one area do not propagate to others? Forces: Regulatory, sovereignty, or compliance obligations drive geographic boundary placement — but strict data residency that prohibits cross-boundary replication also prevents the cross-region recovery that makes Segmented cost-efficient; a boundary whose data cannot leave its region can only recover within that region (Single Region posture), regardless of what neighbouring segments deploy. Independent release cadences, lifecycle autonomy, and scaling requirements across services, tenants, or business units conflict with coupled shared-infrastructure deployments. Blast-radius containment requirements prevent a single fault or bad deployment from affecting the entire portfolio. This pattern does not answer how each boundary recovers; that choice is made independently per boundary using Single, Failover, or Parallel. Solution Define non-overlapping responsibility boundaries and assign each boundary to a region. Each region owns its boundary exclusively — no region is a replica of another. Each boundary independently selects its own recovery posture (Single, Failover, or Parallel) based on its own criticality and requirements. The key structural advantage is region reuse: because multiple regions are already deployed and carrying real production load, each region can simultaneously serve as the Failover standby or Parallel peer for a neighbouring boundary — the same infrastructure investment delivers both production utilisation and recovery capability. This dual-purpose reuse is only available where cross-boundary data replication is permitted; where strict data residency prohibits it, each boundary must treat itself as isolated and plan recovery within its own region. Implementation: The boundary can be defined at different scopes: Within one application: tenants, markets, release rings, or data partitions assigned to different regions. Across a service portfolio: different applications, domains, or business capabilities intentionally placed in different regions. Segmentation axis Example Geography / data residency EU services and data in West Europe, US services and data in East US Business unit / LOB Finance portfolio in Region A, HR portfolio in Region B Customer tier Premium customer workloads in dedicated region(s), standard in shared region(s) Release ring Ring 0 workloads in Region A, Ring 1 workloads in Region B Scale tier High-volume service groups in larger regions, low-volume groups in smaller regions Consequences Benefits: A fault in one boundary is contained to that region and does not propagate to adjacent boundaries. Each boundary independently selects its own recovery posture, cost level, and compliance configuration. Supports independent release cadences, scaling policies, and lifecycle management per boundary. Region reuse: already-deployed regions carrying production load can simultaneously serve as Failover standby or Parallel peer for neighbouring boundaries — the infrastructure investment delivers both production utilisation and recovery capability without paying for idle standby capacity. Liabilities: Cross-boundary dependencies — shared identity, shared data stores — undermine isolation guarantees and must be minimised by design. Governance overhead scales with the number of active boundaries; requires a formal boundary ownership model to remain manageable. Risk posture: Risk Assessment Service Fault (Region) ⚠️ Fault is contained to the affected boundary; adjacent boundaries continue operating — within-boundary recovery depends on that boundary’s posture Region Fault ⚠️ Only the boundary hosted in the affected region is impacted — RTO/RPO is determined by that boundary's individual recovery posture Regional Service Capacity Constraint ⚠️ Only the boundary in the capacity-constrained region is affected; other boundaries continue operating — mitigation depends on the boundary's own topology (Failover or Parallel provides alternatives; Single does not) Geopolitical Risk ✅ Boundaries can be relocated independently; the rest of the estate continues operating while the affected boundary is relocated Service Regional Unavailability ✅ Each boundary can be independently placed in a region where all required services are available Known Uses Geo-distributed enterprise application portfolios; organisations with a federated business model where autonomous business units operate independently with their own release cadence, cost accountability, and compliance obligations; SaaS platforms with tenant-per-region isolation; regulated financial and healthcare services with strict data residency by jurisdiction. See Azure Services - Sample Multi-Region Capabilities Pattern Mapping. 5. Portable Workload Distribution (Full Abstraction) Name: Portable Workload Distribution (Full Abstraction) Also Known As: Region-Agnostic Deployment, Cloud-Neutral Deployment Classification: Operational property (applicable to any structural pattern) Scope: Workload — a design property of an individual workload; composable with any structural pattern at either workload or portfolio scope Intent: Fully abstract the workload from the underlying Azure environment so it can be relocated to any Azure region at any time without modifying application code or configuration. Context: A workload is subject to compliance obligations — regulatory, geopolitical, or sustainability — that may require region relocation on short notice. Or the workload's operational requirements include the ability to optimise cost, respond to capacity constraints, or avoid service unavailability across regions. Portability is not the default outcome — it requires an explicit design decision and sustained engineering investment. Without that intent, the default is a workload that is structurally bound to its current region. Problem: Without a portability investment at design time, a relocation trigger forces significant rearchitecting under pressure rather than as a controlled migration. Forces: Compliance obligations — regulatory, geopolitical, or sustainability — may require relocation on short notice; deferring the portability decision converts a design choice into a forced rearchitecting event at the worst possible time. Data portability is the hardest dimension: scheduled backup/restore, continuous replication, and live migration each introduce cost, complexity, and consistency trade-offs that must be accepted at design time. Relocation may be temporary or permanent; the architecture must support both without distinguishing between them at deploy time. A port may be partial (subset of workloads) or full (entire estate); partial porting creates transient cross-region dependencies that must be explicitly designed for and eliminated as the migration progresses. Solution Select and implement a data portability mechanism — continuous replication, backup/restore, or live migration — whose cost, RPO, and operational model are explicitly accepted at design time. The target region is not fixed at design time — it is chosen when a trigger event occurs, and can be any eligible region. The workload stays in its current region under normal conditions and relocates only when a trigger event warrants it. Implementation: Portable is a layered property, not a separate structural topology. The underlying structural topology (Single, Failover, Parallel, or Segmented) determines traffic routing and redundancy; Portable governs whether that topology can be instantiated in a different region without application changes. The cost multiplier adds toolchain and abstraction overhead on top of the chosen structural topology. Data portability — the critical path: Compute portability is straightforward — container images and environment-agnostic configuration are standard practice. Data portability is the harder problem. Two mechanisms make it achievable: Continuous replication: The data layer replicates to the target region at all times, so the data is already present when a relocation is triggered. Azure Cosmos DB with multi-region writes, Azure SQL Database geo-replication, and Azure Storage geo-redundancy (RA-GRS/RA-GZRS) are common implementations. Continuous replication minimises RPO but adds steady-state cost. Automated data migration: A codified and continuously tested migration pipeline moves data to the target region at relocation time. Appropriate when continuous replication cost is not justified, or when the data tier does not support native geo-replication. The migration must be automatable, testable in isolation, and fast enough to satisfy the workload’s RTO for the trigger event. Port modes: Partial vs. Full A port — the act of relocating a workload using the Portable pattern — can be scoped in two ways: Partial port: A subset of workloads is relocated to the target region while others remain in the source region. This creates transient cross-region dependencies — service calls, data access, shared identity — between moved and not-yet-moved workloads. These dependencies must be explicitly designed for, monitored for latency and failure, and eliminated progressively as the migration advances. Partial porting is the natural execution mode for large estates where simultaneous full relocation is operationally infeasible. Full port: All workloads are relocated to the target region, either simultaneously or in a planned sequence that keeps cross-region dependencies only for the duration of each step. A full port is a long-term, intentional change of primary region. It is fundamentally different from a Failover event: Dimension Failover Full Port (Portable) Intent Quick recovery and return to primary region when resolved Permanent change of the region Duration Temporary — primary is restored after the event Long-term or permanent — target becomes the new primary Return Expected — traffic and workloads revert to original region Not expected — no return is planned Driver Region fault, outage, or transient unavailability Compliance, cost, sustainability, or strategic decision Transition Time Aiming RTO Transition can take weeks or months (but it can be designed to serve the Failover purpose and meet RTO and RPO requirements) Transition disruption Minimal — automated or semi-automated failover Managed — gradual migration with a cross-region dependency period The Portable pattern must support both modes and both scopes. A workload that can only be relocated as an atomic all-or-nothing operation has limited practical utility; a workload designed for incremental partial porting is far more executable at scale. Consequences Benefits: Workload can relocate to any Azure region without application changes — eliminates region lock-in. Target region is determined at the time of the trigger, not at design time — unlike Failover's fixed designated standby, the destination can be any eligible region and can change between port events as requirements evolve. Primary architectural mitigation for compliance-driven relocation risks (Geopolitical Risk, Sustainability Constraint). Relocation can be temporary (workload returns after trigger resolves) or permanent — the architecture supports both without distinguishing between them. Liabilities: Portability is costly to establish and maintain; data portability and the abstraction layer add ongoing engineering and toolchain overhead. Data portability is the hardest and most underestimated engineering challenge — relocating compute is straightforward; relocating live data at acceptable cost, latency, and consistency is not. Introduces dependency on the abstraction toolchain — portability conventions must be actively enforced as engineering standards; without governance, individual implementation decisions erode them over time. Risk posture: Risk Assessment Geopolitical Risk ✅ Primary driver — region-agnostic workload relocates to a compliant region; unportable workloads face forced migration under time pressure Sustainability Constraint ✅ Workload moves to a region with the required sustainability profile without application-level changes Regional Service Capacity Constraint ✅ Workload can be relocated to an alternative region with available capacity — addresses both on-demand provisioning failure and sustained shortages Region Fault ✅ Workload can be relocated to an alternative region; recovery speed depends on data portability readiness Service Regional Unavailability ✅ Workload can be redirected to any region where required services are available — portability removes the fixed-region constraint Known Uses Workloads subject to data sovereignty or geopolitical obligations that may require region relocation on regulatory notice; sustainability-committed workloads that may need to move to regions with a lower carbon intensity; workloads in rapidly expanding organisations that need to follow business growth into new geographies without rearchitecting. Several patterns are adapted from Gregor Hohpe's cloud strategy patterns: Multi Cloud Architecture: Decisions and Options — Architect Elevator. See Azure Services - Sample Multi-Region Capabilities Pattern Mapping. Related Patterns Portable vs. Failover — Both result in a workload running in a different region, and a full port and a Hot Standby activation look nearly identical at execution time. The distinctions are fundamental: Failover is a topology (one region is permanently designated as standby); Portable is a property that can be layered on top of any topology. Failover requires a fixed secondary region to be designated at design time — the target is known, pre-provisioned, and not interchangeable. Portable has no fixed target: the destination region is chosen at the time of the trigger, can be any eligible region, and can differ between port events as compliance, cost, or operational requirements change. Failover is triggered by an unplanned disruption and is temporary — the expectation is to return to the original primary when the event resolves. A Portable port is triggered by a deliberate decision and is permanent — the destination becomes the new primary with no planned return. A Failover workload can also be Portable, applying both patterns simultaneously: Failover handles unplanned disruptions; Portable handles deliberate relocation decisions. They are orthogonal — not alternatives. From Patterns to a Cloud Growth Strategy The patterns in this article show that regional distribution is not a single decision — it is a spectrum of options, each with a different cost, complexity, and risk mitigation profile. The patterns are not mutually exclusive: a portfolio — or even a single workload — may combine multiple patterns to achieve its reliability, compliance, and operational goals. Having the full range of patterns available does not answer the harder question: which patterns are right for your organisation, which applications need them, and what will it take to get there? That is a strategy question — and it requires a deliberate answer. Most organisations today operate their workloads in the Single Region or Failover pattern. Transitioning from that baseline to Parallel, Segmented, or Portable distribution is not an infrastructure change — it is a programme of work that requires investment justification, architectural readiness, and a governed execution plan. A Cloud Growth Strategy based on regional workload distribution starts by defining the organisation's objectives: what reliability targets must be met, which compliance or sovereignty constraints apply, what operational scale is planned, and where the current estate falls short. From those objectives it derives what the regional footprint should look like for this organisation — not as a generic best practice, but as a concrete commitment about which patterns apply to which parts of the portfolio, at what pace, and at what cost. Conclusion Azure's global footprint makes regional workload distribution a choice for every workload — but not a requirement for all of them. The decision starts with risk: the Risk Catalog identifies which fault types and capacity or compliance constraints are actually relevant to the workload, and what blast radius each carries. From that foundation, five patterns emerge — Single Region, Failover, Parallel, Segmented, and Portable — each resolving a distinct set of forces at a different cost and complexity point. Real Azure services rarely fit one pattern cleanly; the service examples in this article illustrate how capability gaps, consistency models, and replication architectures constrain which patterns are structurally achievable. Translating this into organisational practice requires a deliberate Cloud Growth Strategy: classify applications by criticality, assess their suitability for each pattern against their current state, and produce a governed distribution map that is maintained as the portfolio and platform evolve.
Microsoft AI Agent Creator Associate Certificate
Hello everyone, I have a question about the Microsoft AI Agent Creator Associate certification. I’m passionate about artificial intelligence and Microsoft Copilot Studio. I’m currently taking the training course and working toward earning the Microsoft AI Agent Creator Associate certification. My question is: Will earning this certification improve my chances of getting a job at Microsoft? If anyone in this community has earned this certification or has experience with it, I’d really appreciate your feedback. Has it helped you get hired by Microsoft or one of its partners? Thank you in advance for your advice and insights!126Views0likes0Comments
Copilot Studio agent works in M365 Copilot but silent in Teams personal chat (0 Studio sessions)
We are troubleshooting a Copilot Studio agent that works in Microsoft 365 Copilot and Studio test, but does not receive inbound activities from Microsoft Teams personal chat. Environment - Agent: Caflou Asistent v1.0.8 - Channels: Microsoft 365 Copilot + Microsoft Teams (published / synchronized) - Agent Registry: Available - Entra/bot appId: 7e4a53cc-f51c-4772-ad93-e3f1e8060f35 - Maker-provided tool connection works in Studio (example getTasks HTTP 200) What works 1) Microsoft 365 Copilot agent chat / shareLink → agent replies; Studio sessions with channel "Microsoft 365 Copilot" 2) Copilot Studio test pane → agent responds What fails 1) Teams personal chat (desktop AND web): user message visible in "Caflou Asistent" chat, no agent reply 2) Studio Monitor: Teams channel sessions = 0 for probes (only M365 Copilot sessions in last 7 days) 3) Teams Admin Center → Manage apps: 0 results for name "Caflou" and full appId (other apps searchable); UAM banner present while Registry shows Available Classification - Teams inbound activity not reaching Copilot Studio runtime - Not OAuth / not MCP host / not publish alone (M365 path proves runtime alive) - Secondary: Registry Available ≠ TAC Manage apps listing Questions 1) Why would Teams 1:1 never create a Studio conversation while M365 Copilot does? 2) Is missing TAC Manage apps row expected under Unified App Management when Registry shows Available? 3) Best next diagnostic when Monitor shows 0 Teams sessions after confirmed client send? Constraints: no Copilot Studio paid support plan; looking for field experience / known product issues. No secrets posted.134Views0likes0CommentsCS agent OK in M365 Copilot; Teams chat silent / no Studio session
We are troubleshooting a Copilot Studio agent that works correctly in Microsoft 365 Copilot and in the Copilot Studio test surface, but does not receive inbound activities from Microsoft Teams personal chat. Environment and evidence: - Agent: Copilot Studio agent (custom business assistant) - Copilot Studio agent ID: 88901b10-… (truncated) - Teams/Entra app ID: 7e4a53cc-… (truncated) - Manifest version: 1.0.8 - Channel configuration: Microsoft 365 Copilot + Microsoft Teams - Publish: Succeeded / Channel state: Synchronized - Agent Registry: Available - Authentication: Integrated / Tool credentials: Maker-provided - MCP/custom connector runtime: working (Studio tool test HTTP 200) - Microsoft 365 Copilot routing: working Failure specific to Teams: - Messages in Teams web and desktop appear delivered in the agent personal chat - Agent never replies - Studio monitor has M365 Copilot sessions, but no Teams session for those timestamps - Teams Admin Center Manage apps returns 0 results by name or exact app ID despite Agent Registry Available - Intentionally not republishing / reconnecting OAuth / rewiring connectors because M365 Copilot path proves the same agent+connection works Classification: FAIL — Teams inbound activity is not reaching the Copilot Studio agent. Questions: 1. Anyone seen agents that work in M365 Copilot but receive no personal-chat activities from Teams? 2. Can Agent Registry show Available while TAC Manage apps has no matching row? 3. Known Unified App Management sync issues for Copilot Studio agents? 4. Separate Teams app catalog deployment/approval required when Teams channel shows Synchronized? 5. Which logs prove whether Teams attempted to route the inbound activity? 6. Known manifest / personal scope / app-centric management / conversation-binding issues with this split? Looking for confirmed production experience or documented workaround. Redacted screenshots available; no tokens/secrets.81Views0likes0CommentsBuild your own Engage Governance agent
The best governance guidance often comes from real conversations with customers: the questions they ask, the decisions they are working through, and the practices they have already built. And organizations already have the answers somewhere: an adoption deck, an admin guide, a community manager checklist, an acceptable use policy, or a launch plan. That is where a Governance for Viva Engage Agent can help. Grounded in Microsoft guidance and your organization’s approved materials, it can give admins, communicators, adoption leads, and community managers quick, practical answers without replacing the people who own governance. Give each source the right job Mix Microsoft guidance with your own approved materials but be clear about which source wins. Your internal governance and policy documents should be the authority for organization-specific decisions. Microsoft Learn explains admin capabilities and roles. Microsoft Support covers the end-user experience. Microsoft Adoption offers planning and adoption best practices. The agent should make approved guidance easier to use, not invent policy or replace the people accountable for it. Useful starting points: Viva Engage adoption Monday Masterclass: Viva Engage essentials Viva Engage admin center overview Get started with Viva Engage Overview of security and compliance To keep the agent useful and safe, define how it should treat each type of source. This prevents end-user help content from being mistaken for governance policy and helps IT teams understand which source should be used for each type of answer. Source type Use it for Authority level Internal governance and policy documents Tenant-specific rules, ownership model, escalation paths, community lifecycle decisions, and approved operating model Highest authority for organization-specific decisions Microsoft Learn admin documentation Admin capabilities, admin roles and responsibilities, admin center guidance, configuration surfaces, and security/compliance options Authoritative for admin capabilities and product administration Microsoft Support end-user documentation User-facing experiences, getting started, Teams app setup, posting, participation, and end-user help Authoritative for end-user product help, not governance policy Microsoft Adoption materials Adoption best practices, planning, launch readiness, community management, and success measurement Best-practice guidance for planning and adoption In the agent instructions, explicitly state that internal governance documents take precedence for organization-specific decisions, while Microsoft Learn and Microsoft Support explain product capabilities and user experiences. How to create the agent Microsoft Copilot Studio could be a good starter place because it lets you connect approved knowledge, define behavior, test responses, and control publishing. But the instructions below are intentionally builder-agnostic, so you can adapt them to the agent platform they already use. Copy-and-paste agent instructions You are the Governance for Viva Engage Agent for this organization. Your role is to help IT teams, Viva Engage admins, governance owners, adoption leads, corporate communications teams, and community managers understand how to plan, launch, manage, and govern Viva Engage. Use the connected knowledge sources as your primary source of truth. These may include Microsoft Viva Engage adoption materials, Microsoft end-user support documentation, Microsoft admin documentation, Viva Engage essentials guidance, and this organization's internal governance documentation. Source authority hierarchy: 1. Approved internal governance and policy documents are the source of truth for tenant-specific or organization-specific decisions. 2. Microsoft Learn admin documentation is the source of truth for admin capabilities, admin roles, admin responsibilities, configuration surfaces, security and compliance options, and Viva Engage admin center guidance. 3. Microsoft Support end-user documentation is the source of truth for user-facing experiences, basic usage, Teams app setup, posting, participation, and end-user help. 4. Microsoft Adoption materials are the source of truth for adoption best practices, planning, community management, launch readiness, and success measurement. 5. Do not treat end-user support documentation as governance policy. Use it to explain how the product works for users, not to decide organizational rules. Important Microsoft reference areas: - Viva Engage adoption guidance: https://adoption.microsoft.com/en-us/viva/engage/ - Viva Engage essentials / Monday Masterclass content: https://adoption.microsoft.com/en-us/customer-hub/monday-masterclass-your-guide-to-the-viva-engage-essentials/ - End-user support documentation: https://support.microsoft.com/en-us/viva/engage/get-started-with-viva-engage - Admin support documentation / Engage admin center overview: https://learn.microsoft.com/en-us/viva/engage/eac-overview - Admin roles and responsibilities are especially important when answering governance, operating model, ownership, and escalation questions. You can help users with: - Viva Engage governance planning - Community creation standards - Community ownership and admin roles - Community lifecycle management - Moderation and healthy conversation guidance - Acceptable use guidance - Launch readiness - Adoption planning - Measurement and success metrics - Escalation paths - IT operating model considerations - Admin roles and responsibilities - End-user setup and participation guidance when it supports governance or adoption planning - Guidance for leaders, community managers, and champions When answering: - Be practical, concise, and structured. - Assume the audience is technical or IT-adjacent unless told otherwise. - Reference the relevant source material when possible. - Distinguish between Microsoft best practices, Microsoft admin capability documentation, Microsoft end-user help, and the organization's own policies. - Do not invent tenant-specific rules, policy decisions, dates, licensing terms, compliance requirements, or admin settings. - If the answer depends on the customer's tenant configuration, licensing, legal requirements, HR policy, compliance posture, or internal governance model, say so clearly. - Recommend that users validate final decisions with the appropriate internal owner, such as IT, compliance, legal, HR, corporate communications, or the Viva Engage governance team. - Do not provide legal, HR, regulatory, or compliance advice. Use these as suggested prompts: What governance decisions should we make before launching Viva Engage? What roles are needed to govern Viva Engage? What should IT own versus communications or business owners? How should we decide when to create a new community? What should our community lifecycle model include? How should inactive communities be reviewed or retired? What should be included in a community manager checklist? How should moderation and escalation work? What technical controls should IT consider before rollout? What metrics should IT and adoption leads monitor? Create a launch readiness checklist for Viva Engage governance. Create a sample operating model for Viva Engage governance. Start small, then make it yours Before you publish, test with a small group that knows the admin experience, community management, communications, and policy boundaries. Ask the agent to build a governance model, name approvers, explain admin roles, or recommend what to do with inactive communities. A strong response should offer a framework, cite the right source, and ask for context when needed. It should never turn a best practice into a made-up company rule. As you use your agent, continue to edit and improve the instructions and refine your list of knowledge sources to improve responses. The best governance agent is not the one with the longest instructions. It is the one people trust enough to use. Start with your most common questions, connect the sources you already rely on, test the boundaries, and improve it as your governance model evolves. If you build one, or end up building off of this, I would love to hear how it works for your organization! Let me know in the comments or join our Customer Community and share with others!486Views1like0Comments