best practices
120 TopicsBeyond One-Size-Fits-All: Decision Routing for GitHub Copilot in CLI & VS Code
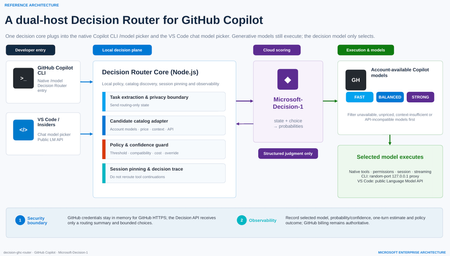
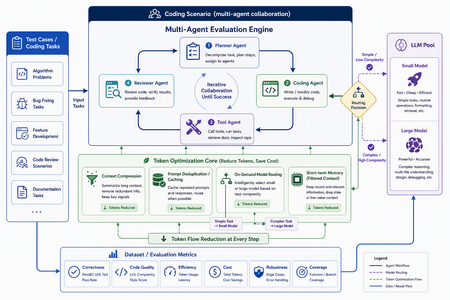
As developer tools move into the age of agentic AI, it is easy to fall into a familiar habit: when a task matters, choose the strongest—and usually most expensive—model available. Real software work is more varied than that. Explaining a function, editing a README, adding a boundary test, debugging a cross-module race condition and reviewing authentication logic demand very different levels of reasoning, context, tool use and reliability. A fixed model for every turn either wastes latency and budget or leaves difficult tasks underpowered. That is the motivation behind decision-ghc-router: GitHub Copilot continues to execute, while a Decision Router selects a sufficiently reliable and economically sensible model at the start of each new user turn. (The design also draws on gargpratyush/jev-router, especially its per-turn routing, native CLI preservation and model pinning across tool continuations.) The goal is not to build another agent outside Copilot or replace the native developer experience with a custom chat UI. GitHub Copilot CLI and the VS Code GitHub Copilot extension should keep their existing authentication, model catalog, tools, permissions, sessions and streaming behavior. The router adds one short, explicit decision step—and then gets out of the way. 1. Start with the distinction: a Decision Model is not a Model Router Before discussing implementation, two frequently conflated concepts need to be separated. A Decision Model makes bounded, structured judgments A Decision Model is not prompted with “write an article.” It receives: a current state, expressed as text or JSON; one or more bounded questions; explicit options or grading criteria. It returns typed results and probabilities that software can act on immediately, rather than free-form prose. For example: noul: Does this tool call touch production data? Return a probability between 0 and 1. choice: Should this task use the Fast, Balanced or Strong tier? Return the selected option and a probability for every option. score: How risky is this code change? Return an ordered score and its probability distribution. A Decision Model is therefore a fast, calibratable judgment primitive. Its uses extend beyond model selection to classification, ranking, prioritization, validation, agent control, safety screening and AI judging. A Model Router turns judgment into execution A Model Router is a system pattern, not a single model. A production-ready router must typically: discover models actually available to the signed-in account; reject candidates that are unavailable, unpriced, context-insufficient or API-incompatible; build a minimal routing state; invoke a scorer—which might be rules, a benchmark table, an LLM classifier or a Decision Model; apply confidence, cost, latency, safety and organizational policy; select a concrete model and start native execution; pin that model across tool continuations; emit decisions, estimates and failures for audit and tuning. In short: The Decision Model judges what is most suitable. The Model Router makes that judgment usable, compliant, executable, observable and recoverable. A Decision Router does not replace the larger routing system. It gives that system a specialized, fast and threshold-friendly scoring engine. Decision Model versus Model Router Dimension Decision Model Model Router Nature Specialized model capability Application or platform architecture pattern Input State, bounded questions, options or grading criteria User task, account catalog, prices, context limits and policy Output Typed answer and probabilities Concrete model, execution path, policy outcome and telemetry Content generation Does not produce free-form content Usually dispatches a generative model Account entitlement Not responsible Responsible API compatibility Not responsible Responsible Failure handling Provides uncertainty Must define fallback or stop behavior Broader use Classification, scoring, routing and validation Multi-model orchestration, cost governance and runtime control 2. Microsoft-Decision-1: why it fits developer-tool routing Microsoft introduced Microsoft-Decision-1 in October 2026 as a specialized model for fast decision scoring, available through Microsoft Foundry. Unlike a generative LLM, it does not produce an essay or a written chain of reasoning. It makes a focused judgment about text or JSON and returns typed numerical decisions. Microsoft describes the model as a post-trained Qwen3.5-9B designed for single-pass scoring over fixed options. It reports the highest accuracy in a 36-benchmark comparison spanning nearly 150,000 questions kept blind from training, P50 latency roughly 35 times faster than GPT-6 Sol, and an average 1.3% decision-flip rate across eight perturbation types. At launch, Microsoft listed input at US$0.042 per million tokens with no output-token charge; pricing is dynamic, so a deployment should use the current Microsoft Foundry listing. Those are Microsoft-published benchmark results, not a substitute for evaluation on a team’s own development workload. Microsoft-Decision-1 exposes three question types that map naturally to an AI control plane: noul for binary gates such as “May this command run automatically?” choice for bounded routing such as “Which model tier should handle this turn?” score for ordered grading such as “How severe is the change risk?” Why not use a small LLM classifier? That is a valid architecture. Many model routers ask a lightweight LLM to emit easy, medium or hard. GitHub Agentic Workflows’ experimental model routing also classifies a task before ranking allowed model-and-effort combinations through precompiled routing tables. A dedicated Decision Model, however, offers four useful properties for developer tools: Bounded output. A router needs a label and probabilities, not persuasive prose. Predictable latency. Agent workflows amplify the cost of every sequential control-plane call. Policy-ready confidence. If the top probability is below 0.65, a local policy can avoid downgrading, keep the current model or request manual selection. Composable governance. One structured request can score model tier, operational risk and the need for human review. A conceptual choice request for Copilot routing The following is simplified pseudodata—not repository source—and omits deployment and authentication details: { "state": { "task": "Fix intermittent failures in the authentication integration tests", "estimatedContextTokens": 18000, "toolUseExpected": true, "workspaceScope": "multi-file", "latencyPreference": "balanced" }, "questions": { "model_tier": { "type": "choice", "instructions": "Choose the least expensive tier likely to complete the task reliably in one pass.", "criteria": { "fast": "Simple explanation, formatting, lookup, or small deterministic edit", "balanced": "Normal coding, tests, debugging, or limited multi-file work", "strong": "Ambiguous architecture, security, difficult debugging, or broad multi-file reasoning" } } } } The response identifies a tier and assigns a probability to every tier. The router then maps the abstract choice to a concrete model that is truly available to the current GitHub account. That separation matters: a Decision Model should not assume that a user owns or can access a particular model. The account catalog is the source of truth. 3. The decision-ghc-router scenario and reference architecture The architecture has two hosts but one consistent decision model. 3.1 GitHub Copilot CLI: put the router in native /model In the public predecessor implementation, a user-level extension adds a router entry to GitHub Copilot CLI’s native /model menu. The user can select the router or choose a concrete model directly: Select Decision Router: route every new user turn. Select a concrete model: bypass routing and return to native fixed-model behavior. Continue a tool call: keep the model chosen for that turn; do not classify again. Explicitly request a model: the explicit request should win. The CLI path uses a random-port 127.0.0.1 proxy to expose the router as a temporary provider while preserving Copilot authentication, sessions, tools, permissions and streaming. GitHub credentials should remain in memory and be used only for HTTPS requests to GitHub. The local proxy uses separate random credentials; GitHub credentials must not be written to logs or sent to the Decision API. This is the design principle I care about most: The router changes which model is selected, not how Copilot works. 3.2 VS Code and VS Code Insiders: enter the Chat Model Picker The editor integration is a separate extension. It registers decision-router in VS Code Chat’s model picker and uses the public Language Model API to discover Copilot models available to the account signed into that editor. The privacy boundary is intentional: The Decision Model receives an unambiguously extracted task or a routing-only summary entered by the user. If the task cannot be reliably isolated from editor context, the extension should not automatically upload attachments, source files or the full conversation. The selected Copilot model still receives the full conversation, tool definitions and workspace context. VS Code invokes native tools, while tool-call IDs maintain model consistency. The short version is: minimize data for decision; maximize context for execution. 3.3 The seven-step loop for each new user turn Receive the task through native Copilot CLI or VS Code Chat. Discover candidates from account models, prices, context capabilities and API compatibility. Build routing state with the minimum sufficient task summary and bounded choices. Call Microsoft-Decision-1 and receive choice probabilities. Apply local policy for confidence, cost, compatibility and manual overrides. Execute natively with the selected model, existing tools, permissions, session and streaming. Pin and trace the model for tool continuations while recording the decision and estimate. 3.4 Why not reroute every tool continuation? Imagine a model runs tests, reads the failure output and then edits code. If the router chooses a new model after every tool result: prompt-cache benefits may disappear, increasing total cost; the new model may interpret earlier tool calls differently; the debugging chain becomes harder to reproduce and audit. I therefore retain one of jev-router’s strongest ideas: make one decision at the start of a new user turn, then pin that model for the resulting tool chain. Main conversations and sub-agents should be pinned independently. 4. Main technologies and frameworks Based on mechanisms verifiable in the public predecessor and the Microsoft-Decision-1 evolution described here, the project separates into the following layers. Node.js and ESM modules The core router uses Node.js and .mjs modules to handle: CLI startup and argument forwarding; model catalog and price adaptation; the local HTTP proxy; configuration and environment variables; Decision API calls; policy, errors and telemetry. The public predecessor requires Node.js 22.16 or later and uses Microsoft’s npm package source for relevant dependencies. GitHub Copilot CLI extension interfaces The CLI integration relies on experimental extension interfaces to register the router as a native model entry. It explicitly enables the provider-endpoint interface and obtains the model catalog, runtime inference endpoint and authentication from the active session. Three rules are essential: Do not modify the user’s global default model. Do not automatically grant shell or other tool permissions. If initialization fails, report a clear error instead of pretending routing succeeded. Local loopback proxy The loopback proxy is the adapter that preserves the native CLI: listen only on 127.0.0.1; use a random port and random local credentials; map the router’s selection to a real Copilot execution model; preserve streaming, tool calls, sessions and permission prompts; never create a second hidden agent loop. VS Code Extension API The editor extension discovers current candidates through: vscode.lm.selectChatModels({ vendor: "copilot" }) and is packaged as a VSIX. The CLI and editor are independent hosts and may use different GitHub accounts with different entitlements. Candidate discovery must therefore be host-specific, session-specific and dynamic—not a hardcoded list of model IDs. Microsoft Foundry and the Decision API Microsoft-Decision-1 can be deployed in Microsoft Foundry through GlobalStandard or, in selected regions, DataZoneStandard. Authentication can use Microsoft Entra ID (recommended) or an API key. In this architecture, the Decision API only scores choices: Input: minimal task state, bounded candidates and explicit criteria. Output: selected option, option probabilities and usage. Not its responsibility: GitHub credentials, developer tools, full workspace access or code execution. That separation makes the decision plane and execution plane independently governable. Model catalog, pricing and capability adapters The public predecessor discovers models from the signed-in account instead of hardcoding them. Before scoring, a router should exclude: auto, hidden, disabled or unconfigured entries; models without usable price information; candidates with insufficient input context; models incompatible with the host’s wire API; models restricted by administrator policy. Cost estimation supports ranking and user feedback; it is not a final bill. Promotions, cache discounts, hidden context, retries and later tool rounds all affect the result. GitHub Billing remains authoritative. 5. What I borrow from jev-router—and what changes The value of gargpratyush/jev-router is not merely “use a small model for easy tasks.” It embeds routing into familiar CLIs without taking away their native behavior. The ideas I retain include: one routing decision per new user turn; a router sentinel in the native model picker; concrete-model selection pauses routing; abstract Fast, Balanced, Strong and Long tiers map to host-specific models; tool continuations keep the tier selected at the start of the turn; explicit model requests win; low confidence should not trigger an aggressive downgrade; large conversations must account for cache and migration cost; explanation data should show why a tier was selected. The decision-ghc-router evolution replaces the external JEV/System One scorer with Microsoft-Decision-1 and emphasizes five changes: Probability is a first-class signal. Policy can threshold the decision instead of accepting a label blindly. Bounded choices come from the real catalog. Decision-1 only chooses among already eligible candidates. Local policy owns the final answer. Organizational rules, compatibility and manual overrides remain deterministic. The Decision Model is reusable. A single structured call can also score operational risk and the need for human review. Local and cloud responsibilities are explicit. Cloud scoring is isolated from credentials and execution. 6. Representative use cases A. Fast explanation and small edits “Explain this regular expression,” “turn this note into a table,” or “add a null-value test to an existing function.” The router can often select the Fast tier. The objective is not the weakest model; it is the least expensive model likely to complete the task reliably in one pass. B. Normal development and debugging “Fix the failing test,” “refactor this module without changing its API,” or “use the stack trace to locate the bug.” These tasks require code reading, tool use and moderate reasoning, so they often land in Balanced. C. Security, architecture and broad multi-file reasoning “Review this OAuth callback for state confusion,” “design cross-region failover,” or “find a race condition across services.” The router should choose Strong even when it costs more. Routing optimization means “economical subject to reliable completion,” not “always cheaper.” D. Long context and large repositories If a candidate cannot hold the estimated input, it must be removed before scoring. For an already large conversation, the router should also avoid downgrading when lost cache work or context migration would cost more than the model-price saving. E. Organizational policy and risk gates The same Decision API request can include additional noul or score questions: Does the task involve production data? Is the proposed command destructive? What is the security risk level of the change? Should execution be handed to a human reviewer? At that point the router grows from a cost optimizer into a lightweight control plane for agents. 7. Policies I would keep for production Filter deterministically before scoring Entitlement, API compatibility, context limits and administrator restrictions are facts. The Decision Model should not be asked to guess them. Do not automatically downgrade on low confidence When the top probability falls below a calibrated threshold, the router can: keep the current model; cap automatic movement at Balanced; request manual selection; send high-risk tasks to Strong or human review. The threshold must be calibrated on labeled tasks from the target environment, not copied from an example. Explicit intent beats automatic routing If the user says “use the Strong model” or selects a concrete entry in the picker, the router should step aside immediately. Never substitute silently Missing credentials, Decision API timeouts, unknown pricing and insufficient context should produce an explicit state. Whether to fail open, fail closed or keep the current model must be an intentional host or organizational policy. Record decisions without logging every prompt by default Useful telemetry includes: anonymized session and turn IDs; candidates and exclusion reasons; selected tier, probabilities and policy overrides; estimated input/output and one-turn cost; completion, retry and manual-reselection outcomes. Full prompts, source code and tool results should be excluded by default or governed by explicit retention and data-handling policy. Evaluate the router on task success, not the cheapest request Better metrics include: first-pass completion rate; total time to completion; total cost including retries and tool rounds; manual model-change rate; low-confidence and misrouting rates; safety and policy violations. 8. Why this matters beyond one repository From a developer-advocacy perspective, the Decision Router is not simply a token-saving utility. It illustrates a clearer division of responsibilities in agent engineering: Generative models understand, reason, write code and call tools. Decision Models make fast, structured and probabilistic judgments. Routers and policy engines place those judgments inside real account, budget, compatibility and governance constraints. Developer-tool hosts retain identity, permission, context and execution control. Future AI developer tools will not be tied to one “default large model.” They will manage a portfolio of models with different speed, cost, context and capability profiles. The differentiator will no longer be merely which model a product connects to, but: Can it select the right model at the right moment, in an explainable and governable way, without breaking the developer experience? That is why I am adding a Decision Router to GitHub Copilot CLI and the VS Code GitHub Copilot extension. GitHub Copilot keeps executing. Microsoft-Decision-1 makes the fast judgment. The local router turns that judgment into a usable engineering decision. References decision-ghc-router jev-ghc-router gargpratyush/jev-router Microsoft-Decision-1: Our model for fast decision-making Deploy and use Microsoft-Decision-1 in Microsoft Foundry GitHub Agentic Workflows — Model Routing GitHub Copilot model billing and pricing424Views0likes0CommentsSending Email from an AKS Pod Without a Single Secret
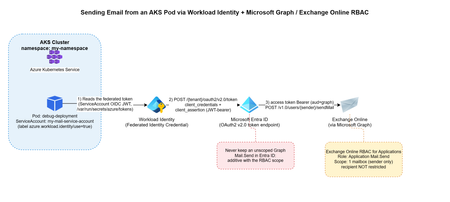
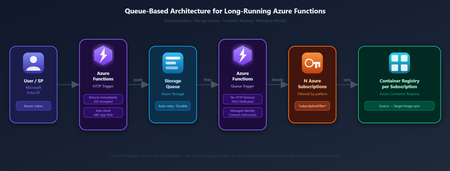
The problem You have a workload running in AKS that occasionally needs to send an email — a notification, an alert, a report. The obvious options all come with baggage: An SMTP relay means yet another credential to store, rotate, and eventually leak. A shared "app password" mailbox account means an identity nobody really owns, that can authenticate as itself forever. Granting Mail.Send as a Microsoft Graph application permission is tempting — until you realize it lets your app send email as any mailbox in the entire tenant, not just the one you intended. This post walks through a pattern that avoids all three: Azure Workload Identity for the pod, Microsoft Graph for sending, and Exchange Online RBAC for Applications to scope the identity down to exactly one authorized mailbox. No secrets stored anywhere in the cluster, and no tenant-wide send permission. Architecture Pod (AKS) -- federated OIDC token --> Workload Identity Workload Identity -- client_credentials + client_assertion--> Microsoft Entra ID Entra ID -- access token (aud=Graph) --> Pod Pod -- POST /v1.0/users/{sender}/sendMail (Bearer token)--> Microsoft Graph --> Exchange Online The pod never handles a password or a client secret. It reads a federated identity token that Azure Workload Identity's webhook mounts automatically, exchanges it with Entra ID for a Graph access token, and calls sendMail directly. The only thing that determines which mailbox it's allowed to send as is a role assignment on the Exchange Online side — not anything configured in Kubernetes. Step 1 — Get a Workload Identity bound to your namespace This is a platform-team request, not something you self-service from inside the cluster: you need a Managed Identity (or App Registration) with a Federated Identity Credential issued for your specific Kubernetes namespace and ServiceAccount subject. Give your platform/identity team: The target namespace (e.g. my-namespace) The target ServiceAccount name (e.g. my-mail-service-account) The intended use case (application email via Microsoft Graph) They hand you back a Client ID — that's all your manifest needs. One important thing to not ask for: don't request the Graph Mail.Send application permission on this identity. That permission, if granted directly in Entra ID, is unscoped — it lets the identity send as anyone. The actual sending restriction is going to live in Exchange, not in Entra ID (see Step 2). Step 2 — Restrict sending to one mailbox with Exchange Online RBAC for Applications Microsoft's currently recommended way to scope application email-sending rights is RBAC for Applications in Exchange Online — the modern replacement for the deprecated Application Access Policies. The short version: The Managed Identity gets no unscoped Graph Mail.Send grant in Entra ID. (Entra ID and Exchange RBAC authorizations are additive — if you leave an unscoped grant in place, it defeats the whole point.) Exchange Online registers a pointer to the Managed Identity's service principal (New-ServicePrincipal), then assigns it the Application Mail.Send role, scoped to a Management Scope that resolves to exactly one mailbox (or one security group of mailboxes). The identity can now call /users/{authorized-mailbox}/sendMail and get a 202. Any other mailbox returns 403. This part is usually owned by whoever administers your Exchange Online tenant, not by the application team — it's a five-minute PowerShell runbook for them (New-ManagementScope, New-ServicePrincipal, New-ManagementRoleAssignment), fully documented in Microsoft's RBAC for Applications docs. For reference, here's the actual runbook: # 0. Make sure no unscoped Graph Mail.Send grant exists on the identity first $mi = Get-EntraServicePrincipal -ServicePrincipalId $MiObjectId $graphSp = Get-EntraServicePrincipal -Filter "appId eq '00000003-0000-0000-c000-000000000000'" $mailSendRole = $graphSp.AppRoles | Where-Object { $_.Value -eq "Mail.Send" -and $_.AllowedMemberTypes -contains "Application" } Get-EntraServicePrincipalAppRoleAssignment -ServicePrincipalId $mi.Id | Where-Object { $_.ResourceId -eq $graphSp.Id -and $_.AppRoleId -eq $mailSendRole.Id } | ForEach-Object { Remove-EntraServicePrincipalAppRoleAssignment -ServicePrincipalId $mi.Id -AppRoleAssignmentId $_.Id } # 1. Connect to Exchange Online Connect-ExchangeOnline # 2. Scope to exactly one mailbox (filter on ExternalDirectoryObjectId, not SMTP address) $mbx = Get-EXORecipient -Identity $AllowedMailbox -Properties ExternalDirectoryObjectId New-ManagementScope -Name $ScopeName ` -RecipientRestrictionFilter "ExternalDirectoryObjectId -eq '$($mbx.ExternalDirectoryObjectId)'" # 3. Register the service principal pointer (this is NOT a new identity, just a reference) $exoSp = New-ServicePrincipal -AppId $MiAppId -ObjectId $MiObjectId -DisplayName $MiDisplayName # 4. Assign exclusively Application Mail.Send, scoped New-ManagementRoleAssignment -Name $AssignmentName ` -App $exoSp.ObjectId -Role "Application Mail.Send" -CustomResourceScope $ScopeName # 5. Validate both directions Test-ServicePrincipalAuthorization -Identity $exoSp.ObjectId -Resource $AllowedMailbox # expect InScope = True Test-ServicePrincipalAuthorization -Identity $exoSp.ObjectId -Resource $BlockedMailbox # expect InScope = False Two things that trip people up here: -App in step 3/4 expects the Object ID of the Enterprise application / service principal, not the App Registration object — and never fall back to Application Mail Full Access or an exclusive management scope, since Microsoft explicitly notes exclusive scopes don't restrict application access. Worth calling out explicitly: this RBAC scope restricts the sender only. It has no concept of a recipient allowlist. Once your identity is authorized to send as a mailbox, it can send to anyone, inside or outside your tenant. If you need recipient-side restrictions, that has to be application logic — Exchange RBAC won't do it for you. Step 3 — The Kubernetes manifest Three resources: a ServiceAccount annotated with the Client ID from Step 1, a ConfigMap holding the send script, and a Deployment that mounts it. Here's the complete manifest: --- apiVersion: v1 kind: ServiceAccount metadata: annotations: azure.workload.identity/client-id: <CLIENT-ID-FROM-YOUR-IDENTITY-TEAM> name: my-mail-service-account namespace: my-namespace --- apiVersion: v1 kind: ConfigMap metadata: name: send-email namespace: my-namespace data: send-email.sh: | #!/bin/bash set -euo pipefail if [ $# -lt 2 ]; then echo "Usage: $0 <sender-email> <recipient-email> [recipient-email...]" exit 1 fi SENDER_EMAIL="$1" shift RECIPIENTS=("$@") TENANT_ID="${AZURE_TENANT_ID:-}" CLIENT_ID="${AZURE_CLIENT_ID:-}" FEDERATED_TOKEN_FILE="${AZURE_FEDERATED_TOKEN_FILE:-}" if [ -z "$TENANT_ID" ] || [ -z "$CLIENT_ID" ] || [ -z "$FEDERATED_TOKEN_FILE" ]; then echo "ERROR: Workload Identity variables not set" exit 1 fi FEDERATED_TOKEN=$(cat "$FEDERATED_TOKEN_FILE") TOKEN_RESPONSE=$(curl -s -X POST \ "https://login.microsoftonline.com/${TENANT_ID}/oauth2/v2.0/token" \ -H "Content-Type: application/x-www-form-urlencoded" \ -d "client_id=${CLIENT_ID}" \ -d "scope=https://graph.microsoft.com/.default" \ -d "client_assertion_type=urn:ietf:params:oauth:client-assertion-type:jwt-bearer" \ -d "client_assertion=${FEDERATED_TOKEN}" \ -d "grant_type=client_credentials") ACCESS_TOKEN=$(echo "$TOKEN_RESPONSE" | grep -o '"access_token":"[^"]*' | cut -d'"' -f4) if [ -z "$ACCESS_TOKEN" ]; then echo "ERROR: Failed to get token" echo "$TOKEN_RESPONSE" exit 1 fi RECIPIENTS_JSON="" for r in "${RECIPIENTS[@]}"; do if [ -n "$RECIPIENTS_JSON" ]; then RECIPIENTS_JSON="${RECIPIENTS_JSON}," fi RECIPIENTS_JSON="${RECIPIENTS_JSON}{\"emailAddress\":{\"address\":\"${r}\"}}" done cat > /tmp/email.json <<EOF { "message": { "subject": "Test from AKS", "body": { "contentType": "Text", "content": "Test email from Workload Identity" }, "toRecipients": [${RECIPIENTS_JSON}] }, "saveToSentItems": "true" } EOF HTTP_CODE=$(curl -s -w "%{http_code}" -o /tmp/response.json \ -X POST "https://graph.microsoft.com/v1.0/users/${SENDER_EMAIL}/sendMail" \ -H "Authorization: Bearer ${ACCESS_TOKEN}" \ -H "Content-Type: application/json" \ -d @/tmp/email.json) if [ "$HTTP_CODE" -eq 202 ]; then echo "Email sent successfully" else echo "ERROR: HTTP ${HTTP_CODE}" cat /tmp/response.json exit 1 fi --- apiVersion: apps/v1 kind: Deployment metadata: name: debug-deployment namespace: my-namespace labels: app: debug azure.workload.identity/use: "true" # Required. Only pods with this label can use workload identity. spec: replicas: 1 selector: matchLabels: app: debug template: metadata: labels: app: debug azure.workload.identity/use: "true" # Required. Only pods with this label can use workload identity. spec: serviceAccount: my-mail-service-account serviceAccountName: my-mail-service-account containers: - name: debug image: <your-registry>/az-init:0.1 command: ["sleep", "3600"] readinessProbe: exec: command: ["ls"] livenessProbe: exec: command: ["ls"] resources: requests: memory: "256Mi" cpu: "250m" limits: memory: "512Mi" cpu: "500m" volumeMounts: - name: script mountPath: "/script" volumes: - name: script configMap: name: send-email defaultMode: 0555 Two details that will bite you if you skip them: /me/sendMail doesn't work here. In a client_credentials flow (app-only, no signed-in user), /me returns 400 BadRequest: /me request is only valid with delegated authentication flow. You must call /users/{sender}/sendMail and name the sender explicitly. configMap.defaultMode matters. 0500 only grants execute to the file's owner (root); if your container runs as non-root, you'll get a Permission denied on exec. Use 0555. Step 4 — Test it kubectl apply -f email-pod.yaml kubectl exec -n my-namespace -it deploy/debug-deployment -- \ /script/send-email.sh authorized-sender@yourcompany.com \ recipient1@yourcompany.com recipient2@yourcompany.com A 202 and Email sent successfully means it worked. Try it again with a sender mailbox that isn't in your RBAC scope — you should get a clean 403. If you don't, go back and check that no unscoped Graph Mail.Send grant is still sitting on the identity in Entra ID; that's the most common way this containment silently fails. Conclusion This solution addresses an application email-sending need without introducing static credentials into the cluster or broadening permissions beyond what is strictly necessary. Full cloud, with no on-premises dependency or manually managed secret: No password, API key, or certificate is stored in Kubernetes (Secret, ConfigMap, or anywhere else). Authentication relies entirely on OIDC federation between the Kubernetes ServiceAccount and Microsoft Entra ID (Workload Identity) — the federated token is issued and mounted automatically by the webhook, never manually generated or distributed. The entire authentication and sending chain (Entra ID, Microsoft Graph, Exchange Online) goes through Microsoft-managed HTTPS endpoints; no on-premises component is involved in the application path (section A.3 covers a pitfall related to Exchange hybrid setups on the target mailbox side, not the authentication path itself). Provisioning the sender mailbox and the RBAC configuration are themselves managed natively within Microsoft 365 / Exchange Online, with no extra script or infrastructure to maintain on the client side. Secure by design (least privilege): The OIDC federated token is short-lived (limited lifetime, automatically renewed by the webhook) and scoped to the my-mail-service-account ServiceAccount in the my-namespace namespace — it cannot be reused outside this specific context. No tenant-wide Microsoft Graph Mail.Send permission is granted to the identity: without this precaution, the identity could send as any mailbox in the tenant. Exchange Online RBAC for Applications carries the real authorization, strictly scoped to the mailboxes that are members of the dedicated Exchange group. The containment is verified both positively and negatively before going to production — not only tested on the case that must succeed. Known and documented limitation: this RBAC model restricts only the sender, never the recipient — application-side control is still required if recipient restriction is ever needed. See You in the Cloud JamesdldDistributing Agents to Microsoft Teams and Microsoft 365 Copilot Part 4/5
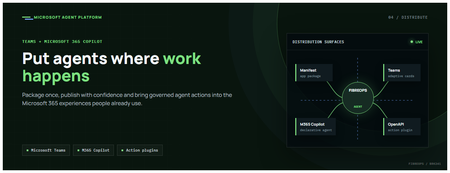
This is the fourth post in our series on the Microsoft agent platform. We cover the Distribute in M365 pillar — publishing your agents to Microsoft Teams and Microsoft 365 Copilot so they reach users where they already work. All examples reference the FibreOps repository, demonstrated at Microsoft Build BRK241. The Distribution Story Building a great agent is only half the challenge. The other half is getting it into the hands of users without asking them to learn a new tool, visit a new URL, or change their workflow. Microsoft 365 Copilot and Microsoft Teams are where enterprise users already spend their day, making them the natural distribution surface for agents. With the GA release, publishing an agent to Teams and M365 Copilot is a single command. No separate app registration portal, no manual manifest assembly, no multi-step approval workflow for development and testing. Publishing to Microsoft 365 Copilot (GA) FibreOps ships as a declarative agent + action plugin ready for sideload. A single CLI command produces the complete package: python -m fibreops.demo publish-m365 --out dist/m365 # Output: # ✓ wrote dist/m365/declarativeAgent.json # ✓ wrote dist/m365/fibreops-action.json # ✓ wrote dist/m365/manifest.json # ✓ wrote dist/m365/color.png (192x192) # ✓ wrote dist/m365/outline.png ( 32x32) # ✓ wrote dist/m365/fibreops-copilot.zip What Gets Generated File Purpose declarativeAgent.json Defines the agent's persona, capabilities, and conversation starters for M365 Copilot fibreops-action.json Action plugin that proxies tool calls to the deployed FastAPI backend via OpenAPI manifest.json Teams app manifest with publisher metadata, permissions, and capabilities color.png / outline.png App icons for Teams and M365 surfaces fibreops-copilot.zip Ready-to-upload package for Teams Admin Center Configuration Set the base URL to your deployed FastAPI app before publishing — the action plugin uses this to resolve the OpenAPI runtime: # Set the public HTTPS hostname of the deployed FastAPI app $env:M365_ACTION_BASE_URL = "https://fibreops-demo.azurewebsites.net" # Optional: customise publisher metadata $env:M365_PUBLISHER_NAME = "Contoso Network Operations" $env:M365_PUBLISHER_WEBSITE = "https://contoso.com/noc" # Generate the package python -m fibreops.demo publish-m365 --out dist/m365 Environment Variable Purpose M365_ACTION_BASE_URL Public HTTPS root for the FastAPI /openapi.json (e.g., Container Apps FQDN) M365_APP_ID Override the generated Teams app GUID (default: deterministic per repo) M365_PUBLISHER_NAME Publisher name shown in M365 Admin Center M365_PUBLISHER_WEBSITE Publisher website link Uploading the Package Upload the generated fibreops-copilot.zip through either path: Teams Admin Center → Manage apps → Upload new app M365 Admin Center → Integrated apps → Upload custom apps Once uploaded, the declarative agent: Inherits the publisher metadata you configured Advertises conversation starters from the FibreOps deck (e.g., "What is the current outage status?", "Dispatch an engineer to FN-LDN-001") Proxies tool calls to the deployed FastAPI app via the action plugin Appears in Microsoft 365 Copilot as a specialised agent users can invoke How Declarative Agents Work A declarative agent in Microsoft 365 Copilot is defined by metadata rather than code running in the M365 surface. The intelligence lives in your backend — Copilot handles the conversational UX, tool orchestration schema, and user authentication. The flow: User invokes the agent in Microsoft 365 Copilot or Teams Copilot renders conversation starters and accepts natural language input When the agent needs to act, Copilot calls the action plugin (your OpenAPI endpoint) Your FastAPI backend processes the request using the full agent pipeline Results return to the user in the Copilot/Teams UX This architecture means your agent logic stays in one place — the backend. The M365 surface is purely a distribution and interaction layer. Action Plugins and OpenAPI The action plugin ( fibreops-action.json ) references your FastAPI app's /openapi.json endpoint. FibreOps exposes a JSON API that the action plugin can call: /api/runs — List and query agent runs /api/optimiser — Get optimizer scores and suggestions /sdk/chat — Natural language interaction with the agent system /healthz — Liveness probe Because FastAPI auto-generates OpenAPI schemas from your typed Python endpoints, the action plugin gets accurate parameter descriptions, response schemas, and error codes without any manual specification work. Publishing as Autopilots (Public Preview) Autopilots take distribution one step further — agents that operate autonomously without requiring a user to initiate each interaction. An Autopilot can: React to events (e.g., a critical telemetry signal) without human initiation Take actions within defined guardrails Notify users only when human intervention is needed Operate continuously across Microsoft 365 surfaces For FibreOps, an Autopilot would monitor the Event Hub stream continuously and only surface to the NOC team when an incident exceeds automated resolution capability — a fully autonomous operations agent. Teams Adaptive Cards FibreOps posts rich Adaptive Card notifications to Microsoft Teams throughout the agent pipeline. This is separate from the declarative agent — it is a push notification channel for real-time operational awareness. # The NetOps agent posts an outage notice via Incoming Webhook def post_outage_notice(incident_id, node_id, severity, summary, engineer=None): card = { "type": "AdaptiveCard", "body": [ {"type": "TextBlock", "text": f"🚨 Outage: {node_id}", "weight": "Bolder", "size": "Large"}, {"type": "FactSet", "facts": [ {"title": "Severity", "value": severity.upper()}, {"title": "Incident", "value": incident_id}, {"title": "Summary", "value": summary}, ]}, ], "actions": [ {"type": "Action.OpenUrl", "title": "View in NOC Console", "url": f"{base_url}/runs/{incident_id}"} ] } # POST to Teams webhook or append to outbox for offline mode ... If TEAMS_WEBHOOK_URL is not configured, cards are appended to state/teams_outbox.jsonl for review in the NOC console's Teams panel. End-to-End: From Code to Copilot Here is the complete flow from development to distribution: Build — Develop agents with Microsoft Agent Framework, test locally with python -m fibreops.demo --backend local Publish agents — python -m fibreops.demo publish creates hosted Prompt Agents in Foundry Deploy infrastructure — azd up provisions App Service, ACR, Event Hub, Key Vault, and Application Insights Deploy hosted agent — azd env set FIBREOPS_DEPLOY_HOSTED true && azd up Generate M365 package — python -m fibreops.demo publish-m365 --out dist/m365 Upload to Teams — Upload fibreops-copilot.zip via Teams Admin Center Users interact — The agent is now available in Microsoft 365 Copilot and Teams Security Considerations Managed Identity — The deployed app uses system-assigned managed identity for all Azure service access. No secrets in code. Least privilege — Each role grant is scoped to the minimum required (Event Hubs Data Owner, Key Vault Secrets User, AcrPull, Azure AI Developer). Authentication — The M365 Copilot surface handles user authentication; your backend receives authenticated requests. Guardrails — Autopilots operate within defined boundaries; human-in-the-loop escalation is built into the Routine and agent decision logic. Key Takeaways Publishing to Teams and M365 Copilot is GA — a single command generates the complete package. Declarative agents separate distribution (M365) from intelligence (your backend). Action plugins leverage your existing FastAPI OpenAPI schema — no manual specification needed. Autopilots (Public Preview) enable fully autonomous operation within guardrails. Adaptive Cards provide real-time push notifications alongside the conversational agent surface. The same backend serves the NOC console, the Copilot SDK, and the M365 declarative agent. Next Steps Explore the FibreOps repository — try python -m fibreops.demo publish-m365 Microsoft 365 Copilot extensibility documentation Next in this series: Voice Live and Observability for Production Agent SystemsBuilding and Deploying Microsoft Hosted Agents to Microsoft Teams
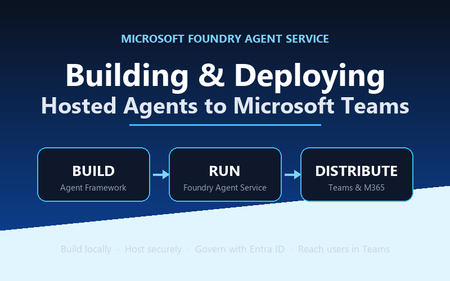
A practical, engineer-to-engineer guide to taking an AI agent from a developer laptop, into Microsoft Foundry Agent Service, and out to end users inside Microsoft Teams and Microsoft 365 — using the BRK241 FibreOps reference implementation as a worked example. Introduction: the hard part is no longer building the agent Two years ago, wiring an LLM to a couple of tools felt like the summit. It isn't any more. Frameworks, hosted models, and function-calling have made the build step almost routine. The problem has quietly moved downstream. The genuinely hard questions today are operational: Where does the agent run when it's no longer on your machine? What identity does it use to call enterprise systems, and who granted it? How does a platform team scale, monitor, and roll it back? How do business users actually reach it without learning a new tool? Who signed off on it touching production data? A prototype answers none of these. A production agent platform answers all of them, repeatably, for every agent an organisation ships. That shift — from a clever notebook to a governed, observable service that lands in the tools people already use — is the subject of this article. We'll use a single narrative to keep it concrete: FibreOps, the BRK241 "Autonomous Fibre Outage Response" system. It ingests optical line terminal (OLT) telemetry, analyses incidents, files tickets in Dynamics 365 Field Service, posts Adaptive Cards to Microsoft Teams, and dispatches engineers — all through role-specialised agents. The full source is on GitHub. The story runs on three verbs: Build → Run → Distribute. Section 1: Building the agent An agent is not one mega-prompt. FibreOps is deliberately factored into three role-specialised agents behind a single orchestrator, each with its own tool surface, its own system instructions, and a strict output contract: IncidentAnalysisAgent — classifies severity, finds probable cause, and pulls the correct standard operating procedure (SOP). NetOpsCoordinatorAgent — files the D365 incident and posts the Teams outage notice. FieldDispatchAgent — selects the best engineer by skill, region and shift, books the resource, and updates Teams. The Coordinator hands off to Dispatch with a literal HANDOFF:DISPATCH token rather than a fuzzy "I think we should…". Hard contracts between agents are how you stop them inventing work. Microsoft Agent Framework The agents are built with the Microsoft Agent Framework (MAF). The key design decision in the reference implementation is that all three backends honour one contract — await agent.run(prompt) -> response — so the orchestrator never knows or cares where reasoning actually happens: local — a deterministic LocalAgent shim with no LLM, so the demo runs with zero Azure credentials. foundry — agent_framework.Agent + FoundryChatClient , definition resolved locally. Ideal while iterating on prompts. hosted — agent_framework_foundry.FoundryAgent bound to a Prompt Agent published to Foundry Agent Service. This is the production path. Building a Foundry-backed agent is just a client plus instructions plus typed tools: from agent_framework import Agent from agent_framework_foundry import FoundryChatClient from azure.identity import DefaultAzureCredential client = FoundryChatClient( project_endpoint=settings.azure_ai_project_endpoint, model=settings.azure_ai_model_deployment, # e.g. gpt-4.1-mini credential=DefaultAzureCredential(), # no connection strings, ever ) agent = Agent( client=client, instructions=INCIDENT_ANALYSIS_INSTRUCTIONS_V1, name="IncidentAnalysisAgent", tools=[lookup_sop, recall, remember, web_iq_search, work_iq_search], ) Note the DefaultAzureCredential . There are no keys or connection strings anywhere in the reasoning path — identity flows from Microsoft Entra ID. Keep that in mind; it becomes the backbone of the governance story later. Tool calling and MCP Every tool is a typed Python function. Foundry sees the JSON schema derived from the signature; the runtime executes the Python. That separation matters: the published agent definition stores only the model and instructions, while the implementations are supplied by the runtime on every call. The same in-process tools (Teams, D365, dispatch, knowledge, memory) run identically whether the agent is local or hosted. Beyond your own functions, Foundry agents can draw on hosted toolbox tools ( web_search , code_interpreter ) and Model Context Protocol (MCP) servers. MCP is the open standard for exposing tools, resources and prompts to agents over a uniform protocol, so an enterprise can stand up an MCP server once and let every agent consume it. In FibreOps this is config-gated — set FIBREOPS_FOUNDRY_TOOLBOX=1 and the incident analyst gains live web search alongside its Web IQ / Work IQ connectors, with no code change. Grounding strategies FibreOps grounds reasoning three ways, in layers: Retrieval over owned knowledge — SOPs (markdown) and the fibre-node topology graph, looked up by the analysis agent. Foundry IQ — Web IQ for public context (roadworks, weather, power) and Work IQ for enterprise context (site surveys, SLA tiers, competency matrix). Procedural memory — prior incidents for a node, recalled before analysis so the agent learns from history. Crucially, when the IQ endpoints are unset the tools fall back to deterministic fixtures so the agent always grounds. Grounding that silently fails is worse than no grounding; design your fallbacks explicitly. Local development, testing and evaluation The whole system runs from one command with no cloud dependency: # Deterministic local backend — no Azure credentials required python -m fibreops.demo --signals 3 --backend local Every run is persisted as a JSON document — the input signal, every agent step, every tool call, every output, every ticket. That single artefact shape feeds three consumers: structured logs, the local optimiser, and Foundry Evaluators. The optimiser scores each run against a five-criterion rubric (was the analysis complete, was severity consistent with customer impact, did a ticket land, did dispatch policy match severity, was an SOP cited) and writes back concrete improvement suggestions. That evaluation loop — not the first working demo — is what turns a prototype into a system you can keep improving. Section 2: Deploying to Microsoft Foundry Agent Service Microsoft Foundry Agent Service is the managed runtime that hosts your agents. It gives you a secure, isolated execution environment, an agent runtime that speaks the OpenAI-compatible Responses API, plus hosted memory, toolboxes, knowledge integrations, and observability — without you operating any of it. FibreOps demonstrates the two hosting shapes Foundry offers. Shape 1 — Prompt Agents A Prompt Agent stores a model deployment plus system instructions as an immutable, versioned definition in Foundry. Publishing is a one-time step per change: from azure.ai.projects import AIProjectClient from azure.ai.projects.models import PromptAgentDefinition from azure.identity import DefaultAzureCredential pc = AIProjectClient(endpoint=endpoint, credential=DefaultAzureCredential(), allow_preview=True) pc.agents.create_version( agent_name="fibreops-incident-analysis", definition=PromptAgentDefinition( model=model_deployment, instructions=INCIDENT_ANALYSIS_INSTRUCTIONS_V1, ), description="FibreOps incident analysis agent", ) At run time you bind to the published version with a FoundryAgent , and — as noted above — the runtime supplies the tool implementations. Prompt versioning ( instructions_v1 , _v2 , _v3 ) is where the optimiser's suggestions land, closing the improvement loop inside the platform. Shape 2 — Containerised hosted agents The BRK241 hero path packages the entire analyse → coordinate → dispatch flow as a single hosted agent: a container that serves the Responses /responses contract on port 8088, deployed straight into your Foundry project. The Agent Framework agent is wrapped by ResponsesHostServer : from agent_framework_foundry_hosting import ResponsesHostServer def main() -> None: server = ResponsesHostServer(build_system_agent()) # Foundry sets the reserved PORT env var inside the sandbox server.run(host="0.0.0.0", port=8088) The container is declared in agent.yaml — kind: hosted , the image reference, the per-session sandbox size (0.5/1 Gi, 1/2 Gi or 2/4 Gi), the protocol version, and only user-declared environment variables. You never hard-code FOUNDRY_* values or the Application Insights connection string; the platform injects those at run time. Deployment registers the image as an immutable version and polls until active : details = pc.agents.create_version( agent_name="fibreops-outage-response", definition=HostedAgentDefinition( protocol_versions=[ProtocolVersionRecord( protocol=AgentProtocol.RESPONSES, version="1.0.0")], cpu="1", memory="2Gi", container_configuration=ContainerConfiguration(image=image), environment_variables={"MODEL_DEPLOYMENT_NAME": model_deployment}, ), ) From local execution to managed hosting The migration path is deliberately gentle because the contract never changes. A developer iterates locally against LocalAgent , moves to the foundry backend to test real prompts, then publish es Prompt Agents or builds and deploy-hosted s the container. The orchestrator code is byte-for-byte identical across all three. That property — same code path local for dev, hosted in Foundry for prod — is the single most important thing to preserve when designing your own agents. Scaling, memory, toolboxes, knowledge and observability Scaling — Foundry provisions a per-session sandbox and a dedicated Entra agent identity per hosted-agent version; you size the sandbox in agent.yaml and let the platform handle isolation. Memory — set FOUNDRY_MEMORY_STORE_NAME and a FoundryMemoryProvider is attached as a context provider so agents read and write learned procedures in Foundry's hosted store; unset, they use local SQLite. No code change. Toolboxes & knowledge — hosted web_search , code interpreter, MCP, and Web/Work IQ connectors are curated per role and merged with your Python tools. Observability — the agent emits OpenTelemetry spans; set APPLICATIONINSIGHTS_CONNECTION_STRING (injected by the platform for hosted agents) and every agent decision, tool call and latency is queryable in Application Insights. Section 3: IT and development responsibilities Successful agent deployments need both developer velocity and platform governance. The failure mode at either extreme is familiar: developers who can't ship because every request routes through a ticket queue, or a free-for-all where nobody can say what identity an agent runs as. The workable model draws a clean line of responsibility. Concern Developer / Agent team IT / Platform team Identity Use DefaultAzureCredential ; never embed secrets; declare the scopes the agent needs Provision the managed / Entra agent identity; own the app registration and consent Access control Request least-privilege roles for the tools the agent calls Grant RBAC at the correct scope; run role-assignment scripts; enforce approvals Security Validate inputs, handle tool failures cleanly, avoid data exfiltration in prompts Disable ACR admin, enforce managed-identity pulls, network controls, Key Vault for secrets Compliance Keep decisions explainable and replayable (the JSON run record) Data-residency, retention, audit, Responsible AI review sign-off Monitoring Emit structured traces + OTel spans; define the rubric Own Application Insights / Log Analytics, alerting, dashboards, SLOs Cost Right-size the sandbox and model deployment; cache grounding Budgets, quota, token-consumption monitoring, chargeback Lifecycle Version prompts and images; feed the optimiser back into new versions Environment promotion (dev → test → prod), rollback, deprecation The reference implementation encodes this split honestly. The Bicep template does not create role assignments, because most deployers only hold Contributor . Instead a subscription Owner runs scripts/grant-mi-roles.ps1 once to grant the App Service's identity exactly the roles it needs — Event Hubs Data Owner, Key Vault Secrets User, AcrPull, Azure AI Developer, and Cognitive Services OpenAI User — and no more. That is least privilege made operational. Section 4: Publishing to Microsoft Teams and Microsoft 365 An agent nobody can reach has no value. The final verb — Distribute — puts the agent where users already work. FibreOps reaches Teams two ways. The lightweight path: Adaptive Cards via Incoming Webhook The NetOps coordinator posts outage notices and status updates to a Teams channel as Adaptive Cards through an Incoming Webhook. Any unconfigured channel is logged to state/teams_outbox.jsonl , so the same code runs in a demo and in production — you only change the webhook target. This is the fastest way to get agent output into Teams and is ideal for notifications and human-in-the-loop review. The rich path: a declarative agent for Microsoft 365 Copilot To make the agent conversational and discoverable across Teams, Microsoft 365 Copilot and copilot.microsoft.com, FibreOps ships as a declarative agent plus an API plugin action. One command builds the sideload-ready package: python -m fibreops.demo publish-m365 --out dist/m365 # wrote declarativeAgent.json (name, description, conversation starters) # wrote fibreops-action.json (API plugin -> {base_url}/openapi.json) # wrote manifest.json (Teams app manifest) # wrote color.png / outline.png (icons) # wrote fibreops-copilot.zip (upload this) The declarative agent declares metadata, conversation starters and a capability set; the action plugin proxies tool calls to the deployed FastAPI app via its OpenAPI document. Set M365_ACTION_BASE_URL to the app's public HTTPS root before publishing — the CLI warns when the placeholder is still in effect. That single environment variable is the only thing that flips the package from demo to production. The end-to-end distribution workflow Conceptually, the artefact travels a fixed pipeline: Developer laptop │ build + test (local backend) → publish Prompt Agent / deploy hosted container ▼ Microsoft Foundry Agent Service │ hosted agent, secure sandbox, Entra agent identity, observability ▼ Teams App package (fibreops-copilot.zip) │ Teams Admin Center → Manage apps → Upload (or M365 Admin Center → Integrated apps) ▼ Microsoft 365 tenant │ admin approval, availability policy, targeted rollout ▼ End user in Teams / M365 Copilot Enterprise rollout is rarely "publish to everyone". The realistic pattern is a staged one: sideload to a pilot group, gather feedback and optimiser scores, then widen availability through Teams app-permission and app-setup policies to department, then tenant. Because the package carries publisher metadata and the declarative schema, IT can review it exactly like any other line-of-business app. Section 5: Enterprise governance Governance is not a bolt-on; in this architecture it's a property of the platform. The pillars: Entra ID integration and agent identity — every hosted agent version gets a dedicated Entra agent identity. Nothing authenticates with a shared key. DefaultAzureCredential means the same code picks up a developer's identity locally and the managed identity in production. RBAC at the right scope — roles are granted to identities, not baked into images. Deploying a hosted agent requires Azure AI Project Manager at project scope; the Foundry project identity needs AcrPull on the registry to pull the container. Least privilege is enforced, not assumed. Auditability — the JSON run record plus OpenTelemetry spans in Application Insights give you a replayable, per-incident audit trail. You can reconstruct exactly which SOP was cited, which engineer was chosen, and why severity was escalated. Data boundaries — the mock D365 is a drop-in for a real Dataverse environment; grounding sources are enterprise connectors (Work IQ) kept inside the tenant boundary. Nothing leaves the subscription without an explicit connector. Responsible AI — the Adaptive Card JSON can be pasted into the Adaptive Cards designer for governance review; the evaluation rubric makes quality measurable; explicit grounding fallbacks prevent silent failure. Production readiness — immutable versioning, one-command rollback (delete a version), managed-identity-only image pulls, and disabled ACR admin credentials are all first-class in the reference deployment. Section 6: Reference architecture The following diagram shows the production topology — users on the left, enterprise systems and controls on the right, with Foundry Agent Service at the centre hosting the agent. flowchart LR User["NOC operator / business user"] subgraph M365["Microsoft 365 tenant"] Teams["Microsoft Teams(Adaptive Cards + declarative agent)"] Copilot["Microsoft 365 Copilot"] end subgraph Foundry["Microsoft Foundry Agent Service"] Hosted["Hosted AgentOutage Response System(secure per-session sandbox)"] Runtime["Agent runtime(Responses API)"] Memory["Hosted memory + toolboxes"] end subgraph Enterprise["Enterprise data & tools"] MCP["MCP servers / web_search"] D365["Dynamics 365 Field Service"] EventHub["Azure Event Hubs(OLT telemetry)"] Knowledge["SOPs + topology + Web/Work IQ"] end subgraph Ops["Cross-cutting"] Obs["ObservabilityApp Insights / OTel"] Gov["GovernanceEntra ID · RBAC · audit"] end User --> Teams User --> Copilot Teams --> Runtime Copilot --> Runtime Runtime --> Hosted Hosted --> Memory Hosted --> MCP Hosted --> Knowledge Hosted --> D365 EventHub --> Hosted Hosted -.->|Adaptive Cards| Teams Hosted --> Obs Gov -.->|identity & policy| Foundry Gov -.->|identity & policy| Enterprise Read the solid arrows as the control/orchestration flow and the dashed arrows as governance and outbound notifications. The point of the diagram is that governance (Entra ID, RBAC, audit) applies across every component, and observability captures every agent decision — neither is optional plumbing. Section 7: What production looks like Picture the FibreOps rollout at a national fibre operator, with the four personas doing their part: Developers build the three agents and the orchestrator on their laptops against the local backend — no cloud, no credentials, deterministic tests. They tune prompts against the foundry backend, watch the optimiser rubric climb from 0.90 to 1.0 as they add the ">5,000 customers ⇒ escalate to critical" rule, and commit a new instruction version. The platform team deploys the container to Foundry Agent Service via scripts/deploy-hosted-agent.ps1 , which builds the image in ACR, pushes it, and registers an immutable version. They provision the Event Hub, Key Vault, Log Analytics and Application Insights from Bicep, and size the sandbox at 1 vCPU / 2 GiB. IT approves the workload: a subscription Owner grants the managed identity its five least-privilege roles, hardens the App Service to pull via managed identity, disables ACR admin, and signs off the Responsible AI review using the replayable run records and the Adaptive Card previews. They sideload fibreops-copilot.zip to a pilot channel first. Business users consume it inside Teams. When an OLT in London loses light, an Adaptive Card appears in the NOC channel within seconds — severity, probable cause, ticket ID, and the dispatched engineer's ETA — with no human having read a dashboard, opened a ticket, or phoned a dispatcher. If Foundry ever wobbles, the same system falls back to the deterministic local agent with an identical trace shape. Every integration but D365 is live in the demo, and D365 is a one-variable swap to a real Dataverse endpoint. That is the whole point: the demo and production differ by configuration, not by code. Key takeaways Design for one contract. If agent.run(prompt) behaves identically local, foundry-backed and hosted, migration to production is configuration, not a rewrite. Factor agents by role with hard handoff contracts. Literal tokens like HANDOFF:DISPATCH beat fuzzy natural-language handoffs and stop agents inventing work. Never embed secrets. DefaultAzureCredential + Entra agent identities give you keyless auth that works the same everywhere. Make every run replayable. A single JSON artefact that feeds logs, evaluation and audit is worth more than any dashboard. Ground explicitly, and design your fallbacks. Grounding that fails silently is a liability; deterministic fixtures keep the agent honest. Split responsibility cleanly. Developers own velocity and quality; the platform team owns identity, scale, cost and promotion. Encode the split in scripts, not tribal knowledge. Version prompts and images immutably. Rollback should be "delete a version", and the optimiser's suggestions should land as the next version. Distribute where users already are. Adaptive Cards for notifications, a declarative agent for conversation and discovery across Teams and M365 Copilot. Roll out in stages. Pilot channel → department → tenant, gated by app policies and real optimiser scores. Resources Reference implementation: github.com/leestott/BRK241-frontier Microsoft Agent Framework overview Microsoft Foundry Agent Service Hosted agents in Foundry Agent Service · Deploy a hosted agent Microsoft Teams developer platform Declarative agents for Microsoft 365 Copilot Model Context Protocol GitHub Copilot Clone the repo, run python -m fibreops.demo --signals 3 --backend local , and watch the analyse → coordinate → dispatch loop close. Then wire in your own Foundry project and take it all the way to Teams. Go build something.Round Table: Building Browser-Capable Agents with the Browser Automation Tool
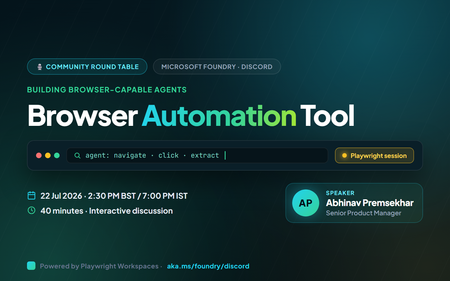
Some of the most valuable work still lives inside a browser: booking a class, pulling a figure off a dashboard, filling in a portal form, gathering research across a dozen tabs. These are exactly the tasks people wish an agent could just do. On 22 July 2026 at 2:30 PM BST (7:00 PM IST), the Microsoft Foundry community is running a 40‑minute Discord round table on the Browser Automation tool : how how it helps agents complete real browser workflows, where you see risk or friction, and what samples, docs, and product improvements would help you adopt it. This is a discussion, not a slideshow. Bring your real projects : the the web workflows you'd love to hand off, and the guardrails you'd want first. Join us in the Microsoft Foundry Discord community. Please arrive at the scheduled time for a quick tech check. Event at a glance What: Microsoft Foundry Discord Community Round Table : Building Browser-Capable Agents with the Browser Automation Tool When: 22 July 2026, 2:30 PM BST / 7:00 PM IST (40 minutes) Where: https://aka.ms/foundry/discord Event link https://discord.gg/Z8JZsrP5P5?event=1527676149264679013 Format: Interactive discussion : voice and chat, live polls, and a short prioritisation exercise voice and chat, live polls, and a short prioritisation exercise Who it's for: AI engineers and developers building agents that need to act on the web Opening question we'll start with: "What browser-based task would you love an AI agent to automate for you today?" The problem: the last mile of automation still runs in a browser Most real-world workflows eventually hit a website with no clean API , such as a supplier portal, an internal admin console, a booking page, or a legacy dashboard a supplier portal, an internal admin console, a booking page, a legacy dashboard. Traditional scripting can automate these, but selectors break, pages change, and every new site means another brittle script to maintain. What developers actually want is an agent that can look at a page, decide what to do, and do it : navigate, read, click, type, and hand back a structured result navigate, read, click, type, and hand back a structured result. That's the gap the Browser Automation tool in Microsoft Foundry is built to close , and doing it responsibly and doing it responsibly, with the right safeguards, is a big part of why we want your feedback. What is the Browser Automation tool? The Browser Automation Tool (BAT) gives Foundry agents the ability to drive a real browser to complete web workflows. It's available as an MCP tool, and it uses Playwright Workspaces , a generally available, cloud-scale service, a generally available, cloud-scale service : navigating, clicking at coordinates, typing, and applying filters as its headless browser infrastructure. When an agent gets a request, Foundry spins up an isolated, sandboxed browser session per interaction, so each run is private and segregated. How agents actually interact with a page BAT runs a perception–action loop. The model receives the current state of the page (including screenshots), decides the next action, and BAT executes it in the sandbox using Playwright and real oversight navigating, clicking at coordinates, typing, applying filters. After each action, BAT captures the updated state and sends it back to the model, repeating until the goal is met or the user stops. Because the model can parse HTML into a DOM, it can reason about the page rather than follow a fixed script. It also supports multi-turn conversations, so you can refine a request mid-flow to complete form-filling or scraping scenarios. Built for real use : watch the automation happen in real time for debugging. and real oversight Live View : a human-in-the-loop override for ambiguous or sensitive steps. watch the automation happen in real time for debugging. Take Control : each interaction gets its own sandboxed browser. a human-in-the-loop override for ambiguous or sensitive steps. Isolated sessions : for reliability, optimisation, and audit. each interaction gets its own sandboxed browser. Built-in observability : for internal systems (private preview). for reliability, optimisation, and audit. Private website browsing : Python, C#, JavaScript, Java, and the REST API. for internal systems (private preview). Broad SDK support , and the agent can make mistakes or be misled by malicious page content Python, C#, JavaScript, Java, and the REST API. A word on responsible use. BAT is powerful precisely because an AI can use credentials you share with it to reach email, financial, enterprise, or social accounts , watching for and the agent can make mistakes or be misled by malicious page content. You're responsible for reviewing your applications, scoping which credentials you provide, and adding your own mitigations. See the Foundry Agent Service transparency note. This is exactly the kind of trade-off we want to talk through together. Example scenario A user asks: "Report the year-to-date percent change of Microsoft's stock price." The agent navigates to a finance site, enters MSFT in the search bar, opens the stock page, clicks the YTD view on the chart, reads the value, and returns a clean, structured answer ; that's the no bespoke scraper, no hard-coded selectors, and a full trace of what it did. Discussion prompt: "Where would browser automation fit into your current projects or workflows?" How setup works (the short version) You'll want to understand the wiring before you scale, so it's worth a look ahead of the session. There are two moving parts: Create a Playwright Workspace in the Azure portal, enable the access token auth method, and grab the wss:// browser endpoint. Give your project identity a Contributor (or custom) role on the workspace. Connect the tool in Foundry under Build > Tools: create a toolbox, add Browser Automation, point it at your Playwright workspace and auth type, and publish. Copy the Project connection ID from the tool's details page : how agents interact with the web, example use cases, and responsible use. that's the BROWSER_CONNECTION_ID in your code. What we'll cover in the 40 minutes Welcome & opening question (0:00–0:03) : navigate, gather, interact, and return a structured result, end to end. the browser task you'd most love to automate. What is Browser Automation (0:03–0:07) : the workflows you're building, public vs. internal targets, and where you'd pick automation over scripting. how agents interact with the web, example use cases, and responsible use. Scenario walkthrough (0:07–0:12) : what agents may do autonomously, what needs approval, and the observability and enterprise safeguards you'd require. navigate, gather, interact, return a structured result : your biggest adoption blockers, missing docs, and the SDK samples and demos you'd prioritise. end to end. Use cases & opportunities (0:12–0:22) : vote live on top use cases, challenges, and feature requests. the workflows you're building, public vs. internal targets, and where you'd pick automation over scripting. Trust, security & governance (0:22–0:31) , and which would benefit most from a capable agent. what agents may do autonomously, what needs approval, and the observability and enterprise safeguards you'd require. Developer experience feedback (0:31–0:36) ; which should always require approval. your biggest adoption blockers, missing docs, and the SDK samples and demos you'd prioritise. Prioritisation & next steps (0:36–0:40) , sometimes with credentials, vote live on top use cases, challenges, and feature requests. Come prepared to talk about The browser-based workflows you're building today : navigation, data gathering, form filling, and research, via an MCP tool powered by Playwright Workspaces. and which would benefit most from a capable agent. Whether your scenarios target public websites, internal systems, or both. Why you'd choose browser automation over traditional scripting. Which actions you'd let an agent perform autonomously : a perception-action loop with screenshots and DOM parsing handles pages that break brittle scripts. and which should always require approval. The observability, audit, and enterprise safeguards you'd expect before running this in production. The examples, samples, and tutorials that would help you get started fastest. Responsible and secure by design Because BAT lets an agent take real actions on live websites : isolated sessions, Live View, Take Control, and observability for reliability and audit. sometimes with credentials : scope credentials carefully and add your own mitigations; the tool is powerful and in preview. governance is a first-class part of the conversation, not a footnote. Isolated per-session sandboxes, Live View, Take Control human-in-the-loop, and built-in observability are there so you can see, pause, and audit what an agent does. Bring your trust concerns, required guardrails, and governance requirements: they directly shape the roadmap. Note: the Browser Automation tool is in preview; APIs and capabilities may change, and it isn't recommended for production workloads yet. Key takeaways Browser Automation lets Foundry agents complete real web workflows : this round table feeds directly into the engineering and product teams. navigation, data gathering, form filling, research , and arrive on time for the tech check. via an MCP tool powered by Playwright Workspaces. Agents reason, not just replay , and browser-capable agents are how we cross it. a perception–action loop with screenshots and DOM parsing handles pages that break brittle scripts. Oversight is built in: isolated sessions, Live View, Take Control, and observability for reliability and audit. Responsibility is shared: scope credentials carefully and add your own mitigations; the tool is powerful and in preview. Your feedback shapes the product: this round table feeds directly into the engineering and product teams. Save your spot Add it to your calendar: 22 July 2026, 2:30 PM BST / 7:00 PM IST, and arrive on time for the tech check. Join the community: https://aka.ms/foundry/discord Prep with the sample: explore the browser automation sample in foundry-samples. Read the docs: Automate browser tasks with Foundry agents and the hosted-agent quickstart. Event registration link https://discord.gg/Z8JZsrP5P5?event=1527676149264679013 The last mile of automation still runs in a browser, and browser-capable agents are how we cross it. Come tell us what you'd automate, where you'd draw the line, and what you'd need to trust it in production. See you on 22 July.Building AI Agents from Zero to Production
Building AI Agents from Zero to Production Most agent demos stop at "it answered my question." Production doesn't. The gap between a notebook that calls an LLM and a governed, observable, multi-agent system your organisation can actually depend on is where real engineering happens, evaluation, deployment, data sovereignty, tool governance, and cross-team interoperability. Microsoft's open-source course Building AI Agents from Zero to Production walks that entire arc in seven lessons, using one realistic use case and the Microsoft Agent Framework (MAF) plus Microsoft Foundry. This post is a developer-focused tour of what it teaches, the architecture decisions behind each stage, and the code patterns that matter when you move from prototype to production. Who this is for AI engineers building their first or first production, agent system. Backend and full-stack developers integrating agents into real applications and CI/CD. Cloud architects who need data sovereignty, private networking, and governance around agent workloads. Technical leads deciding how to standardise tools and orchestration across multiple teams. The samples are Python 3.12+, served through Microsoft Foundry using GPT-5 series models (for example gpt-5.1 ). Lesson 4 adds a TypeScript/React frontend. You will want an Azure subscription and the Azure CLI. The AI Agent Development Lifecycle The course is organised around a lifecycle rather than a feature list. Each lesson is a stage, and each stage assumes the previous one is solved: # Stage The production question it answers 1 Agent Design What should each agent do, and how do they hand off? 2 Agent Development How do I build and run them with the Agent Framework? 3 Agent Evaluations How do I know they actually work — and keep working? 4 Agent Deployment How do I ship one as a hosted service with a UI and CI gate? 5 Production Hosted Agents How do I meet enterprise data, network, and governance needs? 6 Microsoft Toolbox How do I govern tools once, and reuse them across teams? 7 Multi-Agent & A2A How do agents from different teams interoperate safely? The thread running through all seven is a single scenario: a Developer Onboarding agent system that helps a new hire find the right teammates, get a sensible first task, and pull learning resources and code snippets. It is deliberately mundane, which is exactly why it exposes the production concerns that flashy demos hide. Lesson 1 — Agent Design: three components, one graph The course defines an agent by three parts: an LLM for reasoning, tools to act, and memory to retain context. The design work is context engineering — making sure the right information reaches the model at the right moment, no more and no less. Rather than one monolithic assistant, the onboarding system is split into specialists coordinated by a triage agent using handoff orchestration: Agent Job Tool Employee Search Answer org and people questions Foundry file search over an employee-directory vector store Task Recommendation Suggest 1–3 GitHub issues for the new dev GitHub MCP Server (reads recent commits + open issues) Code Assistant Provide resources and runnable snippets Microsoft Learn MCP + Code Interpreter Architecturally this is a directed graph: User → Triage → [Employee, Learning, Coding] . Splitting responsibilities early pays off later, each agent gets a tightly scoped prompt (less hallucination), can be evaluated independently, and can be upgraded without touching its peers. Lesson 2 — Development: standalone agents with MAF Here the design becomes code. Each specialist is a small, independently runnable service built with the Microsoft Agent Framework, authenticated to Foundry with your Azure CLI login. Setup is deliberately boring: az login az account set --subscription "<your-subscription-id>" cp .env.example .env # Fill FOUNDRY_PROJECT_ENDPOINT and FOUNDRY_MODEL (e.g. gpt-5.1) # Create the employee-directory vector store once; note the printed VECTOR_STORE_ID python lesson-2-agent-development/setup_vector_store.py # Start an agent — serves on http://localhost:8090 python lesson-2-agent-development/employee-search-agent.py The FoundryChatClient auto-reads any FOUNDRY_ -prefixed environment variables and uses AzureCliCredential , so there are no keys in code. The lesson ships six samples, each on its own port, so you can chat with them individually in the local DevUI before wiring them together: Sample Tool Port employee-search-agent.py Foundry file search / vector store 8090 task-recommendation-agent.py GitHub MCP Server 8095 azure-learning-agent.py Microsoft Learn MCP 8092 coding-agent.py Code Interpreter 8093 learning-recommendation-agent.py Learn MCP + reasoning 8091 agent-orchestration.py Multi-agent handoff 8094 Why this matters: keeping each agent as its own process with its own port is a testability decision, not an accident. You can smoke-test one specialist in isolation, then compose them in agent-orchestration.py . Lesson 3 — Evaluation: you can't unit-test a probability distribution This is the lesson that separates a demo from a product. Agents are non-deterministic, so traditional assertions don't fit. The course uses three complementary layers: Observability / tracing — always on, via OpenTelemetry to Application Insights. Smoke tests — fast, run on every deploy. Evaluations — deeper, model-based scoring run on-demand or nightly. Turning on tracing is a single call: from agent_framework.foundry import FoundryChatClient client = FoundryChatClient() client.configure_azure_monitor() # export traces + metrics to Application Insights For quality it uses Foundry's built-in "LLM-as-a-judge" evaluators against real persisted responses (identified by response_id ), not freshly regenerated ones: Evaluator evaluator_name Measures Relevance builtin.relevance Does the response address the request? Groundedness builtin.groundedness Is it supported by retrieved data (no hallucination)? Tool-call accuracy builtin.tool_call_accuracy Were the right tools called with the right arguments? Tool-output utilization builtin.tool_output_utilization Did the agent actually use tool results? The judge model is set independently via AZURE_AI_MODEL_DEPLOYMENT_NAME , so you can evaluate a cheap production model with a stronger one. The run prints a report_url that deep-links into the Foundry portal. Lesson 4 — Deployment: a hosted agent, a UI, and a CI gate Now the agent becomes a managed service. It is deployed as a Foundry Hosted Agent a Microsoft-managed execution environment and fronted by an OpenAI ChatKit React UI talking to a FastAPI backend: ChatKit React (3000) → FastAPI backend (8001) → Foundry Hosted Agent → tools Building the agent is declarative attach tools, name it, serve it: agent = client.as_agent( name="DevOnboardingAgent", instructions="...", tools=[file_search_tool, learn_mcp_tool], ) # served with: from_agent_framework(agent).run() The recommended deploy path is the Azure Developer CLI: cd hosted-agent azd auth login azd agent deploy The genuinely production-minded part is the smoke test as a post-deploy CI gate. Six cases cover reachability, each scenario, off-topic prompt adherence, and multi-turn threading (verifying state via previous_response_id ). The GitHub Action runs them against the freshly deployed agent: export FOUNDRY_TOKEN=$(az account get-access-token \ --resource https://ai.azure.com/ --query accessToken -o tsv) python runner.py \ --project-endpoint "https://<account>.services.ai.azure.com/api/projects/<project>" \ --agent-name dev-onboarding \ --tests-file tests/smoke-tests.json Pitfall to remember: the token audience must be https://ai.azure.com/ . A cognitiveservices.azure.com token is rejected by the Responses API — a mistake that costs many engineers an afternoon. Lesson 5 — Production: separating where an agent runs from where its data lives The pivotal concept for enterprise readiness is the distinction between a Hosted Agent (compute, scaling, identity) and a Capability Host (where conversation history, files, and embeddings actually reside): Concern Hosted Agent Capability Host Compute / scaling / identity ✅ Provided — Conversation history Microsoft-managed default Redirect to your Azure Cosmos DB File uploads Microsoft-managed default Redirect to your Azure Storage Vector embeddings Microsoft-managed default Redirect to your Azure AI Search Required to run the agent? ✅ Yes ❌ Optional Required for data sovereignty? ❌ Not sufficient ✅ Yes "Basic" setup uses Microsoft-managed storage and is perfect for getting started. "Standard" setup redirects each data plane to your own Azure resources through a project-level capability host, this is how you keep customer data in your tenant, inside your network boundary: PUT .../accounts/{account}/projects/{project}/capabilityHosts/{name}?api-version=2025-06-01 { "properties": { "capabilityHostKind": "Agents", "threadStorageConnections": ["my-cosmosdb-connection"], "vectorStoreConnections": ["my-ai-search-connection"], "storageConnections": ["my-storage-connection"] } } Operational constraints worth internalising before you provision: there is one capability host per scope (a second attempt returns 409 Conflict ), configuration is immutable (delete and recreate to change it), deletion is destructive, and the account-level host must exist before the project-level one. Lesson 6 — Toolbox: govern tools once, reuse everywhere Left unchecked, every team re-implements the same tools, scatters credentials, and loses governance visibility. The Microsoft Foundry Toolbox solves this by exposing a curated, versioned set of tools behind a single MCP-compatible endpoint, with credentials held in Foundry connections rather than agent code. You build a toolbox version once: from azure.ai.projects.models import MCPTool, ToolboxSearchPreviewTool, WebSearchTool toolbox_version = project.toolboxes.create_toolbox_version( name="agent-tools", description="Web search + an MCP server + tool search", tools=[ WebSearchTool(), MCPTool( server_label="myserver", server_url="https://your-mcp-server.example.com", require_approval="never", project_connection_id="my-key-auth-connection", # credentials live in Foundry ), ToolboxSearchPreviewTool(), ], ) And every agent consumes it through one endpoint, no per-team tool code: from agent_framework import MCPStreamableHTTPTool mcp_tool = MCPStreamableHTTPTool( name="toolbox", url=TOOLBOX_ENDPOINT, # {project_endpoint}/toolboxes/{name}/mcp?api-version=v1 http_client=http_client, load_prompts=False, ) agent = chat_client.as_agent(name="my-toolbox-agent", instructions="...", tools=[mcp_tool]) Versioning is blue/green: create a new version, test it on its version-specific endpoint, then promote it to default and every consumer picks it up with zero code changes. A Guardrail (RAI) policy can be applied at the toolbox layer, independent of model-level content filters. Note the toolbox management APIs are currently preview; the portal or VS Code Foundry Toolkit are practical alternatives for creation today. Lesson 7 — Multi-Agent & A2A: agents as networked peers The final lesson contrasts two ways agents collaborate: Handoff / Workflow — in-process, same codebase, fastest, tightest coupling. Agent-to-Agent (A2A) — cross-process over an open protocol, so agents from different teams, orgs, or frameworks interoperate. A2A gives each agent a discoverable Agent Card at /.well-known/agent-card.json and a task lifecycle (submitted → working → completed/failed). The elegant part: A2AExecutor wraps an existing MAF agent with no changes to that agent's code. from agent_framework.a2a import A2AExecutor from a2a.server.apps import A2AStarletteApplication from a2a.server.tasks import InMemoryTaskStore agent_card = AgentCard( name="Coding Assistant", url="http://localhost:9000/", version="1.0.0", capabilities=AgentCapabilities(streaming=True), skills=[AgentSkill(id="generate-code", name="Generate code", tags=["code"])], ) request_handler = DefaultRequestHandler( agent_executor=A2AExecutor(agent), # wraps your existing MAF agent unchanged task_store=InMemoryTaskStore(), ) app = A2AStarletteApplication(agent_card=agent_card, http_handler=request_handler).build() Consuming a remote agent then looks exactly like calling a local one: from agent_framework.a2a import A2AAgent remote_agent = A2AAgent(name="remote-coding-assistant", url="http://localhost:9000") result = await remote_agent.run("Write a Python function that reverses a string.") Because an A2AAgent can be a participant inside a HandoffBuilder workflow, you can mix in-process routing with remote services in the same orchestration. For enterprise use, A2AAgent accepts an auth_interceptor for bearer tokens, and the Agent Card carries security_schemes . Responsible and secure by design Production readiness in this course is not just uptime, it is governance: Identity over keys — AzureCliCredential and managed identity throughout; no secrets in code. Least privilege — CI runners get a scoped Azure AI User role assignment on the specific project. Data sovereignty — capability hosts keep conversation history, files, and embeddings in your own Cosmos DB, Storage, and AI Search. Tool approval and guardrails — MCP approval_mode and toolbox-level RAI policy gate what agents can do. Grounded evaluation — groundedness and tool-utilization scoring catch hallucination and unused-tool behaviour before users do. Cost hygiene — the lessons create real Azure resources; delete the resource group when done: az group delete --name <rg> --yes --no-wait . Key takeaways Design as a graph of specialists. Handoff orchestration with tightly scoped agents beats one monolith on reliability and testability. One .run() contract, many backends. The Agent Framework keeps orchestration code stable from local dev to hosted production. Evaluate continuously. Tracing + smoke tests + model-based evaluators are three layers, not alternatives. Separate compute from data. Hosted Agents run the agent; Capability Hosts give you sovereignty — you need both for enterprise. Govern tools centrally. A versioned toolbox behind one MCP endpoint kills tool sprawl and credential duplication. Open protocols for interop. A2A lets agents cross team, org, and framework boundaries without rewrites. Get started Clone the repo (skip the 50+ translations for a faster download) and work through the lessons in order: git clone --filter=blob:none --sparse https://github.com/microsoft/Building-AI-Agents-From-Zero-To-Production.git cd Building-AI-Agents-From-Zero-To-Production git sparse-checkout set --no-cone '/*' '!translations' '!translated_images' References Building AI Agents from Zero to Production — course repo Microsoft Agent Framework Microsoft Foundry documentation Agent-to-Agent (A2A) protocol specification a2a-python SDK AI Agents for Beginners MCP for Beginners Microsoft Foundry DiscordAzure Function App — Queue-Based Architecture for Long-Running Sync Jobs
The Problem: HTTP Triggers and Long-Running Jobs Don't Mix Here's a situation you've probably run into: you have a job that needs to loop over dozens of Azure resources, call APIs, and do real work. You wrap it in an HTTP-triggered Azure Function so it can be called on demand. It works great and after a few minutes, the caller gets a 504 Gateway Timeout. The 230-second limit is enforced by Azure Front Door / the platform load balancer. It cannot be overridden by app settings or host configuration. Any HTTP trigger that runs longer than ~3.5 minutes will timeout for the caller. In our case, the job iterates over 30+ Azure subscriptions — for each one it switches context, lists resources, and triggers image imports. Total runtime: anywhere from 2 to 10 minutes depending on how many ACRs need updating. Way over the limit. The Solution: Decouple Request from Execution via a Queue The fix is clean once you see it: the HTTP trigger shouldn't do the work — it should just accept the work and hand it off. That's what a queue is for. The flow splits into two independent phases: Request phase — The HTTP trigger validates the caller (JWT + app role check), packages the job parameters into a queue message, and returns 202 Accepted. This takes under 3 seconds. Execution phase — A Queue Trigger picks up the message and runs the actual sync. No HTTP connection involved, so there's no timeout. On a Dedicated (P-series) plan, execution time is unlimited. Approach What the caller gets Result HTTP trigger → run sync inline Waits for the full job to complete 504 TIMEOUT after 230 seconds HTTP trigger → Queue → Queue Trigger 202 Accepted immediately NO TIMEOUT job runs as long as needed 🤸♀️There's an added bonus - Reliability in Azure Queue Storage: Azure Storage Queues give you automatic retry out of the box. If the job crashes halfway through, the message becomes visible again after a visibility timeout and the Queue Trigger picks it up for a retry — up to 5 attempts before the message is moved to the poison queue. No retry logic to write 🤸♀️. Locking Down the Endpoint Since the HTTP trigger is the public entry point, it needs solid auth. We layer two things: ⭐Use EasyAuth for the "is this a real Entra ID token?" check, and a custom App Role for the "is this person allowed to trigger syncs?" check. These are independent concerns and should stay that way. Layer What it does How EasyAuth (Entra ID) Rejects requests without a valid Entra ID Bearer token — before your code even runs Configured at the Function App level via the Authentication blade App Role check Validates that the token contains the SyncJob.Execute role — only assigned users/SPs can trigger the job Decoded in the function code from the JWT roles claim Managed Identity Authenticates the Function App to Azure APIs (no credentials in code) Connect-AzAccount -Identity — identity assigned via RBAC One gotcha worth knowing: when using v2 tokens (which is the default with modern App Registrations), the aud claim in the token is the raw App ID GUID — not the api:// prefixed URI. You need to explicitly add both forms to your allowedAudiences in EasyAuth, otherwise valid tokens get rejected. APP_ID="<your-app-id>" TENANT_ID="<your-tenant-id>" FUNCTION_APP_URL="https://<your-function-app>.azurewebsites.net" # Interactive login (device code flow — works from any terminal) az login --tenant "${TENANT_ID}" \ --scope "api://${APP_ID}/.default" \ --use-device-code TOKEN=$(az account get-access-token \ --scope "api://${APP_ID}/.default" \ --query accessToken -o tsv) # Trigger the sync — returns 202 immediately curl -s -X POST "${FUNCTION_APP_URL}/api/SyncContainerRegistryHttpTrigger" \ -H "Authorization: Bearer ${TOKEN}" \ -H "Content-Type: application/json" Passing Parameters Through the Queue One nice property of this pattern: the queue message is just JSON, so you can pass whatever parameters the job needs. In our case, we pass a subscriptionFilter wildcard so callers can target a subset of subscriptions without touching any code. The parameter travels the full chain: HTTP body → queue message → Queue Trigger → PowerShell script parameter. Here's how each step handles it. Step 1 — HTTP Trigger reads the body and enqueues the message using the Push-OutputBinding output binding. Azure Functions wires the binding to the queue automatically — no SDK call needed: param($Request, $TriggerMetadata) # ... decode the JWT, check role assignment $queuePayload = @{ triggeredBy = $decoded.Payload.upn ?? $decoded.Payload.oid triggeredAt = (Get-Date -Format 'o') subscriptionFilter = if ($body.subscriptionFilter) { $body.subscriptionFilter } else { "*" } } | ConvertTo-Json -Compress Push-OutputBinding -Name QueueMessage -Value $queuePayload Push-OutputBinding -Name Response -Value ([HttpResponseContext]@{ StatusCode = [System.Net.HttpStatusCode]::Accepted Body = @{ message = "Sync job queued. Check Azure Monitor logs for execution status." } }) ⭐Push-OutputBinding is how Azure Functions PowerShell workers write to output bindings (queues, blobs, HTTP responses…). The binding name QueueMessage maps to the queue defined in function.json — the runtime handles serialisation and delivery. Step 2 — Queue Trigger passes the filter to the script as a named parameter: param($QueueItem, $TriggerMetadata) Write-Host "Triggered SyncContainerRegistry via Storage Queue. Payload: $QueueItem" $subscriptionFilter = if ($QueueItem.subscriptionFilter) { $QueueItem.subscriptionFilter } else { "*" } $SubscriptionFilter = $subscriptionFilter . "$PSScriptRoot/../SyncContainerRegistry/run.ps1" Step 3 — Long running job with the filter as parameter: param($Timer) if (-not $SubscriptionFilter) { $SubscriptionFilter = "*" } $subscriptions = Get-AzSubscription | Where-Object { $_.Name -like $SubscriptionFilter } foreach ($subscription in $subscriptions) { Set-AzContext -SubscriptionId $subscription.Id | Out-Null # ... do the work } Targeting a subset of subscriptions # Sync all subscriptions (default — omit the body) curl -s -X POST "${FUNCTION_APP_URL}/api/SyncContainerRegistryHttpTrigger" \ -H "Authorization: Bearer ${TOKEN}" \ -H "Content-Type: application/json" # Sync only subscriptions matching a pattern curl -s -X POST "${FUNCTION_APP_URL}/api/SyncContainerRegistryHttpTrigger" \ -H "Authorization: Bearer ${TOKEN}" \ -H "Content-Type: application/json" \ -d '{"subscriptionFilter": "*project-alpha*"}' ⭐PowerShell's -like operator uses * as a wildcard anywhere in the string. The pattern *project-alpha* matches sub-mycompany-project-alpha-prd, sub-mycompany-project-alpha-dev, etc. A pattern without a leading * only matches from the start of the string — keep this in mind when naming subscriptions. Pushing a Message Directly via PowerShell You can also push a message straight to the queue without going through the HTTP trigger — useful for testing, scripting, or bypassing the auth layer in a controlled environment. Connect-AzAccount # or -Identity for a Managed Identity context $storageAccount = "<your-storage-account>" $queueName = "sync-job-queue" # Build the payload — same shape the HTTP trigger produces $payload = @{ triggeredBy = $env:USERNAME triggeredAt = (Get-Date -Format 'o') subscriptionFilter = "*project-alpha*" # or "*" for all } | ConvertTo-Json -Compress # Get a queue client via the connected account (no key needed) $ctx = New-AzStorageContext -StorageAccountName $storageAccount -UseConnectedAccount $queue = Get-AzStorageQueue -Name $queueName -Context $ctx $queue.QueueClient.SendMessage($payload) ⭐ -UseConnectedAccount authenticates via the current Connect-AzAccount session — no storage key required, as long as your identity has the Storage Queue Data Message Sender role on the storage account. The Queue Message The HTTP trigger packages the caller identity and filter into a simple JSON payload before enqueuing. The Queue Trigger reads it back as a deserialised PowerShell object — no manual JSON parsing needed. { "triggeredBy": "user@company.com", "triggeredAt": "2026-06-01T11:03:55.570+02:00", "subscriptionFilter": "*project-alpha*" } Design Decisions at a Glance Decision Choice Why Async execution Azure Storage Queue HTTP trigger has a hard 230s timeout. The sync job takes 2–10 minutes. The queue decouples acceptance from execution — and gives us retry for free. Authentication EasyAuth + App Role No credentials in code. Access is controlled via Entra ID app roles — revocable per user without touching infrastructure. Azure identity Managed Identity No secrets to rotate or store. The Function App authenticates to Azure APIs using its platform-assigned identity. Job parameter Wildcard filter via queue payload Lets callers target any subscription subset without code changes. The filter travels through the queue — the Queue Trigger just passes it along. Hosting plan Dedicated (P-series) Consumption plan caps function execution at 10 minutes. A Dedicated plan has no execution time limit — essential when the job can run longer. See you in the Cloud JamesdldToken Economics: The New FinOps for Agentic AI
In AI applications, tokens are now cost — and token economics deserves architectural attention For a long time, AI application design started with model capability: Can the model write code? Can it reason? Can it use tools? Can it handle long context? Those questions still matter, but in the age of agentic applications, they are no longer sufficient. The more important production question is this: How many tokens does the architecture burn to complete one useful task? A classic chat application often maps one user turn to one model call. An agentic system is different. One user goal can trigger planning, retrieval, tool selection, tool execution, result interpretation, reflection, repair, and summarization. The user sees one instruction; the system may execute dozens of model calls behind the scenes. Tokens are no longer just a measure of text length. They become a measure of system design, runtime behavior, developer workflow, and business cost. GitHub Copilot’s 2026 move to usage-based billing through GitHub AI Credits captures the industry shift clearly. Usage is now aligned with token consumption, including input, output, and cached tokens. That matters because Copilot has evolved from an in-editor assistant into an agentic platform that can handle long, multi-step coding sessions across repositories. In that world, a tiny prompt and a multi-hour autonomous coding workflow should not be treated as the same economic unit. Token economics is therefore not about telling developers to “write shorter prompts.” It is about designing systems where: useful context is preserved, while noise is removed; repeated context is cached or deduplicated; simple tasks do not pay for frontier models; short-term state is managed structurally instead of copied repeatedly; every model call is metered, comparable, and governed. In short: token economics is the practice of making agentic AI economically sustainable. Scenario thinking: GitHub Copilot billing, Copilot SDK, GPT-5.5, Anthropic, and MAI-Code Model The new GitHub Copilot billing model provides a useful framing for developers. Copilot is no longer only autocomplete. It is becoming a programmable agentic platform. It can use models, call tools, work across files, stream responses, and participate in long-running coding workflows. With the GitHub Copilot SDK, developers can embed that agentic runtime into their own applications, services, and developer tools. That is powerful, but it also changes the cost model. Once an agent loop becomes programmable, token cost also needs to become programmable. If a system can plan, call tools, edit files, retry, repair, and summarize, it also needs to meter, route, cache, compress, and evaluate. EvalAgentic gives this idea a concrete playground. The project groups models into cost and capability tiers: Tier Example models Example price / 1K tokens Typical use LARGE claude-opus-4.8, gpt-5.5 $0.030 Agents, code generation, multi-step reasoning MID gpt-5.4-mini $0.012 Dialogue, summarization, extraction TINY gpt-5-mini $0.001 Classification, keyword matching, rule-like tasks This tiering lets us reason about real scenarios: GPT-5.5-class models are valuable for hard reasoning and engineering workflows, but they should not be the default for every step. Using a frontier model for simple classification is like hiring a principal architect to label folders. Anthropic high-capability models can be excellent for complex reasoning and coding, but they benefit from routing discipline. Requirements analysis, test interpretation, deployment explanation, and code generation may not need the same model tier. MAI-Code Model-style coding models should be treated as specialized capability layers. Their value is not just “better code generation”; it is deciding when code-specialized intelligence should be invoked in a larger agent pipeline. The real question is not “Which model is the best?” It is: Which model is the most economical and reliable for this step of this workflow? Four engineering techniques for saving tokens Context Compression: turn long text into executable structure Implementation principle Context Compression converts long natural-language context into the structured information an agent actually needs. Business documents are often verbose: resumes, contracts, product manuals, requirements, and support logs contain narrative text, boilerplate, repeated explanations, and low-value context. The next agent step may only need a few fields. EvalAgentic demonstrates this with a long resume-like input that is compressed into a compact JSON object. Instead of injecting the full original text into every prompt, the system extracts key fields and dynamically injects only the data required by the current task. A practical compression pipeline includes: Redundancy detection — identify long-tail text, repeated descriptions, stale history, and low-value context. Structured extraction — use Copilot or a mid-tier model to transform prose into JSON, tables, or typed schemas. Dynamic injection — inject only the fields needed for the next step. Recoverable references — preserve source pointers so compressed context remains auditable. How to evaluate Prompt token reduction before and after compression. Answer quality and task success rate. Schema fidelity and missing-field rate. Latency improvement. Cost per successful task. Compression is not summarization. Summaries are designed for humans. Structured compression is designed for agents. Prompt Deduplication / Cache: stop paying twice for the same context Implementation principle Many agent systems waste tokens because they repeatedly send the same context. The same resume, contract, repository README, user profile, API documentation, or business rule can be copied across turns and agents. Prompt Deduplication / Cache applies a simple principle: if context has already been processed, do not pay to process it again unless it has changed. A concrete design includes: compute a hash or semantic key for source context; reuse extracted structured results when content is identical or equivalent; apply a TTL for repeated entities, such as the 24-hour cache pattern shown in EvalAgentic; organize stable prompt prefixes to benefit from provider-level prompt caching where available; store shared context in an artifact store or memory layer so multiple agents do not copy the same blob. How to evaluate Cache hit rate. Cached token ratio. Duplicate prompt rate. Cost delta before and after caching. Correctness under cache, especially stale-cache failures. Caching is not “save everything forever.” Good caching knows when to reuse and when to invalidate. On-Demand Model Routing: let task complexity decide model tier Implementation principle On-Demand Model Routing routes each request to the cheapest model that can complete the task reliably. The entry point can use a rule tree, a lightweight classifier, or a hybrid complexity score. EvalAgentic’s routing tree is intentionally easy to explain: INCOMING REQUEST └─ Prompt < 500 tokens? ── YES ─→ TINY: classify / extract └─ NO ──→ multi-step reasoning? ├─ NO ─→ MID: dialogue / summary └─ YES ─→ LARGE: agent / code The engineering logic is straightforward: simple classification and keyword matching go to TINY; summarization and structured conversion go to MID; multi-step reasoning, coding, cross-file changes, and orchestration go to LARGE; code-specialized models such as MAI-Code Model can be placed in the coding phase rather than used across the whole pipeline. How to evaluate Routing accuracy. Cost per route. Quality regression by tier. Escalation rate from small models to larger models. End-to-end success rate. Routing does not mean “always use the smallest model.” It means frontier intelligence is reserved for the steps where it actually changes the outcome. Short-term Memory: preserve state instead of replaying history Implementation principle Short-term Memory controls context growth across multi-turn and multi-agent workflows. Without it, agents often replay the full conversation history, full tool outputs, and full intermediate reasoning on every turn. The context grows; quality may not improve; the bill definitely does. A better design stores state structurally: user goal; current plan; tool outputs and references; failure reasons; next actions; handoff artifacts between agents. In a multi-agent coding pipeline, the Requirements Agent should hand off a structured spec. The Coding Agent should read that spec, not the entire prior conversation. The Testing Agent should consume testable artifacts, not every word produced by the Coding Agent. How to evaluate Context growth curve across turns. Memory retrieval precision. Rework rate caused by missing state. Recovery quality after failed steps. Average input tokens per turn. Short-term memory is not about remembering everything. It is about remembering the next useful thing. EvalAgentic as a concrete evaluation example EvalAgentic is effective as an evangelism project because it turns token economics into an observable before/after system. The architecture has five layers: Frontend — frontend/index.html provides Tabs A / B / C, live SSE logs, and before/after charts. API — backend/server.py exposes FastAPI routes and Server-Sent Events streaming. Orchestration — eval.py handles A/B evaluation; coding_agents.py handles the multi-agent coding scenario. Core — compressor.py, router.py, gh_models.py, and token_meter.py implement compression, routing, Copilot SDK calls, and token metering. Providers — GitHub Copilot SDK and Microsoft Agent Framework provide model access and agent orchestration. Tab A: Compression comparison Tab A compares long-form context before and after structured compression. The key message is that token saving does not come from writing a clever sentence. It comes from converting verbose context into a structured artifact that downstream agents can consume efficiently. Tab B: On-demand model routing Tab B demonstrates that cost is not only about raw token count. If a system routes simple tasks to cheaper tiers and reserves expensive models for complex reasoning, total cost can fall even if some token counts increase. This is a subtle but important point: token economics is not token starvation; it is model portfolio optimization. Tab C: Coding scenario — multi-agent with Agent Framework Tab C is the most persuasive demo. The same deliverable — a Taobao-like goods-list site with HTML + JavaScript frontend, Flask backend, and Docker deployment — is produced twice by a four-agent pipeline: Requirements Agent; Coding Agent; Testing Agent; Deployment Agent. The before pipeline uses no compression and sends every agent to GPT-5.5 / LARGE. The after pipeline injects a compressed JSON spec and uses on-demand routing: requirements can use MID, coding can use LARGE, testing can use MID, and deployment can use TINY. This mirrors real enterprise development. Architecture and complex code generation may deserve frontier models. Test interpretation, deployment packaging, and simple validation often do not. Summary and refinement based on the project diagrams The EvalAgentic README describes three important visuals: the architecture flow, the routing tree, and the token-meter design. Together, they form a governance loop: User Scenario ↓ Context Compression ↓ Prompt Deduplication / Cache ↓ On-Demand Model Routing ↓ Short-term Memory ↓ Token Metering & Budget Actions ↓ Before / After Evaluation Optimize the path, not only the prompt Many teams start token optimization by editing prompt wording. That helps, but the largest waste usually lives in the execution path: how many calls are made, how much context is repeated, how often tools retry, and whether every step uses the same expensive model. EvalAgentic makes the path visible through A/B comparisons. Token Meter is the control plane of cost governance EvalAgentic’s token_meter.py uses a non-invasive interceptor pattern: INTERCEPTOR (@token_meter) ↓ COUNTER CORE: accounting / budget threshold / trigger ↓ ACTION HUB: throttle (>80% budget) / rollback (>budget) This is the right architectural instinct. Production systems need thresholds, throttling, rollback, and traceability. Without those controls, one retry loop can quietly turn a small user request into a budget incident. Cost metrics must be evaluated with quality metrics A system that cuts cost by 80% but drops success rate by 50% is not optimized. It is broken more cheaply. The evaluation matrix should combine cost, quality, latency, and reliability: Dimension Metric Why it matters Cost Cost per successful task Measures the real unit economics Token Input / output / cached tokens Identifies compression and cache opportunities Quality Pass rate / regression rate Ensures cheaper tiers do not break outcomes Efficiency Latency / retry count Prevents cheap models from causing expensive retries Governance Budget breach / rollback count Validates runtime control Narrative A simple three-line narrative works well for demos: Token is no longer a technical detail. It is the bill of your architecture. EvalAgentic shows the same scenario before and after cost-aware design. The goal is not to make models cheaper; the goal is to make agent systems economically governable. For a developer audience, the sharper version is: A good agent does not use the biggest model everywhere. It uses the right intelligence at the right step, with the right context, under the right budget. Practical recommendations for real projects Establish a token baseline first. Measure input, output, retries, tool calls, and cost per scenario before optimizing. Make compression a component, not a prompt habit. Define schemas, cache policies, and fallback behavior. Introduce a model routing matrix. Route by task type, complexity, risk, latency, and cost. Define handoff contracts between agents. Pass structured artifacts, not endless conversation history. Evaluate every optimization with A/B tests. Compare cost, quality, latency, and stability. Add budget actions. Throttle at a threshold, rollback on breach, and add circuit breakers for failed retries. Closing: token economics is the second curve of agent engineering The first phase of AI application development was about calling models. The second phase was about putting models into products. The next phase of agentic AI is about running those systems reliably, affordably, and governably. EvalAgentic matters because it turns Context Compression, Prompt Deduplication / Cache, On-Demand Model Routing, and Short-term Memory into something developers can run, compare, and explain. It moves token economics from opinion to instrumentation. Future AI applications will not only ask: How smart is this agent? They will ask: How many tokens does it spend per completed task? Which model did it use? Did it hit cache? Did retries run away? Did the system reserve frontier intelligence for the steps that deserved it? References kinfey/EvalAgentic GitHub Copilot is moving to usage-based billing Updates to GitHub Copilot billing and plans Copilot SDK - GitHub Docs8.5KViews4likes0CommentsGitHub Copilot App - Canvas Is Not a UI Builder
What if your development environment didn't just help you write code, but helped you observe, steer, and evolve a living system while it runs? That's the shift GitHub Copilot App Canvas represents. Canvas redefines how developers interact with agent-driven software: not by building traditional user interfaces, but by creating interactive environments where humans and AI co-create, test, and iterate in real time. This post walks through a real Canvas extension we built, a Multi-Agent Dev Canvas that demonstrates how Canvas becomes a runtime observability and control plane for an agent-driven system. We'll cover why Canvas exists, how it differs from traditional UI development, and how you can use it to accelerate the design-test-evolve loop for any multi-agent application. The Misconception: "Canvas Is for Building UIs" The first instinct many developers have when they see Canvas is to treat it like a UI framework, a place to build dashboards, boards, or user-facing applications. That's not what Canvas is for. Here's the distinction that matters: Traditional UIs are for using software. They serve end-users who interact with a finished product. Canvas is for shaping software while it runs. It serves developers and AI agents who are actively building, testing, and evolving a system. Canvas solves problems your final UI should never try to solve in a visible way. It's the observability layer, the control plane, the validation surface — all the things you need during development that disappear before production. Think of it this way: you wouldn't ship your debugger to users, but you absolutely need it while building. What We Built: A Multi-Agent Dev Canvas To demonstrate Canvas as a development runtime, we built a Multi-Agent Dev Canvas, a standalone GitHub Copilot Canvas extension (this repo, copilot-canvas-runtime) that treats an entire multi-agent system as a living, observable environment. The same pattern applies to any agent-driven system built on services such as Microsoft Foundry. The Multi-Agent Dev Canvas: a runtime observability and control plane where developers and AI agents collaborate to design, test, and evolve an agent-driven system in real time. The canvas provides four integrated panels: System View: See Your Agents Working Five specialised agents are displayed as live cards with real-time status indicators. Each card shows the agent's name, responsibility, current status (idle, running, done, or error), task count, and last action taken. When an agent is active, its card pulses blue. When it fails, it glows red. You see the system breathe. decompose_system — Breaks requirements into agent tasks execute_workflow — Coordinates agents to perform tasks validate_output — Runs evaluation tests and returns structured results update_system_design — Modifies architecture based on feedback track_state — Persists and updates system state over time Task Flows: Watch Work Move Through the Pipeline Below the agents, a flow graph visualises how tasks route between agents. When you decompose a system requirement like "Build an AI-powered code review agent," the canvas shows five components (pr-ingestion, code-analysis, feedback-generator, learning-loop, notification-service) flowing from the decomposer to the executor and designer agents. Each flow carries a status badge, pending, pass, or fail. Validation Panel: Continuous Testing, Not Afterthought Testing The validation panel displays structured test results with pass/fail badges and reasoning. When you run validation, each test case evaluates against specific criteria: ✅ "PR ingestion handles large diffs" — Meets criteria: process diffs over 5,000 lines without timeout ❌ "Feedback is actionable" — Failed: does not satisfy criteria that each suggestion includes a code fix ✅ "Learning loop converges" — Meets criteria: accept rate improves over 10 iterations ✅ "Notifications are non-blocking" — Meets criteria: delivery latency under 500ms This isn't a test runner you invoke separately, it's a validation surface embedded in the development loop. You see failures the moment they happen, in context, alongside the agents and flows that produced them. Live State Timeline: Every Mutation, Visible The right panel tracks every state change with timestamps. Decomposition events, workflow executions, validation runs, failure injections — all appear chronologically. This is the system's memory, visible to both the human developer and the AI agents working alongside them. Canvas as a Runtime: The Key Capabilities What makes Canvas a runtime rather than a display layer is that the agent can act through it. The canvas exposes seven agent-callable actions: Action What It Does decompose_system Accept requirements and components, generate task flows, update the system design execute_workflow Run pending tasks through the agent pipeline, produce artifacts validate_output Evaluate test cases against criteria, return structured pass/fail with reasoning update_system_design Modify the architecture description, constraints, or component list live track_state Read the full system state — agents, flows, validations, history, artifacts inject_failure Force an agent into an error state to test system adaptation pause_resume Toggle execution on and off The human developer can click Decompose, Execute, or Validate directly in the canvas. The AI agent can invoke the same actions programmatically. Both parties operate on the same surface, the same state, the same system, that's what makes Canvas collaborative in a way traditional tooling is not. Why This Matters: Canvas vs. Figma vs. Traditional UIs It helps to position Canvas against tools developers already know: Figma is Human-to-Human collaboration on design. Multiple people interact with the same visual surface, but nothing executes. It's a design tool. Traditional UIs are Human-to-System. Users interact with finished software through a polished interface. Canvas is Human-to-AI-to-System. It's a shared space where things actually execute. The developer steers, the AI acts, and the system evolves, all visible, all in real time. Canvas is collaborative in the Figma sense — it's a shared space, it's visual, multiple participants interact with the same surface. But unlike Figma, the participants include AI agents, and the surface isn't a mockup — it's a live system. How the Extension Works: Under the Hood A Canvas extension is a standard GitHub Copilot CLI extension, a single extension.mjs file that speaks JSON-RPC over stdio. The key components: 1. State Management Each canvas instance maintains its own system state: agents, task flows, validations, a state history timeline, artifacts, and the current system design. State is held in-memory per instance and pushed to the iframe via Server-Sent Events whenever it changes. function createInitialState() { return { agents: [ { id: "decomposer", name: "decompose_system", status: "idle", responsibility: "Break requirements into agent tasks" }, { id: "executor", name: "execute_workflow", status: "idle", responsibility: "Coordinate agents to perform tasks" }, // ... three more agents ], taskFlows: [], validations: [], stateHistory: [], artifacts: [], systemDesign: { description: "", constraints: [], components: [] }, execution: { paused: false, stepCount: 0 }, }; } 2. Real-Time Updates via Server-Sent Events The canvas runs a loopback HTTP server per instance. The iframe connects to an /events endpoint and receives state updates as they happen — no polling, no websocket complexity. if (req.url === "/events") { res.writeHead(200, { "Content-Type": "text/event-stream", "Cache-Control": "no-cache" }); clients.add(res); // Push current state immediately on connect res.write(`data: ${JSON.stringify(getState(instanceId))}\n\n`); } 3. Dual Interaction Model Every action is available through two paths. The human clicks a button in the iframe, which POSTs to the local server. The AI agent calls invoke_canvas_action through the SDK. Both paths mutate the same state and trigger the same SSE broadcast. Neither is privileged over the other. 4. Canvas Declaration The canvas registers with the Copilot SDK using createCanvas , declaring its identity, description, and all agent-callable actions with JSON Schema validation on inputs: createCanvas({ id: "multi-agent-dev", displayName: "Multi-Agent Dev Canvas", description: "Runtime observability and control plane for multi-agent development", actions: [ { name: "decompose_system", description: "Break requirements into agent tasks", inputSchema: { type: "object", properties: { requirements: { type: "string" }, components: { type: "array", items: { type: "string" } } }, required: ["requirements"] }, handler: async (ctx) => { /* ... */ }, }, // ... six more actions ], open: async (ctx) => { /* start server, return URL */ }, onClose: async (ctx) => { /* clean up */ }, }); Scenarios This Enables The Multi-Agent Dev Canvas supports four development scenarios that would be impossible with traditional tooling: 1. End-to-End Feature Design Tell the agent "Build an AI-powered code review system." Watch it decompose the requirement into five components, route tasks to specialist agents, execute the workflow, and validate the outputs, all visible in real time. Iterate by modifying constraints or components and re-running. 2. Live Agent Collaboration Observation See how agents hand off work to each other. The flow graph shows which agent produced what, which tasks are pending, and where bottlenecks form. This is the kind of observability you need when debugging multi-agent orchestration but would never expose in a production UI. 3. Fault Injection and Adaptation Testing Use inject_failure to force an agent into an error state. Watch how the system responds. Does the orchestrator recover? Do downstream tasks fail gracefully? This chaos-engineering approach, applied during development, visible in real time, catches integration failures before they reach production. 4. Validation-Driven Iteration Define test criteria, run validation, see which tests fail, update the system design, re-run. The validation panel isn't a separate CI pipeline, it's embedded in the development surface, creating a continuous feedback loop between design decisions and their measurable outcomes. Getting Started: Build Your Own Canvas Extension To create a Canvas extension in your own project: Read the SDK docs — Run extensions_manage({ operation: "guide" }) in GitHub Copilot CLI to get the canonical documentation paths. Scaffold — Run extensions_manage({ operation: "scaffold", kind: "canvas", name: "my-canvas", location: "project" }) to generate the boilerplate. Implement — Edit extension.mjs with your canvas logic: state model, actions, renderer HTML, and SSE updates. Reload — Run extensions_reload to activate your changes. Drive — Open with open_canvas , invoke actions with invoke_canvas_action , and iterate. The canvas extension lives in .github/extensions/your-canvas/extension.mjs for project-scoped extensions, or in your user extensions directory for personal use. No package.json needed, the github/copilot-sdk import is auto-resolved. Key Takeaways Canvas is a development runtime, not a UI framework. You don't build Canvas instead of your UI, you use Canvas to figure out, test, and evolve the UI and system before and during building it. Canvas solves problems your final UI should never expose. Agent observability, fault injection, live state mutation, validation feedback loops, these are development concerns, not user concerns. Canvas is Human-to-AI-to-System collaboration. Both the developer and the AI agent operate on the same surface, the same state, the same running system. It's Figma-like collaboration, but with AI agents, and things actually execute. Canvas turns debugging, testing, and execution into a continuous visual feedback loop. Instead of switching between an editor, a terminal, a test runner, and a monitoring dashboard, you have one surface where the system lives and evolves. Canvas extensions are lightweight. A single extension.mjs file, no dependencies, loopback HTTP server with SSE, the infrastructure gets out of the way so you can focus on the system you're building. The Bigger Picture Canvas redefines software development by shifting from writing static code to orchestrating living systems. Developers and AI co-create, observe, and evolve solutions in real time. Instead of building UIs for users, we build interactive environments for agents, turning debugging, testing, and execution into a continuous, visual feedback loop that accelerates innovation and brings ideas to production faster than ever. The Multi-Agent Dev Canvas we built here is one example. The pattern applies anywhere you're building agent-driven systems: AI orchestration, workflow automation, data pipelines, autonomous services. Anywhere you need to see, steer, and validate a complex system as it runs, that's where Canvas belongs. Resources copilot-canvas-runtime — this repository: the Multi-Agent Dev Canvas extension, scenario, and demo prompt GitHub Copilot Documentation — Official documentation for GitHub Copilot features Microsoft Foundry Documentation — Build and deploy AI agents with Microsoft Foundry1.5KViews0likes0CommentsMCP for Beginners: Why Every AI Engineer and Developer Should Learn the Model Context Protocol
If you have spent any time building with large language models in the last year, you have hit the same wall everyone hits: your model is brilliant at reasoning but blind to the real world. It cannot read your database, call your internal API, search your documents, or trigger a deployment unless you hand-write glue code for every single integration. The Model Context Protocol (MCP) exists to tear that wall down, and Microsoft's open-source MCP for Beginners curriculum (reachable via the short link https://aka.ms/mcp-for-beginners) is the most complete, hands-on way to learn it. This post explains what MCP is, walks through the latest updates to the course, shows real code, and makes the case for why MCP belongs on your learning roadmap right now. Whether you are an AI engineer shipping agents to production, a developer wiring tools into Copilot, or a student trying to build a standout portfolio project. What is MCP, and why does it matter? Think of MCP as a universal translator for AI applications. Just as a USB-C port lets you connect any peripheral to any laptop without a custom cable per device, MCP lets an AI model connect to any tool or data source through one standardized protocol. The course uses exactly this analogy, and it holds up well. Before MCP, integrations were an M × N problem: every one of your M AI applications needed bespoke code to talk to each of your N tools. MCP turns that into an M + N problem. Build a tool once as an MCP server, and any MCP-compatible client, Claude Desktop, VS Code, Cursor, GitHub Copilot, and many others — can use it immediately. The protocol is built on a clean client–server model with a small set of primitives: Tools — functions the model can call (query a database, send an email, run code). Resources — data the server exposes for context (files, records, documents). Prompts — reusable, parameterized prompt templates. Sampling — a server asking the client's LLM to generate a completion, enabling collaborative workflows. Elicitation — a server requesting structured input from the user mid-task. Roots — boundaries that tell a server which directories or resources it is allowed to operate on. Communication runs over JSON-RPC, with transports for local processes ( stdio ) and remote servers (streamable HTTP). That standardization is the whole point: write to the spec, and you interoperate with the entire ecosystem. What's new: the latest updates to the course The MCP for Beginners curriculum is actively maintained, and the public changelog reads like a release log for a living product. Here are the most important recent changes, drawn directly from that changelog. 1. Aligned to MCP Specification The biggest update: the entire curriculum has been validated against the current MCP Specification 2025-11-25 and the latest official SDKs. Stale references to older spec revisions (2025-03-26 and 2025-06-18) were corrected across the security, transport, real-time search, sampling, and stdio-server modules, with links repointed to the canonical modelcontextprotocol.io spec paths. A gap analysis confirmed the course already covers every primitive introduced or expanded in the latest spec: Sampling — covered in lesson 3.14 and Advanced Topics. Elicitation (including URL mode) — in Core Concepts and Protocol Features. Roots — in the Introduction, Core Concepts, and Root Contexts. Tasks (experimental, long-running operations) — in Core Concepts and Protocol Features. Tool Annotations ( readOnlyHint / destructiveHint ) — in Core Concepts and Protocol Features. 2. Samples validated against current SDKs Code that does not run is worse than no code at all, so the maintainers re-validated the core samples: TypeScript: @modelcontextprotocol/sdk resolved to 1.29.0 ; a tsc --noEmit type-check passed with no errors — the McpServer and StdioServerTransport APIs remain valid. Python: validated in an isolated virtual environment with mcp[cli] (1.27.2); FastMCP.list_tools() correctly returned the sample add and subtract tools. SDK version pins across labs were bumped (for example mcp>=1.26.0 ) and lockfiles regenerated so every sample tracks the current release. 3. A serious security pass Security is treated as a first-class concern, not an afterthought. A full audit across every dependency manifest and the sample source code was run, and npm audit now reports 0 vulnerabilities in every audited directory. Highlights: Transitive npm advisories (in the MCP Inspector dev tool, the OpenAI client, and the SDK) were remediated by bumping @modelcontextprotocol/inspector to 0.22.0 and pinning a patched shell-quote . A real code-level command-injection fix (OWASP A03): an open_in_vscode tool that used subprocess.run(..., shell=True) was rewritten to launch the resolved executable directly with no shell — closing a metacharacter-injection vector. Python dependencies were audited with pip-audit , and a vulnerable transitive werkzeug was pinned to a patched >=3.1.6 . For anyone learning to ship agents, this is gold: the course demonstrates the whole secure-development loop, not just the happy path. 4. New lessons and a growing curriculum The curriculum keeps expanding with practical, modern lessons: 5.17 Adversarial Multi-Agent Reasoning — two agents argue opposite sides of a question using shared MCP tools ( web_search + run_python ), judged by a third agent. Includes a Mermaid architecture diagram, orchestrators in Python, TypeScript, and C#, and use cases like hallucination detection, threat modeling, and API design review. 3.12 MCP Hosts — configuration for Claude Desktop, VS Code, Cursor, Cline, and Windsurf, with JSON templates and a transport comparison table. 3.13 MCP Inspector — a debugging guide for testing tools, resources, and prompts. 4.1 Pagination — cursor-based pagination patterns in Python, TypeScript, and Java. 5.16 Protocol Features — progress notifications, request cancellation, resource templates, and lifecycle management. 5. Microsoft product rebranding Content was updated to reflect Microsoft's rebranding: Azure AI Foundry → Microsoft Foundry, and the AI Toolkit (AITK) → Microsoft Foundry Toolkit Extension for VS Code. If you have seen older tutorials referencing the previous names, the curriculum is now current. Your first MCP server: see how little code it takes The course's "first server" lesson builds a simple calculator. Here is the shape of a minimal MCP server in Python using FastMCP , which mirrors the validated sample in the repo. Notice how the protocol plumbing disappears — you just decorate functions. # server.py — a minimal MCP server with two tools from mcp.server.fastmcp import FastMCP # Name your server; this identifies it to MCP clients mcp = FastMCP("Calculator") @mcp.tool() def add(a: int, b: int) -> int: """Add two numbers and return the result.""" return a + b @mcp.tool() def subtract(a: int, b: int) -> int: """Subtract b from a and return the result.""" return a - b if __name__ == "__main__": # Run over stdio so local hosts (VS Code, Claude Desktop) can connect mcp.run() The same idea in TypeScript, using the official SDK validated at version 1.29.0 : // server.ts — minimal MCP server in TypeScript import { McpServer } from "@modelcontextprotocol/sdk/server/mcp.js"; import { StdioServerTransport } from "@modelcontextprotocol/sdk/server/stdio.js"; import { z } from "zod"; const server = new McpServer({ name: "Calculator", version: "1.0.0" }); // Register a tool with a typed input schema server.tool( "add", { a: z.number(), b: z.number() }, async ({ a, b }) => ({ content: [{ type: "text", text: String(a + b) }], }) ); // Connect over stdio and start listening const transport = new StdioServerTransport(); await server.connect(transport); That is a complete, runnable server. The docstrings and schemas matter: MCP exposes them to the model so it knows when and how to call each tool. Clear descriptions are effectively prompt engineering for your tools — a common pitfall is leaving them vague, which leads to the model misusing or ignoring the tool. Connecting it in VS Code Once your server runs, an MCP host connects to it. A typical VS Code / host configuration looks like this: { "servers": { "calculator": { "command": "python", "args": ["server.py"] } } } Lesson 3.12 (MCP Hosts) covers the equivalent JSON for Claude Desktop, Cursor, Cline, and Windsurf, and lesson 3.13 shows how to use the MCP Inspector to test your tools before wiring them into a host — the single best debugging habit you can build early. How the course is structured The curriculum is organized as a progressive journey with hands-on code in C#, Java, JavaScript, Python, Rust, and TypeScript. It is grouped into phases: Foundations (Modules 0–2): Introduction, Core Concepts, and Security. Building (Module 3): Getting Started — 15 lessons covering your first server and client, LLM clients, VS Code integration, stdio and HTTP streaming, testing, deployment, auth, hosts, the Inspector, sampling, and MCP Apps. Growing (Modules 4–5): Practical Implementation and Advanced Topics — 17 advanced lessons including Azure integration, OAuth2, Entra ID auth, scaling, multi-modality, context engineering, custom transports, and adversarial multi-agent reasoning. Mastery (Modules 6–11): Community Contributions, Lessons from Early Adoption, Best Practices, Case Studies, a Microsoft Foundry Toolkit workshop, and an end-to-end 13-lab PostgreSQL capstone. That final module is the standout for portfolio building: a complete, production-flavored path that takes you from architecture and row-level security through database design, a FastMCP server, semantic search with pgvector and Azure OpenAI, testing, Docker deployment to Azure Container Apps, and monitoring with Application Insights. Why developers should learn MCP now For AI engineers MCP is becoming the default integration layer for agents. Instead of re-implementing tool calling for every framework, you write to one open protocol and your tools work everywhere. The advanced modules — sampling, roots, elicitation, scaling, routing, and adversarial multi-agent patterns — are exactly the techniques you need to move agents from demo to production. For developers MCP is already wired into tools you use daily: VS Code, GitHub Copilot, Claude Desktop, Cursor, and more. Learning to build an MCP server means you can expose your systems — internal APIs, databases, CI/CD — to AI assistants safely. The security-first approach in the course (OAuth2, Entra ID, RBAC, dependency auditing) teaches you to do this the right way from day one. For students MCP is a rare opportunity to learn a technology while it is still early, with a free, beginner-friendly, Microsoft-maintained curriculum and code in six languages. The 13-lab capstone alone is a genuine portfolio project. And with content translated into 50+ languages, the barrier to entry is low no matter where you are. Responsible and secure by design A recurring theme worth calling out: the course does not treat security and governance as optional extras. It models real practices you should carry into your own work: Least privilege via roots — constrain what a server can touch. Tool annotations — mark tools readOnlyHint or destructiveHint so clients can warn users before destructive actions. No shells for user input — the command-injection fix is a textbook example of why you never pass untrusted input through a shell. Dependency hygiene — audit with npm audit and pip-audit , and pin patched releases. Proper auth — dedicated lessons on OAuth2 and Microsoft Entra ID. Key takeaways MCP standardizes how AI connects to tools and data, turning a combinatorial integration problem into a simple, reusable one. The course is current, validated against MCP Specification 2025-11-25 with SDKs at TypeScript 1.29.0 and Python mcp 1.27.2 . Samples actually run, and the repo demonstrates a full secure-development loop with 0 reported vulnerabilities after auditing. It is broad and deep: from a 10-line calculator server to a 13-lab production capstone, in six languages. It is the fastest credible path to MCP fluency for AI engineers, developers, and students alike. Get started today Open the course: https://aka.ms/mcp-for-beginners (redirects to the GitHub repository). Fork and clone it — use a sparse checkout to skip translations for a faster download: git clone --filter=blob:none --sparse https://github.com/microsoft/mcp-for-beginners.git cd mcp-for-beginners git sparse-checkout set --no-cone "/*" "!translations" "!translated_images" Build your first server with lesson 3.1 in your language of choice. Debug it with the MCP Inspector, then connect it in VS Code. Go deep with the 13-lab database capstone, and read the official spec at modelcontextprotocol.io. Track what's new in the changelog and join the community discussions. MCP is quietly becoming the connective tissue of the AI ecosystem. The earlier you learn it, the more leverage you will have — and Microsoft's MCP for Beginners is the clearest on-ramp available. Star the repo, build a server this week, and start connecting your AI to the world.