azure
8173 TopicsMicrosoft Industrial AI Partner Guide: Choosing the Right Data Expertise for Every Stage
As organizations scale Industrial AI, the challenge shifts from technology selection to deciding who should lead which part of the journey -- and when. Which partners should establish secure connectivity? Who enables production grade, AI ready industrial data? When do systems integrators step in to scale globally? This Partner Guide helps customers navigate these decisions with clarity and confidence: Identify which partners align to their current digital transformation and Industrial AI scenarios leveraging Azure IoT and Azure IoT Operations Confidently combine partners over time as they evolve from connectivity to intelligence to autonomous operations This guide focuses on the Industrial AI data plane – the partners and capabilities that extract, contextualize, and operationalize industrial data so it can reliably power AI at scale. It does not attempt to catalog or prescribe end‑to‑end Industrial AI applications or cloud‑hosted AI solutions. Instead, it helps customers understand how industrial partners create the trusted, contextualized data foundation upon which AI solutions can be built. Common Customer Journey Steps 1. Modernize Connectivity & Edge Foundations The industrial transformation journey starts with securely accessing operational data without touching deterministic control loops. Customers connect automation systems to a scalable, standards-based data foundation that modernizes operations while preserving safety, uptime and control. Outcomes customers realize Standardized OT data access across plants and sites Faster onboarding of legacy and new assets Clear OT–IT boundaries that protect safety and uptime Partner strengths at this stage Industrial hardware and edge infrastructure providers Protocol translation and OT connectivity Automation and edge platforms aligned with Azure IoT Operations 2. Accelerate Insights with Industrial AI With a consistent edge-to-cloud data plane in place, customers move beyond dashboards to repeatable, production-grade Industrial AI use cases. Customers rely on expert partners to turn standardized operational data into AI‑ready signals that can be consumed by analytics and AI solutions at scale across assets, lines, and sites. Outcomes customers realize Improved Operational efficiency and performance Adaptive facilities and production quality intelligence Energy, safety, and defect detection at scale Partner strengths at this stage Industrial data services that contextualize and standardize OT signals for AI consumption Domain-specific acceleration for common Industrial AI scenarios Data pipelines integrated with Azure IoT Operations and Microsoft Fabric 3. Prepare for Autonomous Operations As organizations advance toward closed‑loop optimization, the focus shifts to safe, scalable autonomy. Customers depend on partners to align data, infrastructure, and operational interfaces, while ensuring ongoing monitoring, governance, and lifecycle management across the full operational estate. Outcomes customers realize Proven reference architectures deployed across plants AI‑ready data foundations that adapt as operations scale Coordinated interaction between OT systems, AI models, and cloud intelligence Partner strengths at this stage Industrial automation leadership and control system expertise Edge infrastructure optimized and ready for Industrial AI scale Systems integrators enabling end‑to‑end implementation and repeatability Data Intelligence Plane of Industrial AI - Partner Matrix This matrix highlights which partners have the deepest expertise in accessing, contextualizing, and operationalizing industrial data so it can reliably power AI at scale. The matrix is not a catalog of end‑to‑end Industrial AI applications; it shows how specialized partners contribute data, infrastructure, and integration capabilities on a shared Azure foundation as organizations progress from connectivity to insight to autonomous operations. How to use this matrix: Start with your scenario → identify primary partner types → layer complementary partners as you scale. Partner Type Adaptive Cloud Primary Solution Example Scenarios Geography Advantech Industrial Hardware, Industrial Connectivity LoRaWAN gateway integration + Azure IoT Operations Industrial edge platforms with built in connectivity, industrial compute, LoRaWAN, sensor networks Global Accenture GSI Industrial AI, Digital Transformation, Modernization OEE, predictive maintenance, real-time defect detection, optimize supply chains, intelligent automation and robotics, energy efficiency Global Avanade GSI Factory Agents and Analytics based on Manufacturing Data Solutions Yield / Quality optimization, OEE, Agentic Root Cause Analysis and process optimization; Unified ISA-95 Manufacturing Data estate on MS Fabric Global Belden Industrial Connectivity, Networking, Security Belden Horizon Data Operations (BHDO) + LioN-X with Azure IoT Operations OT-IT convergence, network orchestration and monitoring, ruggedized ethernet and switching, industrial WiFi, multi-vendor protocol connectivity, OT security, OPC UA Global Capgemini GSI The new AI imperative in manufacturing OEE, maintenance, defect detection, energy, robotics Global DXC GSI Intelligent Boost AI and IoT Analytics Platform 5G Industrial Connectivity, Defect detection, OEE, safety, energy monitoring Global Innominds SI Intelligent Connected Edge Platform Predictive maintenance, AI on edge, asset tracking North America, EMEA Litmus Automation Industrial Connectivity, Industrial Data Ops Litmus Edge + Azure IoT Operations Edge Data, Smart manufacturing, IIoT deployments at scale Global, North America Mesh Systems GSI & ISV Azure IoT & Azure IoT Operations implementation services and solutions (including Azure IoT Operations-aligned connector patterns) Device connectivity and management, data platforms, visualization, AI agents, and security North America, EMEA Nortal GSI Data-driven Industry Solutions IT/OT Connectivity, Unified Namespace, Digital Twins, Optimization, Edge, Industrial Data, Real‑Time Analytics & AI EMEA, North America & LATAM NVIDIA Technology Partner Accelerated AI Infrastructure; Open libraries, models, frameworks, and blueprints for AI development and deployment. Cross industry digitalization and AI development and deployment: Generative AI, Agentic AI, Physical AI, Robotics Global Oracle ISV Oracle Fusion Cloud SCM + Azure IoT Operations Real-time manufacturing Intelligence, AI powered insights, and automated production workflows Global Rockwell Automation Industrial Automation FactoryTalk Optix + Azure IoT Operations Factory modernization, visualization, edge orchestration, DataOps with connectivity context at scale, AI ops and services, physical equipment, MES Global Schneider Electric Industrial Automation Industrial Edge Physical equipment, Device modernization, energy, grid Global Siemens Industrial Automation & Software Industrial Edge + Azure IoT Operations reference architecture Industrial edge infrastructure at scale, OT/IT convergence, DataOps, Industrial AI suite, virtualized automation. Global Sight Machine ISV Integrated Industrial AI Stack Industrial AI, bottling, process optimization Global Softing Industrial Industrial Connectivity edgeConnector + Azure IoT Operations OT connectivity, multi-vendor PLC- and machine data integration, OPC UA information model deployment EMEA, Global TCS GSI Sensor to cloud intelligence Operations optimization, healthcare digital twin experiences, supply chain monitoring Global This Ecosystem Model enables Industrial AI solutions to scale through clear roles, respected boundaries and composable systems: Control systems continue to be driven by automation leaders Safety‑critical, deterministic control stays with industrial automation partners who manage real‑time operations and plant safety. Customers modernize analytics and AI while preserving uptime, reliability, and operational integrity. Data, AI, and analytics scale independently A consistent edge to cloud data plane supports cloud scale analytics and AI, accelerating insight delivery without entangling control systems or slowing operational change. This separation allows customers and software providers to build AI solutions on top of a stable, industrial‑grade data foundation without redefining control system responsibilities. Specialized partners align solutions across the estate Partners contribute focused expertise across connectivity, analytics, security, and operations, assembling solutions that reduce integration risk, shorten deployment cycles, and speed time to value across the operational estate. From vision to production Industrial AI at scale depends on turning operational data into trusted, contextualized intelligence safely, repeatably, and across the enterprise. This guide shows how industrial partners, aligned on a shared Azure foundation, create the data plane that enables AI solutions to succeed in production. When data is ready, intelligence scales. Call to action: Use this guide to identify the partners and capabilities that best align to your current Industrial AI needs and take the next step toward production‑ready outcomes on Azure.1.9KViews4likes0CommentsMeet the IQ's: How Microsoft is Creating Context-Aware AI
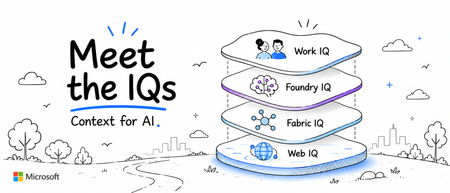
Microsoft Architect's: Allison Rose allisonrose, Lavanya Sreedhar LavanyaSreedhar, Tom Dinh Tom-Dinh, Oviya Soundararajan oviyasound and Rafia Aqil Rafia_Aqil The AI era demands more than powerful language models. It demands context a deep understanding of what enterprise data means, how it connects, and how AI systems can reason and act on it intelligently. Microsoft has been building the foundational intelligence layer that makes this possible: a family of capabilities collectively known as the IQ Platform. The Microsoft IQ Platform is not a single product but a set of complementary intelligence layers: Work IQ, Fabric IQ, Foundry IQ and Web IQ each designed to inject rich contextual understanding into a different part of the enterprise technology stack. Together, they represent Microsoft’s strategic vision for how AI can move beyond isolated answers and become a true operating system for organizational intelligence. This article unpacks each IQ, explains the problems they solve, and explores how they work together to power the next generation of AI-driven enterprise workflows. How the IQs Work Together? Work IQ, Fabric IQ, Foundry IQ, and Web IQ are not competing products or overlapping investments. They are complementary intelligence layers designed to operate across different contexts within the enterprise, and they are most powerful when combined. Work IQ brings the intelligence of Microsoft 365 to every agent and Copilot experience- connecting people, conversations, documents, and organizational signals into a semantic layer that understands how work happens. Fabric IQ brings the intelligence of enterprise data and business context- teaching AI not just what the data says, but what it means in the language of your business: entities, relationships, rules, and governed actions. Foundry IQ brings the infrastructure intelligence that enables all of this to scale- eliminating the undifferentiated plumbing of agentic AI and letting teams focus on building the workflows that actually differentiate their business. Web IQ brings fresh, external web context, helping agents consider current and relevant public information alongside the knowledge and business context inside the organization. Microsoft Web IQ grounds most of the top AI platforms, including Copilot and ChatGPT. Together, the IQ platform represents Microsoft’s answer to one of the defining challenges of the AI era: not just making AI more capable, but making AI contextually aware-grounded in the real knowledge, relationships, and intent of your organization. Fabric IQ: Teaching AI the Language of Business Microsoft Fabric is an end-to-end, unified data analytics platform centered on OneLake- a centralized data lake that stores all analytical and operational business data in open Delta format. Because every Fabric compute experience (Data Engineering, Data Warehouse, Data Factory, Power BI, and Real-Time Intelligence) natively reads from OneLake, organizations gain a single source of truth without copying or duplicating data. OneLake also provides mirroring and shortcut capabilities so existing data can be accessed in place, wherever it lives. Most organizations have made significant progress consolidating their data. The harder challenge is giving AI- and the people who use it-the ability to reason about that data in business terms, not technical ones. Outside of data professionals, businesses do not talk about tables or schemas. They talk about entities that matter to them. Fabric organizes data. Fabric IQ teaches AI what that data means. Three Layers of Business Context Fabric IQ introduces three intelligence layers that together create a unified, contextually rich environment for enterprise AI: Unified Data Layer: Delivered through OneLake and the OneLake Catalog, this provides a single source of truth for all structured and unstructured data across the organization. Business Intelligence Layer: Delivered through Power BI Semantic Models, this layer provides curated measures, hierarchies, dimensions, and trusted KPIs- translating raw data into the analytical language of your business. Operational Intelligence Layer: This is where Fabric IQ’s most distinctive capability lives: Ontology. An Ontology is a model of your business- a graph of entities (such as Patient, Provider, Product, or Account), the relationships between them, the business rules that govern them, and the actions AI agents can take. It functions as the brain that enables AI to understand business context and act on it in a governed, explainable way. Together, these three layers create shared context across all business data stored in OneLake-enabling modern businesses, people, and AI to operate as one unified system. A Real-World Example: Healthcare Consider a care management executive asking: “Which diabetic patients discharged in the last 30 days are at high risk of readmission because they missed follow-up appointments, had medication adherence issues, and recently visited the Emergency Department?” Without Fabric IQ, answering this requires analysts to manually join EHR data, appointment systems, pharmacy records, and ED utilization data- writing SQL across multiple datasets and validating business logic with clinicians. It is slow, brittle, and error-prone. Semantic models can curate data for reporting and analysis, but they do not provide enterprise-scale context integration. With Fabric IQ, an Ontology can be created with entities like Patient, Encounter, Provider, Medication, Diagnosis, Appointment, and Care Plan- each bound to Lakehouse tables, Eventhouse tables, or Materialized Views. Relationships describe how patients connect to their diagnoses, medications, appointments, and treating providers. Business rules enforce data quality, identifying missed follow-ups, recent Emergency visits, and medication gaps. The result is a shift from siloed analytics to true system-level intelligence- an organization where data, AI, and people operate from a shared understanding of the business. Foundry IQ: From Infrastructure to Intelligence Building production-grade AI agents has traditionally meant writing a significant amount of undifferentiated plumbing, custom retrieval pipelines, memory systems, ranking logic, and orchestration code just to enable core RAG and agentic capabilities. While powerful, this approach often leads to complex, hard-to-maintain codebases that distract from the real goal: solving domain-specific problems. With Foundry IQ, Microsoft is fundamentally changing that model by turning these underlying capabilities into managed platform services, allowing teams to shift from building infrastructure to focusing on intelligent workflows. Foundry IQ acts as part of Microsoft's managed platform, enabling agents to use agentic reasoning to access, process, and act on knowledge from anywhere. It is Microsoft Foundry’s way of turning the undifferentiated plumbing behind a RAG agent, such as retrieval, ranking, citations, memory, and personalization, into managed, server-side services that you provision once and call through clean interfaces. Foundry IQ allows you to remove the infrastructure you never wanted to own in the first place. What This Means in Practice Instead of stitching together retrieval pipelines, embedding logic, ranking strategies, and memory mechanisms, Foundry IQ centralizes these capabilities into a single, opinionated platform layer that agents can directly consume. Developers no longer design and maintain each component individually. The knowledge base becomes the centerpiece of the workflow. Rather than coordinating multiple services and response handlers, applications make a single call to retrieve grounded context. Vector-semantic-hybrid querying, query planning, semantic ranking, and citation generation are all encapsulated within the provisioned knowledge base-with no retrieval or embedding logic to maintain in the client application. Memory follows the same pattern of abstraction. Instead of multiple classes and helper utilities to manage storage, user profiles, summarization, and context reconstruction, Foundry IQ replaces this entire layer with a single memory provider backed by a service-managed store with built-in capabilities for chat summarization and user-profile extraction. A Real-World Example: Clinical Workflows Consider building an AI-powered clinical workflow application. Previously, features like agent memory, knowledge base retrieval for grounding, and personalization all had to be written as custom logic and wired manually into the application. This resulted in thousands of lines of code, numerous helper functions, and brittle architecture that was difficult to evolve. With Foundry IQ, that same solution can be reimagined. A single provisioning script now stands up all required services and executes the data-plane steps to create a memory store, build the search index, and provision a Foundry IQ knowledge base for agentic retrieval. Because the top-level router agent carries its own memory, it can directly answer recalled context without relying on confidence thresholds, rule-based branching, or forced workflow paths. Conversation history is handled automatically at ingress- no custom thread management system required. What remains is only what was always worth building: domain-specific logic. Citation validation against grounded evidence. Hallucination checking using LLM-as-a-judge patterns. Agent revision loops. Everything else- retrieval, ranking, memory, user profiles, conversation management- is provisioned once and consumed as a platform capability. The result: a dramatically reduced surface area for bugs, significantly less code to maintain, and teams freed to focus entirely on the work that differentiates their product. Work IQ: Making Microsoft 365 Data Meaningful For years, Microsoft has given organizations API access to their Microsoft 365 data through the Microsoft Graph- emails, calendar events, OneDrive files, Teams conversations, and more. While valuable, this access essentially treated M365 as a structured database: query an endpoint, retrieve an artifact, parse the metadata. The problem was volume and context. With thousands of signals generated every day across the organization, customers needed a way to extract not just data but meaning. In the past year, Microsoft introduced a semantic index built on top of that raw M365 data- a layer that understands not just what exists in your ecosystem, but how everything relates to one another. This intelligence layer is Work IQ, and in an increasingly agent-driven world, it fundamentally changes what AI can do for your organization. In an AI-first world, the advantage is not simply in a model’s ability to reason- it’s in the richness of the context it can reason over. The Contrast in Action Consider asking an agent a simple question: “What’s the latest on Customer Contoso?” With the Microsoft Graph API alone, the agent must stitch together multiple endpoint queries- Teams chats, SharePoint documents, email threads and attempt to piece the results into a coherent answer. It lacks any connective tissue. It doesn’t know what’s relevant, what’s meaningful, or how these isolated data sources relate to each other. The burden of reasoning falls entirely on the agent. With Work IQ, that same prompt taps into a semantic layer that has already done the connecting. The agent knows Contoso-related details span a specific SharePoint folder, identifies the active Teams channel for progress tracking, and surfaces the key people involved. The response is grounded in a web of contextual relationships not just retrieved data. Three Core Components Work IQ is enabled by three powerful components: Data: Unifies signals from files, emails, meetings, chats, and other M365 business systems to capture how work actually gets done across your organization. Memory: Enables persistent context about how people and teams work: details inferred from past conversations, explicit memories stored with Copilot, and custom instructions you’ve configured. Each interaction allows Copilot to learn more about your priorities, preferences, and working style. Inference: Brings together skills, models, and tools to move work forward. It goes beyond understanding your work to deciding what should happen next. Data captures and indexes your M365 knowledge. Memory builds a personalized understanding of how you work. Inference translates this into action. Think of Work IQ as a specialized brain trained on who you are at work within the full context of what your organization knows. Web IQ: Bringing Real-World Intelligence into Agent Context An agent can understand your business and still miss information that matters outside it. For teams researching an account, investigating a supply-chain issue, or comparing products, internal knowledge is only part of the picture. The missing context may be on a company website, in a public announcement, or in newly published guidance. Web IQ is the part of Microsoft IQ that brings in outside information. It's a set of web search and grounding APIs that give agents current evidence from the web, beyond what the model learned in training and beyond a company's internal systems. Web IQ gives developers a way to ground AI applications and agents in fresh web content through Microsoft-hosted REST and MCP interfaces. An application can retrieve current, external information when it needs it, rather than relying only on the knowledge captured during model training. Web IQ supplies the grounding content; the application determines how to combine it with other context and use it in a response. This adds a distinct dimension to the IQ story: Information beyond the organization. The goal is not to replace trusted internal knowledge, but to help people examine it alongside current, relevant external evidence. Source links keep that evidence available for review, so users can check the information behind an answer. A Real-World Example: Sales Preparation Consider a seller preparing for a customer conversation. Work IQ might explain the relationship, outstanding commitments, and business priorities, and Web IQ could contribute public context, such as a recent company announcement. Bringing these inputs together in an agent could help the seller identify a more timely question to ask, while preserving the distinction between internal account information and external evidence. Get Started Whether you’re exploring how to ground your AI applications in richer organizational context, looking to reduce the infrastructure burden of building intelligent agents, seeking to make your enterprise data more actionable, or aiming to ground agents in current web information, the Microsoft IQ Platform offers a path forward. We encourage you to explore the Microsoft Fabric documentation, Azure AI Foundry resources, the Microsoft 365 developer platform, and the Web IQ documentation to learn more about how each IQ capability can fit into your architecture. Build Microsoft IQ powered agents, this cookbook walks through it step by step: files → Web IQ → Work IQ → Fabric IQ → MCP endpoint: https://lnkd.in/edrjG99F Select Microsoft IQ in your Copilot agent settings, follow step by step instructions here: Bring your enterprise data to every agent conversation We’d love to hear how you’re thinking about context-aware AI in your organization. Share your thoughts and questions in the comments below. Links: Microsoft IQ | Unified Enterprise Intelligence for AI Work IQ overview | Microsoft Learn What is Foundry IQ? - Microsoft Foundry | Microsoft Learn Fabric IQ documentation - Microsoft Fabric | Microsoft Learn Microsoft Web IQ documentation and Quick Start | Microsoft Web IQ1.8KViews3likes1CommentHow to Re-Register MFA
Working closely with nonprofits every day, I often come across a common challenge faced by MFA users. Recently, I worked with a nonprofit leader who faced an issue after getting a new phone. She was unable to authenticate into her Microsoft 365 environment because her MFA setup was tied to her old device. This experience highlighted how important it is to have a process in place for MFA re-registration. Without it, even routine changes like upgrading a phone can disrupt access to your everyday tools and technologies, delaying important work such as submitting a grant proposal. Why MFA is Essential for Nonprofits Before we discuss how to reset MFA, let’s take a step back and discuss why MFA is a necessity for nonprofits the way it is important for any organization. In the nonprofit world, protecting sensitive or confidential data—like donor information, financial records, and program details—is a top priority. One of the best ways to step up your security game is by using Multi-Factor Authentication (MFA). MFA adds an extra layer of protection on top of passwords by requiring something you have (like a mobile app or text message) or something you are (like a fingerprint). This makes it a lot harder for cybercriminals to get unauthorized access. If your nonprofit uses Azure Active Directory (AAD), or Microsoft Entra (as it is now called), with Microsoft 365, MFA can make a big difference in keeping your work safe. Since Microsoft Entra is built to work together with other Microsoft tools, it’s easy to set up and enforce secure sign-in methods across your whole organization. To make sure this added protection stays effective, it’s a good idea to occasionally ask users to update how they verify their identity. What Does MFA Re-Registration Mean for Nonprofits? MFA re-registration is just a fancy way of saying users need to update or reset how they authenticate, or verify, themselves. This might mean setting up MFA on a new phone (like the woman in the scenario above), adding an extra security option (like a hardware token), or simply confirming their existing setup. It’s all about making sure the methods and devices your users rely on for MFA are secure and under their control. When and Why Should Nonprofits Require MFA Re-Registration? Outside of getting a new phone, there may be other situations that raise cause for reason to re-register your MFA. A few scenarios include: Lost or Stolen Devices: Similar to the scenario above, if someone loses their phone or it gets stolen, you will have to re-register the new device. Role Changes: If someone’s responsibilities change, their MFA setup can be adjusted to match their new access needs. Security Enhancements: Organizations may require users to re-register for MFA to adopt more secure authentication methods, such as moving from SMS-based MFA to an app-based MFA like Microsoft Authenticator Policy Updates: When an organization updates its security policies, it might require all users to re-register for MFA to comply with new standards Account Compromise: If there is a suspicion that an account has been compromised, re-registering for MFA can help secure the account by ensuring that only the legitimate user has access With Microsoft Entra, managing MFA re-registration is straightforward and can be done with an administrator to the organization’s tenant. How to require re-registration of MFA To reset or require re-registration of MFA in Microsoft Entra, please follow the steps below. Navigate to portal.azure.com with your nonprofit admin account. Select Microsoft Entra ID Select the drop-down for Manage In the left-hand menu bar select Users > Select the user's name that you want to reregister to MFA (not shown). Once in their profile, select Manage MFA authentication methods Select Require re-register multifactor authentication Congratulations! The user will now be required to re-register the account in the Microsoft Authentication app.8.9KViews3likes2Comments
Windows Server Administrator Associate AZ-802 curated learning path
Hi there, Can someone point me in the right direction for AZ-802 exam preparation? I've been trying to use Microsoft Learn to study for AZ-802 (Administering Windows Server), but I keep running into the same issue: I can find the exam objectives, but not a clear, end-to-end learning path. I found the official study guide: https://learn.microsoft.com/en-ca/credentials/certifications/resources/study-guides/az-802 The problem is that it only outlines the exam topics. From there, am I supposed to manually search Microsoft Learn for content covering each objective? That feels pretty fragmented and difficult to organize into a study plan. Is there a single page or learning path that consolidates all the relevant Microsoft Learn content for AZ-802? Any recommendations would be greatly appreciated.223Views0likes5CommentsEntra External ID email OTP send event requestType always set to "signIn" regardless of user action
Hi, In a recent workload, I'm assisting a client with implementation of Entra External ID for identity management and app authentication, which includes sending OTP codes with customized email templates. To accomplish this, a custom authentication extension has been created that authorizes the request and then communicates with an email service via an event-driven, loosely coupled architecture. While implementing and testing this feature together with the client, we noticed that it seems like the different modes or states in the user flows are not reflected in the requestType property in the request payload posted to the OnOtpSend auth extension configured. E.g., if a user tries to sign in but has forgotten their password and navigates to the password reset view and requests to send the OTP code to their email address to reset the password, the following payload is sent to the auth extension endpoint (the original payload below was logged with Application Insights, with identifiers below then redacted and formatted, otherwise intact): { "type": "microsoft.graph.authenticationEvent.emailOtpSend", "source": "/tenants/aaaaaaaa-bbbb-cccc-dddd-eeeeeeeeeeee/applications/11111111-2222-3333-4444-555555555555", "data": { "@odata.type": "microsoft.graph.onOtpSendCalloutData", "otpContext": { "identifier": "email address removed for privacy reasons", "oneTimeCode": "<REDACTED>" }, "tenantId": "aaaaaaaa-bbbb-cccc-dddd-eeeeeeeeeeee", "authenticationEventListenerId": "22222222-3333-4444-5555-666666666666", "customAuthenticationExtensionId": "33333333-4444-5555-6666-777777777777", "authenticationContext": { "correlationId": "44444444-5555-6666-7777-888888888888", "client": { "ip": "192.0.2.10", "locale": "en-gb", "market": "en-gb" }, "protocol": "UNDEFINED", "requestType": "signIn", "clientServicePrincipal": { "id": "55555555-6666-7777-8888-999999999999", "appId": "11111111-2222-3333-4444-555555555555", "appDisplayName": "Example Web App", "displayName": "Example Web App" }, "resourceServicePrincipal": { "id": "55555555-6666-7777-8888-999999999999", "appId": "11111111-2222-3333-4444-555555555555", "appDisplayName": "<client-app-name>-Web", "displayName": "<client-app-name>-Web" } } } } The above payload was captured using browser-based authentication (native auth is not used), with the below parameters passed (identifiers, tenant name etc. redacted, otherwise intact): https://example.ciamlogin.com/ aaaaaaaa-bbbb-cccc-dddd-eeeeeeeeeeee/oauth2/v2.0/authorize ?response_type=code &client_id=11111111-2222-3333-4444-555555555555 &redirect_uri=https%3A%2F%2Fexample.com%2Fsignin%2Fcallback%2F &scope=openid+profile+email &state=<REDACTED> &prompt=login &ui_locales=de-DE &mkt=de-DE &nonce=<REDACTED> &code_challenge=<REDACTED> &code_challenge_method=S256 Following having navigated to the authorize endpoint above, the issue can be reproduced by entering an email address or an existing user identity, then on the password entry view, press the “Forgot Password?” link under the password input field, and then press the button/element “Email code to <user-email>”. I have looked at using the requestType in the email OTP send event payload to determine which email template and email content are used as per client requirement, but noted that the requestType seemingly always contains the value "signIn" even if the OTP code was sent as part of a password reset operation. At first glance, it would seem like this property indicates which step in the UI the user is currently at, even though I’m not certain whether that is what the property is actually meant to represent or indicate or not. However, for the above scenario and requirement, some identifier or value indicating the action would be needed in order to tailor the email content. The alternatives to having a reliable context property in the payload to indicate user action would require more or less significant additional components and infrastructure, thus increasing the complexity of the solution. Based on its name and values, it would seem like the requestType property appears be a good candidate to carry a user action context identifier. A suitable alternative solution has been adopted currently, using a generalized OTP template, which works well, but the requirement that it would be preferable to tailor the content based on user context and intent, e.g., whether the request was triggered as part of a password reset action or for another authentication scenario, is still present, ideally via the event payload sent from Entra External ID to the auth extension. If there would be any further/follow-up questions on the above, e.g., to clarify the requirement, or further explain the reproduction steps and behaviour observed, or anything else, please tell, and I'll ensure to get back as soon as possible. Also, would someone have some input on potential other/additional ways to make the requestType include a context identifier, that would be much appreciated as well, thanks! Regards Kristoffer37Views0likes0CommentsThe Complete Guide to Azure Databricks Cost Optimization
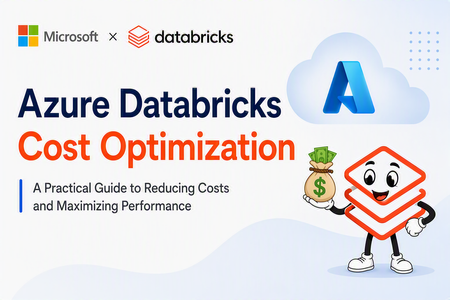
Co-Authored by: Aladdin Alchalabi AladdinAlchalabi, Sanjeev Nair Sanjeev Nair and Rafia Aqil Rafia_Aqil This guide walks through a proven approach to Azure Databricks cost optimization, structured in three phases: 1. Discovery, 2. Cluster/Data/Code Best Practices, and 3. Team Alignment & Next Steps. Phase 1: Discovery Assessing Your Current State The following questions are designed to guide your initial assessment and help you identify areas for improvement. Documenting answers to each will provide a baseline for optimization and inform the next phases of your cost management strategy. Environment & Organization Cluster Management Cost Optimization Data Management Performance Monitoring Future Planning What is the current scale of your Databricks environment? How many workspaces do you have? How are your workspaces organized (e.g., by environment type, region, use case)? How many clusters are deployed? How many users are active? What are the primary use cases for Databricks in your organization? Data engineering Data science Machine learning Business intelligence How are clusters currently managed? Manual configuration Automated scripts Databricks REST API Cluster policies What is the average cluster uptime? Hours per day Days per week What is the average cluster utilization rate? CPU usage Memory usage What is the current monthly spend on Databricks? Total cost Breakdown by workspace Breakdown by cluster What cost management tools are currently in use? Azure Cost Management Third-party tools Are there any existing cost optimization strategies in place? Reserved instances Spot instances Cluster auto-scaling What is the current data storage strategy? Data lake Data warehouse Hybrid What is the average data ingestion rate? GB per day Number of files What is the average data processing time? ETL jobs Machine learning models What types of data formats are used in your environment? Delta Lake Parquet JSON CSV Other formats relevant to your workloads What performance monitoring tools are currently in use? Databricks Ganglia Azure Monitor Third-party tools What are the key performance metrics tracked? Job execution time Cluster performance Data processing speed Are there any planned expansions or changes to the Databricks environment? New use cases Increased data volume Additional users What are the long-term goals for Databricks cost optimization? Reducing overall spend Improving resource utilization & cost attribution Enhancing performance Understanding Databricks Cost Structure Total Cost = Cloud Cost + DBU Cost Cloud Cost: Compute (VMs, networking, IP addresses), storage (ADLS, MLflow artifacts), other services (firewalls), cluster type (serverless compute, classic compute) DBU Cost: Workload size, cluster/warehouse size, photon acceleration, compute runtime, workspace tier, SKU type (Jobs, Delta Live Tables, All Purpose Clusters, Serverless), model serving, queries per second, model execution time Diagnose Cost and Issues Effectively diagnosing cost and performance issues in Databricks requires a structured approach. Use the following steps and metrics to gain visibility into your environment and uncover actionable insights. 1. Identify Costly Workloads Account Console Usage Reports: Review usage reports to identify usage breakdowns by product, SKU name, and custom tags. Usage Breakdown by Product and SKU: Helps you understand which services and compute types (clusters, SQL warehouses, serverless options) are consuming the most resources. Custom Tags for Attribution: Tags allow you to attribute costs to teams, projects, or departments, making it easier to identify high-cost areas. Workflow and Job Analysis: By correlating usage data with workflows and jobs, you can pinpoint long-running or resource-heavy workloads that drive costs. Focus on Long-Running Workloads: Examine workloads with extended runtimes or high resource utilization. Key Question: Which pipelines or workloads are driving the majority of your costs? Governance Hub: is a centralized, account-level UI for monitoring and managing governance across Databricks. Note this is a beta feature, we will update this article as we get more information and use-cases on this feature. Now That You’ve Identified Long-Running Workloads, Review These Key Areas: 2. Review Cluster Metrics CPU Utilization: Track guest, iowait, idle, irq, nice, softirq, steal, system, and user times to understand how compute resources are being used. Memory Utilization: Monitor used, free, buffer, and cached memory to identify over- or under-utilization. Key Question: Is your cluster over- or under-utilized? Are resources being wasted or stretched too thin? 3. Review SQL Warehouse Metrics Live Statistics: Monitor warehouse status, running/queued queries, and current cluster count. Time Scale Filter: Analyze query and cluster activity over different time frames (8 hours, 24 hours, 7 days, 14 days). Peak Query Count Chart: Identify periods of high concurrency. Completed Query Count Chart: Track throughput and query success/failure rates. Running Clusters Chart: Observe cluster allocation and recycling events. Query History Table: Filter and analyze queries by user, duration, status, and statement type. Key Question: Is your SQL Warehouse over- or under-utilized? Are resources being wasted or stretched too thin? 4. Review Spark UI Stages Tab: Look for skewed data, high input/output, and shuffle times. Uneven task durations may indicate data skew or inefficient data handling. Jobs Timeline: Identify long-running jobs or stages that consume excessive resources. Stage Analysis: Determine if stages are I/O bound or suffering from data skew/spill. Executor Metrics: Monitor memory usage, CPU utilization, and disk I/O. Frequent garbage collection or high memory usage may signal the need for better resource allocation. 4.1. Spark UI: Storage & Jobs Tab Storage Level: Check if data is stored in memory, on disk, or both. Size: Assess the size of cached data. Job Analysis: Investigate jobs that dominate the timeline or have unusually long durations. Look for gaps caused by complex execution plans, non-Spark code, driver overload, or cluster malfunction. 4.2. Spark UI: Executor Tab Storage Memory: Compare used vs. available memory. Task Time (Garbage Collection): Review long tasks and garbage collection times. Shuffle Read/Write: Measure data transferred between stages. 5. Additional Diagnostic Methods System Tables in Unity Catalog: Query system tables for cost attribution and resource usage trends. Cost Observability Queries Tagging Analysis: Use tags to identify which teams or projects consume the most resources. Dashboards & Alerts: Set up cost dashboards and budget alerts for proactive monitoring. Phase 2: Cluster/Code/Data Best Practices Alignment Cluster UI Configuration and Cost Attribution Effectively configuring clusters/workloads in Databricks is essential for balancing performance, scalability, and cost. Tunning settings and features when used strategically can help organizations maximize resource efficiency and minimize unnecessary spending. Key Configuration Strategies 1. Reduce Idle Time: Clusters to incur costs even when not actively processing workloads. To avoid paying for unused resources: Enable Auto-Terminate: Set clusters automatically shut down after a period of inactivity. This simple setting can significantly reduce wasted spending. Enable Autoscaling: Workloads fluctuate in size and complexity. Autoscaling allows clusters to dynamically adjust the number of nodes based on demand: Automatic Resource Adjustment: Scale up for heavy jobs and scale down for lighter loads, ensuring you only pay for what you use. It significantly enhances cost efficiency and overall performance. For serverless and streaming, using Delta Live Tables with autoscaling is recommended. This approach leads to better resource management and reliability. Use Spot Instances: For batch processing and non-critical workloads, spot instances offer substantial cost savings: Lower VM Costs: Spot instances are typically much cheaper than standard VMs. However, they are not recommended for jobs requiring constant uptime due to potential interruptions. Considerations: Azure Spot VMs are intended for non-critical, fault-tolerant tasks. They can be evicted without notice, risking production stability. No SLA guarantees mean potential downtime for critical applications. Using Spot VMs could lead to reliability issues in production environments. Leverage Photon Engine: Photon is Databricks’ high-performance, vectorized query engine: Accelerate Large Workloads: Photon can dramatically reduce runtime for compute-intensive tasks, improving both speed and cost efficiency. Keep Runtimes Up to Date: Using the latest Databricks runtime ensures optimal performance and security: Benefit from Improvements: Regular updates include performance enhancements, bug fixes, and new features. Apply Cluster Policies: Cluster policies help standardize configurations and enforce cost controls across teams: Governance and Consistency: Policies can restrict certain settings, enforce tagging, and ensure clusters are created with cost-effective defaults. Optimize Storage: type impacts both performance and cost: Switch from HDDs to SSDs: SSDs provide faster caching and shuffle operations, which can improve job efficiency and reduce runtime. Tag Clusters for Cost Attribution: Tagging clusters enables granular tracking and reporting: Visibility and Accountability: Use tags to attribute costs to specific teams, projects, or environments, supporting better budgeting and chargeback processes. Select the Right Cluster Type: Different workloads require different cluster types, see table below for Serverless vs Classic Compute: Feature Classic Compute Serverless Compute Control Full control over config & network Minimal control, fully managed by Databricks Startup Time Slower (unless pre-warmed) Instant Cost Model Hourly, supports reservations Pay-per-use, elastic scaling Security VNet injection, private endpoints NCC-based private connectivity Best For Heavy ETL, ML, compliance workloads Interactive queries, unpredictable demand Job Clusters: Ideal for scheduled jobs and Delta Live Tables. All-Purpose Clusters: Suited for ad-hoc analysis and collaborative work. Single-Node Clusters: Efficient for simple exploratory data analysis or pure Python tasks. Serverless Compute: Scalable, managed workloads with automatic resource management. 11. Monitor and Adjust Regularly: review cluster metrics and query history: Continuous Optimization: Use built-in dashboards to monitor usage, identify bottlenecks, and adjust cluster size or configuration as needed. Code Best Practices Avoid Reprocessing Large Tables Use a CDC (Change Data Capture) architecture with Delta Live Tables (DLT) to process only new or changed data, minimizing unnecessary computation. Ensure Code Parallelizes Well Write Spark code that leverages parallel processing. Avoid loops, deeply nested structures, and inefficient user-defined functions (UDFs) that can hinder scalability. Reduce Memory Consumption Tweak Spark configurations to minimize memory overhead. Clean out legacy or unnecessary settings that may have carried over from previous Spark versions. Prefer SQL Over Complex Python Use SQL (declarative language) for Spark jobs whenever possible. SQL queries are typically more efficient and easier to optimize than complex Python logic. Modularize Notebooks Use %run to split large notebooks into smaller, reusable modules. This improves maintainability. Use LIMIT in Exploratory Queries When exploring data, always use the LIMIT clause to avoid scanning large datasets unnecessarily. Monitor Job Performance Regularly review Spark UI to detect inefficiencies such as high shuffle, input, or output. Review the below table for optimization opportunities: Spark stage high I/O - Azure Databricks | Microsoft Learn Databricks Code Performance Enhancements & Data Engineering Best Practices By enabling the below features and applying best practices, you can significantly lower costs, accelerate job execution, and build Databricks pipelines that are both scalable and highly reliable. For more guidance review: Comprehensive Guide to Optimize Data Workloads | Databricks. Feature / Technique Purpose / Benefit How to Use / Enable / Key Notes Disk Caching Accelerates repeated reads of Parquet files Set spark.databricks.io.cache.enabled = true Dynamic File Pruning (DFP) Skips irrelevant data files during queries, improves query performance Enabled by default in Databricks Low Shuffle Merge Reduces data rewriting during MERGE operations, less need to recalculate ZORDER Use Databricks runtime with feature enabled Adaptive Query Execution (AQE) Dynamically optimizes query plans based on runtime statistics Available in Spark 3.0+, enabled by default Deletion Vectors Efficient row removal/change without rewriting entire Parquet file Enable in workspace settings, use with Delta Lake Materialized Views Faster BI queries, reduced compute for frequently accessed data Create in Databricks SQL Optimize Compacts Delta Lake files, improves query performance Run regularly, combine with ZORDER on high-cardinality columns ZORDER Physically sorts/co-locates data by chosen columns for faster queries Use with OPTIMIZE, select columns frequently used in filters/joins Auto Optimize Automatically compacts small files during writes Enable optimizeWrite and autoCompact table properties Liquid Clustering Simplifies data layout, replaces partitioning/ZORDER, flexible clustering keys Recommended for new Delta tables, enables easy redefinition of clustering keys File Size Tuning Achieve optimal file size for performance and cost Set delta.targetFileSize table property Broadcast Hash Join Optimizes joins by broadcasting smaller tables Adjust spark.sql.autoBroadcastJoinThreshold and spark.databricks.adaptive.autoBroadcastJoinThreshold Shuffle Hash Join Faster join alternative to sort-merge join Prefer over sort-merge join when broadcasting isn’t possible, Photon engine can help Cost-Based Optimizer (CBO) Improves query plans for complex joins Enabled by default, collect column/table statistics with ANALYZE TABLE Data Spilling & Skew Handles uneven data distribution and excessive shuffle Use AQE, set spark.sql.shuffle.partitions=auto, optimize partitioning Data Explosion Management Controls partition sizes after transformations (e.g., explode, join) Adjust spark.sql.files.maxPartitionBytes, use repartition() after reads Delta Merge Efficient upserts and CDC (Change Data Capture) Use MERGE operation in Delta Lake, combine with CDC architecture Data Purging (Vacuum) Removes stale data files, maintains storage efficiency Run VACUUM regularly based on transaction frequency Phase 3: Team Alignment and Next Steps Implementing Cost Observability and Taking Action Effective cost management in Databricks goes beyond configuration and code—it requires robust observability, granular tracking, and proactive measures. Below outlines how your teams can achieve this using system tables, tagging, dashboards, and actionable scripts. Cost Observability with System Tables Databricks Unity Catalog provides system tables that store operational data for your account. These tables enable historical cost observability and empower FinOps teams to analyze spend independently. System Tables Location: Found inside the Unity Catalog under the “system” schema. Key Benefits: Structured data for querying, historical analysis, and cost attribution. Action: Assign permissions to FinOps teams so they can access and analyze dedicated cost tables. Enable Tags for Granular Tracking Tagging is a powerful feature for tracking, reporting, and budgeting at a granular level. Classic Compute: Manually add key/value pairs when creating clusters, jobs, SQL Warehouses, or Model Serving endpoints. Use cluster policies to enforce custom tags. Serverless Compute: Create budget policies and assign permissions to teams or members for serverless workloads. Action: Tag all compute resources to enable detailed cost attribution and reporting. Track Costs with Dashboards and Alerts Databricks offers prebuilt dashboards and queries for cost forecasting and usage analysis. Dashboards: Visualize spend, usage trends, and forecast future costs. Prebuilt Queries: Use top queries with system tables to answer meaningful cost questions. Budget Alerts: Set up alerts in the Account Console (Usage > Budget) to receive notifications when spend approaches defined thresholds. Build Culture of Efficiency To go beyond technical fixes and build a culture of efficiency, by focusing on the below strategic actions: Collaborate with Internal Engineers: Spend time with engineering teams to understand workload patterns and optimization opportunities. Peer Reviews and Code Audits: Conduct regular code review sessions and peer reviews to ensure best practices are followed for Spark jobs, data pipelines, and cluster configurations. Create Internal Best Practice Documentation: Develop clear guidelines for writing optimized code, managing data, and maintaining clusters. Make these resources easily accessible for all teams. Implement Observability Dashboards: Use Databricks’ built-in features to create dashboards that track spend, monitor resource utilization, and highlight anomalies. Set Alerts and Budgets: Configure alerts for long-running workloads and establish budgets using prebuilt Databricks capabilities to prevent cost overruns. 5. Azure Reservations and Azure Savings Plan When optimizing Databricks costs on Azure, it’s important to understand the two main commitment-based savings options: Azure Reservations and Azure Savings Plans. Both can help you reduce compute costs, but they differ in flexibility and how savings are applied. Which Should You Choose? Reservations are ideal if you have stable, predictable Databricks workloads and want maximum savings. Savings Plans are better if you expect your compute needs to change, or if you want a simpler, more flexible way to save across multiple services. Pro Tip: You can combine both options—use Reservations for your baseline, always-on Databricks clusters, and Savings Plans for bursty, variable, or new workloads. Summary Table: Action Steps It’s critical to monitor costs continuously and align your teams with established best practices, while scheduling regular code review sessions to ensure efficiency and consistency. Area Best Practice / Action System Tables Use for historical cost analysis and attribution Tagging Apply to all compute resources for granular tracking Dashboards Visualize spend, usage, and forecasts Alerts Set budget alerts for proactive cost management Scripts/Queries Build custom analysis tools for deep insights Cluster/Data/Code Review & Align Regularly review best practices, share findings, and align teams on optimization Save on your Usage Consider Azure Reservations and Azure Savings Plan581Views2likes0CommentsSyksyn 2026 Tekniset ja myynnin Kumppanitunnit
Microsoftin tekniset ja myynnille suunnatut Kumppanitunnit järjestetään nykyään Microsoftin globaalilla Skilling Hub -sivustolla, josta ne ovat kätevästi saatavilla myöhemmin tallenteina materiaaleineen. Rekisteröidy Skilling Hub -portaaliin, josta löydät kaikki Microsoftin kumppanikoulutukset yhdessä paikassa eri kielillä tai tekstitettyinä. Rekisteröityessäsi voi valita ne kielet, kuten suomi, jollaista sisältöä haluat ensisijaisesti nähdä englannin kielisen koulutussisällön lisäksi. Kumppanitunti on joka toinen perjantai klo 10–11 järjestettävä Microsoftin kumppaniwebinaari, joka on tarkoitettu kaikille Microsoftin kumppaneille. Tekniset ja kaupalliset aiheet vuorottelevat ja olet tervetullut molempiin webinaareihin. Webinaareissa keskitymme Microsoftin ratkaisualueiden teknologioiden mielenkiintoisiin uutuuksiin, MAICPP-kumppaniohjelmaan, kumppanietuihin ja ratkaisumyyntiin. Microsoftin suomalaiset arkkitehdit, tuotepäälliköt, ratkaisumyyjät ja kumppanivastaavat ovat poimineet kiinnostavia ja hyödyllisiä aiheita, joita he vuorollaan esittelevät. Syksyn 2026 ohjelma Alla ovat suunnitellut päivät ja teemat Syksylle 2026, joiden tarkka aihe päivitetään aina lähempänä esityspäivää tälle sivulle. 18.9. Kaupallinen Kumppanitunti: Partner START FY27 - webinaari Rekisteröidy mukaan tästä linkistä: Etkö päässyt mukaan START FY27 Kickoff -tapahtumaan? Webinaarissa saat kattavan katsauksen tapahtumassa käsiteltyihin FY27: n liiketoimintamahdollisuuksiin, strategisiin painopisteisiin sekä Microsoftin kumppaneille suunnattuihin ohjelmiin ja resursseihin. Puhujat: Kalle Saarikannas, Liiketoimintajohtaja, AI Business Solutions Vibha Deshpande & Teemu Lainiola, Liiketoimintajohtajat, Cloud & AI Platforms Mikael Winqvist, Liiketoimintajohtaja, Security Mereta Laukkanen, Sr Partner Development Manager Jonna Kaarlenkaski, Partner Development Manager Intern Jonna Fred-Jokela, Sr Solution Engineer Manager 2.10. Tekninen Kumppanitunti: Copilot Cowork: Copilot Credits ja kustannusten hallinta Rekisteröidy mukaan tästä linkistä! Tässä teknisessä kumppanitunnissa käymme läpi Copilot Coworkin toimintamallin, kulutuksen seurannan sekä kustannusten hallinnan. Lisäksi tarkastelemme, millaisia mahdollisuuksia kulutuspohjainen AI luo kumppaneiden palveluliiketoiminnalle. Puhujat: Henri Nevalainen, Microsoft Niko Hiltunen, IAMCP 9.10. Kaupallinen Kumppanitunti: Onko julkisen pilven suvereniteetti riittävä huomioiden sen kaikki hyödyt? Rekisteröidy mukaan tästä linkistä! Euroopan unioni valmistelee uusia pilvi- ja tekoälyinfrastruktuuria koskevia linjauksia. Samanaikaisesti organisaatiot pohtivat, miten digitaalinen suvereniteetti, tekoälyn käyttöönotto, kyberturvallisuus ja sääntelyvaatimukset voidaan sovittaa yhteen käytännössä. Tervetuloa ajankohtaiseen webinaariin, jossa tarkastelemme Euroopan muuttuvaa pilviympäristöä ja mitä digitaalinen suvereniteetti tarkoittaa suomalaisille organisaatioille käytännössä. Lisäksi kerromme viimeisimmät tilannetiedot pilvipalveluiden kvanttiturvallisuuden ja Suomen datakeskushankkeiden osalta. Puhujat: Juha Karppinen, National Technology Officer, Microsoft Timo Salminen, Partner Solution Architect, Microsoft Niko Hiltunen, IAMCP 16.10. Kaupallinen Kumppanitunti: Rekisteröitymislinkki päivittyy tähän Puhujat: 30.10. Tekninen Kumppanitunti: Rekisteröitymislinkki päivittyy tähän Puhujat: 6.11. Tekninen Kumppanitunti: Rekisteröitymislinkki päivittyy tähän Puhujat: 20.11. Kaupallinen Kumppanitunti: Rekisteröitymislinkki päivittyy tähän Puhujat: 4.12. Kaupallinen Kumppanitunti: Rekisteröitymislinkki päivittyy tähän Puhujat: 18.12. Tekninen Kumppanitunti: Agentit Azuressa Rekisteröitymislinkki päivittyy tähän Azure Copilot pitää sisällään uusia palveluiden elinkaarenhallintaan liittyviä agentteja. Tule kuulemaan, miten voit hyödyntää näitä omissa palveluissasi! Puhujat: Timo Salminen, Partner Solution Architect, Microsoft445Views0likes0CommentsLearn What to Do When You Hit Capacity in Azure Databricks!
Microsoft's Cloud Architects: Manu Mehta manumehta, Chris Walk cwalk, Eduardo Dos Santos eduardomdossantos, Maria Hito mariahito, Kiran Raja Ch KiranRaja, Paul Singh PaulSingh, Aladdin Alchalabi AladdinAlchalabi and Rafia Aqil Rafia_Aqil Start Here: Engage Microsoft Capacity constraints in Azure Databricks are not an Azure Databricks product issue. Azure Databricks does not own or reserve compute, it dynamically provisions VMs from Azure when clusters are created or scaled. This means cluster creation, autoscaling, or job execution can stall when the underlying VM SKUs are constrained at the regional level. The fastest path to resolution is a structured conversation with your Microsoft account team, who can engage the Azure capacity intake process on your behalf. Create a Quota Support Ticket via Microsoft Support and bring the following to your account team with your Support Ticket Number. Each field maps directly to what capacity intake teams will ask for: missing fields slow the request. What to Prepare Before You Reach Out Your Account Team Field What Capacity Intake Needs Example Subscription IDs The exact Azure subscriptions that will host the workspaces and clusters 7ebee83d-7923-426c-8449-59fd4dff25ab Region(s) Primary region, plus any acceptable alternates East US 2 VM family / SKU Specific series and version requested Eadsv5, ESv4, DSv4, DSv2 Core count / new limit Total vCPU or core count per SKU 10,000 cores for Eadsv5 Workload characteristic CPU-bound vs. memory/shuffle-heavy vs. IO-heavy; batch vs. streaming vs. SQL “Memory-intensive ETL with large joins and shuffles” Scale and timing When you need it, ramp profile, peak vs. steady state “Need by month-end; ramp from 2,000 to 9,650 cores over Q3” Business context Business use case “Migration off AWS” What “Capacity” Really Means: A Layered Mental Model Before diving into fixes, it is important to understand what is actually happening behind the scenes. Capacity constraints can occur at three distinct layers, and solving them requires addressing each one. Layer 1: Azure Infrastructure This is the layer most teams underestimate. Capacity here is governed by: VM SKU availability in the region. D-series and E-series: the two most common Databricks worker families: have repeatedly hit capacity constraints across multiple Azure regions, causing cluster creation failures, autoscale stalls, and provisioning delays. Regional supply constraints, which are dynamic and shared across all Azure tenants. vCPU quotas and limits per subscription, which are separate from regional supply. Quota is your subscription’s limit to deploy resources (like a credit card limit); regional capacity is the underlying infrastructure available. Both must be sufficient. Mechanism Guarantees Capacity Costs Money when idle Discount vCPU quota No No N/A Instance pool Best effort Yes (VM only, no DBU) No Reserved Instance No N/A Yes Savings Plan No N/A Yes CRG Yes, within SLA Yes No, but RI/SP can apply Serverless Platform-Managed No N/A Layer 2: Azure Databricks Platform The Azure Databricks control plane has its own published ceilings that your architecture must proactively respect. Key limits from the official Azure Databricks resource limits documentation: Resource Limit Scope Jobs created per hour 10,000 Workspace Tasks running simultaneously 2,000 Workspace (Run Job and For Each parent tasks excluded) Parent tasks running simultaneously (Run Job / For Each) 750 Workspace SQL warehouses 1,000 Workspace Attached notebooks or execution contexts 145 Cluster Virtual machines 25,000 Per subscription per region Note: For limits marked as non-fixed in the official documentation, you can request an increase through your Azure Databricks account team. Reference: https://learn.microsoft.com/en-us/azure/databricks/resources/limits Layer 3: Workload (Spark Execution) Even when both lower layers cooperate, Spark’s own execution model can produce capacity-like symptoms: Parallelism and task distribution, which dictate how many cores a job can usefully consume. Memory pressure from joins, shuffles, and skewed keys. IO demand and caching behavior, including Delta cache effectiveness and Spark cache misuse. Understanding these layers is critical. Retries sometimes succeed because capacity is dynamic: as other workloads complete, nodes are released back to Azure and briefly become available. Recognizing When You’ve Hit Capacity Capacity issues rarely present as a single clean error. Instead, they appear as inconsistent behaviors: Clusters stuck in Pending state Autoscaling fails or never reaches the desired size Jobs intermittently fail to start Retry attempts sometimes succeed These inconsistencies occur because capacity is shared across Azure tenants and fluctuates throughout the day. Running workloads outside peak business hours in the impacted region’s time zone is one of the most effective short-term mitigations. Inconsistent symptoms are not the same as unknowable ones. Before escalating, confirm what you are actually looking at. Several very different problems produce the symptoms above, and only one of them is a regional capacity shortage. 1. Where to look first Start with the cluster's termination reason and event log in the Azure Databricks workspace. Then cross-check the Azure Activity Log for the workspace's managed resource group over the same time window, which shows the VM allocation attempt and its result. 2. Match signal to the clause What you observe Points to Review What to do Cluster-provider launch or stockout failure Regional capacity for that VM size Immediate Actions, below Quota, core, or vCPU limit referenced Subscription quota, not capacity Request a quota increase — capacity may be fine VM size unavailable in the region or zone Availability restriction, not a transient shortage Switch VM SKU or Family below, retrying will not help Pool returns INSTANCE_POOL_MAX_CAPACITY_FAILURE A Databricks pool ceiling you configured Raise the pool's maximum capacity Cluster starts normally but jobs run slowly, spill, or OOM Workload design, not capacity Why Adding more Nodes is Not Always the Answer, below Only the first row is a genuine Azure capacity constraint. The others are resolved without any capacity conversations 3. Check quota before you conclude capacity Quota and capacity fail in similar ways but are resolved through entirely different paths. Compare current usage against the limit for the VM series and region in question. If usage is below the limit and allocation still fails, the constraint is regional capacity. If usage it at the limit, it is quota and an increase may resolve it outright. Immediate Actions: How to Unblock Your Workloads When you are actively hitting capacity constraints, speed matters. Please reach out to your Microsoft Account team and try these mitigations that are ordered from quickest to most involved. Retry and Run During Off-Peak Hours Capacity availability changes throughout the day as workloads complete and release VMs. Running outside peak business hours for the impacted region significantly improves success rates. Retrying is bounded, not unlimited. As a rule of thumb, retry two or three times across different hours, including at least one off-peak window in the impacted region's time zone. If the same VM size and region fall consistently across a full business day, stop treating it as transient; open a support ticket, engage your account team, and evaluate VM families in parallel. If the workload is production critical with a fixed deadline, or if failures are blocking a migration or cutover already in flight, escalate immediately without waiting for the retry window. Switch VM SKU or Family If a specific VM SKU is constrained, switching to another can immediately unblock provisioning. Move within the same family (for example, DSv4 → DSv5) Or switch families entirely (for example, D-series → F-series or L-series) Choosing the Right VM Family Most Databricks environments default to D-series (general purpose) and E-series (memory optimized). These are also the most heavily used and most capacity-constrained VM families. Consider alternatives based on your workload: VM Family Best For When to Use Trade-off D-series General workloads Default choice Often constrained in high-demand regions E-series Memory-heavy Spark jobs Joins, shuffles, analytics High demand; higher cost F-series CPU-intensive jobs Parsing, transformations Lower memory per core L-series IO-heavy workloads Delta caching, large datasets Higher cost; large local NVMe Practical decision framework: Memory-bound workloads (joins, shuffles): Move from E-series to L-series. Similar memory per core, plus large local NVMe for Delta caching. CPU-bound workloads: Move from D-series to F-series. Higher CPU performance at lower cost. IO-heavy or cache-sensitive workloads: L-series can significantly improve performance and reduce shuffle pressure. Implement Regional Diversity in your Databricks workload As Azure capacity constraints are region and SKU-specific, it is important to build architectural flexibility into your Databricks deployments. For critical or large-scale workloads, consider deploying multiple Databricks workspaces across different Azure regions to reduce dependency on any single region’s capacity. This approach enables: improved resilience to regional capacity constraints greater flexibility in workload placement Important: Multi-region deployment requires deliberate architecture, including deploying separate workspaces and replicating data and configurations across regions; it is not automatic. Why Adding More Nodes Is Not Always the Answer When jobs slow down, the instinct is to scale compute. With Spark, more nodes do not always solve the problem. Common workload issues that masquerade as capacity problems: Data skew Excessive shuffle operations Inefficient partitioning Overuse of UDFs In some workloads, shuffle operations can grow significantly larger than the original input data, placing substantial pressure on compute, memory, disk I/O, and network resources. Because shuffle workloads are distributed across the cluster, adding nodes can improve performance by increasing parallelism. However, that benefit reaches a limit when the bottleneck is caused by data skew, oversized shuffle partitions, network-intensive data movement, or data explosion from joins and aggregations. In these scenarios, the workload becomes constrained by the shuffle pattern itself, and simply adding more nodes does not address the root cause. Instead, the shuffle strategy, partitioning approach, or query design should be optimized. Smarter optimization strategies: Reduce shuffle through repartitioning and query optimization Enable Photon for faster execution Optimize Delta tables using Z-ordering and compaction Leverage caching strategically (not just Spark cache: use the Delta/disk cache) These optimizations can reduce your dependency on scarce VM capacity altogether. Review optimization strategies: The Complete Guide to Azure Databricks Cost Optimization | Microsoft Community Hub. What to Do When Your Capacity Is Approved Once Azure approves your capacity request, retaining it requires active steps. Because Azure capacity is dynamic and shared, approved capacity is held only while compute remains actively deployed and running. This is especially important in highly constrained regions. Microsoft recommends the following: Configure an Instance Pool For workloads that cannot yet use serverless compute, configure an Azure Databricks Instance Pool with a minimum number of idle nodes aligned to your production requirements. An instance pool pre-allocates and maintains a set of idle, ready-to-use VM instances. When a cluster is created from the pool, it draws from these warm nodes: eliminating the need to request new VMs from the regional Azure capacity pool between job runs. Key behaviors: The pool holds a minimum number of nodes continuously, keeping them warm and immediately available. Clusters attached to the pool pull from warm nodes, avoiding re-acquisition from Azure between runs. No DBU charges apply while nodes are idle in the pool. Azure VM infrastructure costs do apply for all minimum idle instances. Size the pool conservatively: aligned to production need only: to balance capacity retention against ongoing cost. Important: Instance pools hold idle nodes on a best-effort basis. Periodic platform events can recycle pool nodes, briefly causing the pool to fall below its configured minimum idle count while Azure re-acquires replacement nodes. Pools significantly improve availability and startup latency, but they do not change the fact that the underlying VMs are still requested from Azure on demand. They are not a hard reservation. Reference: https://learn.microsoft.com/en-us/azure/databricks/compute/pools You can launch a pool's instances against an Azure capacity reservation group by setting the capacity_reservation_group field in the pool's azure_attributes to the group's resource ID. Configure it through the Instance Pools API or the Azure Databricks SDKs. The same requirements apply as for clusters: on-demand instances only, and only workspaces that use VNet injection. Designing for Resilience: Long-Term Best Practices To avoid repeated capacity issues, your architecture needs to evolve beyond reactive mitigations. Plan Ahead with Azure Capacity Reservation Groups For organizations running mission-critical Azure Databricks workloads, Azure Capacity Reservation Groups (CRGs) can provide additional predictability by reserving VM capacity in advance for your Databricks compute resources. Rather than competing for available regional capacity during periods of high demand, reserved capacity helps ensure that the required VM families are available when clusters need to scale or start, Reference: Databricks Clusters API documentation. Note: Before you commit to a reservation, know three things: Auto-termination stops saving VM costs. When a cluster terminates, its reserved capacity returns to an unused state and continues billing at the full VM rate. A pool backed by a reservation is not billed twice. If a team already pays for minimum idle pool nodes in a constrained region, a reservation at comparable spend converts best-effort capacity into SLA-backed capacity. Confirm that the cluster is actually using the reservation. Creating the reservation proves Azure set capacity aside, but it does not prove Databricks is drawing on it. Start a cluster, then check that allocated instances on the reservation rose by the expected node count. If it stays at zero, the usual causes are a VM size mismatch, availability not set to ON_DEMAND_AZURE, a workspace on the Databricks-managed VNet, or the RBAC actions never granted. Note also that omitting capacity_reservation_group when editing an instance pool silently clears it. Step-by-Step Instructions: Attaching a CRG to Databricks is done only through the Clusters/Instance Pools API or the Databricks SDKs, it is not available in the compute UI. Prerequisites VNet-injected workspace only. The workspace must be deployed into your own VNet. Workspaces on the default Databricks-managed VNet cannot use a CRG. On-demand instances only. The cluster/pool must use ON_DEMAND_AZURE availability. Spot and serverless are not eligible. Same region. Create the CRG in the same Azure region as the workspace. Matching VM size. Reserve the exact VM SKU(s) your cluster uses (driver and workers). Sufficient subscription quota for that SKU and core count. Go to the CRG resource -> Access Control -> Add role assignment and add the below roles to the workspace (i.e. databricks-login-prod) Enterprise Application: Microsoft.Compute/capacityReservationGroups/read Microsoft.Compute/capacityReservationGroups/deploy/action Microsoft.Compute/capacityReservationGroups/capacityReservations/read Microsoft.Compute/capacityReservationGroups/capacityReservations/deploy/action Step 1: Create the CRG and reservation in Azure az group create -l eastus -g myResourceGroup az capacity reservation group create \ -n myCapacityReservationGroup -l eastus -g myResourceGroup --zones 1 2 3 az capacity reservation create \ -c myCapacityReservationGroup -n myCapacityReservation \ -l eastus -g myResourceGroup --sku Standard_D2s_v3 --capacity 5 --zone 1 Note: If you want to create the CRG from the Azure Portal you can do the following: Set Subscription, Resource group, Name, and Region (use the same region as your Databricks workspace). Optionally pick Availability zones. Add one or more reservations: Reservation name, Instances (quantity), and VM size (match your cluster's driver/worker SKU). Example here: reservation-eadsv5, 5 × Standard_D4s_v3. Confirm the summary (price, basics, reservations), then click Create. Step 2 Attach the CRG to the cluster (Clusters API or SDK) This would be the Azure Databricks compute cluster, the Spark cluster you create inside your Azure Databricks workspace (Compute → Create compute, or a job cluster). You add an azure_attributes block to the cluster definition. The snippet below is a fragment that goes inside the cluster's JSON, alongside the normal cluster fields. You provide the CRG resource ID; Azure picks a matching reservation within the group. databricks clusters edit --json '{ "cluster_id": "<existing-cluster-id>", "spark_version": "15.4.x-scala2.12", "node_type_id": "Standard_D4s_v3", "num_workers": 4, "azure_attributes": { "availability": "ON_DEMAND_AZURE", "capacity_reservation_group": "/subscriptions/<subscription-id>/resourceGroups/<resource-group>/providers/Microsoft.Compute/capacityReservationGroups/<crg-name>" } }' The cluster's node_type_id (VM SKU) has to be the same VM size you reserved in the CRG (Step 1). If the reservation is Standard_D4s_v3, the cluster's node type must also be Standard_D4s_v3, or it won't draw from the reservation. For instance pools, set the same capacity_reservation_group field via the Instance Pools API or SDK (If you omit the field when editing a pool, Databricks clears any CRG already configured on it). Plan for Capacity Early Understand VM quotas and limits before you need them: not after a constraint occurs. Avoid designing a single SKU. Build flexibility into cluster configurations so you can switch families without re-engineering jobs. Standardize Compute Configurations Consistent, policy-driven environments make it easier to adapt when capacity constraints occur. Use Databricks Cluster Policies to constrain cluster creation to approved, available VM families: this prevents teams from inadvertently requesting constrained SKUs. Also, consider enforcing the CRG setting through a Databricks compute policy, so teams launch only against approved, reserved capacity. Move Toward Serverless Where Possible Serverless compute abstracts capacity management away from the customer. As the Databricks platform expands serverless support, migrating eligible workloads is the most durable long-term strategy. Azure continues to expand infrastructure capacity, but there are no guaranteed timelines for relief in constrained regions. Note: If your workload supports serverless compute, Databricks recommends using serverless compute instead of pools or classic VM-backed clusters. Serverless removes dependency on specific VM SKUs and regional capacity: scaling is managed by the platform with significantly improved availability. Reference: https://learn.microsoft.com/en-us/azure/databricks/serverless-compute. For eligible workloads: including Databricks Jobs (automated workflows), Databricks SQL Warehouses, and Delta Live Tables: serverless compute eliminates VM SKU dependency entirely. Configuration guidance is available in the Azure Databricks deployment guide, Development Section, Step 9. Multi-Region Strategy for Critical Workloads For the most critical workloads, evaluate a multi-region deployment as part of your business's continuity planning. This is a significant architectural investment: see the FAQ for the full scope: but it is the only approach that provides true regional redundancy. Coordinate this with your Microsoft account team. Reference: Azure Databricks & Microsoft Fabric Disaster Recovery: The Complete Better‑Together Strategy for Cloud Architects Know the Difference: Azure Capacity Reservations vs. Reserved Instances vs. Savings Plans When planning Azure infrastructure, it is important to separate capacity assurance from cost optimization. Although these options are sometimes discussed together, they solve different problems. On-Demand Capacity Reservations (ODCR) are designed to reserve compute capacity for workloads that need to run now. They are useful when an organization needs capacity for an eligible VM size in a specific region or availability zone. ODCRs generally offer flexibility because they do not require a long-term commitment and can be canceled when no longer needed. Future Capacity Reservations (FCR) support planned capacity requirements for a future need-by date. They are useful for migrations, major launches, seasonal events, and other predictable workload ramps that require advance capacity planning. In comparison, Azure Reserved VM Instances and Azure Savings Plans for Compute are primarily commercial constructs. Reserved Instances provide discounts for predictable, consistently running workloads through a one-year or three-year commitment. Savings Plans offer broader flexibility by applying discounts to eligible compute usage in exchange for an hourly spending commitment. The key takeaway is simple: capacity reservations address infrastructure availability, while Reserved Instances and Savings Plans address pricing. Organizations can use them together, pairing a capacity reservation with an applicable pricing benefit to improve both workload readiness and cost efficiency. Final Takeaways Capacity issues are infrastructure-level constraints, not Databricks product failures VM family selection is critical: do not rely solely on D-series and E-series Workload optimization can reduce dependency on scarce resources before requesting more capacity Serverless compute is Microsoft’s preferred long-term recommendation for eligible workloads Architectural flexibility: multi-SKU, multi-region awareness is your best defense against future constraints FAQ Why do retries work? Capacity in Azure regions is shared across all tenants and fluctuates throughout the day as workloads complete and release VMs. A retry succeeds when capacity temporarily frees up. Retrying during off-peak hours improves success rates significantly. Why does capacity fluctuate during the day? Capacity is a function of regional supply and concurrent demand. As workloads complete, nodes are released back to Azure. Peak business hours in the impacted region’s time zone tend to be the tightest windows. Why are instance pools not a hard reservation? Pools hold a minimum number of nodes on a best-effort basis. Periodic platform events recycle pool nodes, so a pool can briefly fall below its configured minimum idle count while Azure re-acquires replacement nodes. Setting minimum idle to 0 avoids paying for idle VMs at the cost of slower acquisition time. Pools significantly improve availability and startup latency but do not guarantee capacity at the Azure infrastructure level. Why does serverless behave differently from classic clusters? Serverless compute removes customer control over individual VM SKUs. Databricks manages the underlying capacity across a shared pool. SKU-swap and pool-based mitigations do not apply. Customer-side levers reduce to retry and off-peak scheduling. The trade-off is that serverless is the simplest and most reliable option when the workload supports it. Why is changing regions a last resort? Region changes require redeployment of the Azure Databricks workspace and migration of all dependent artifacts: jobs, clusters, libraries, networking (private endpoints, VNet injection), Unity Catalog assignments, identities, and source data. The destination region must be validated for the same SKU and zonal configuration. For these reasons, region change should always be coordinated with the Microsoft account team and attempted only after preferred mitigations have been exhausted. Why does VM family selection matter so much for capacity? Different VM families have different supply curves. D-series and E-series are the most requested Databricks worker families and the ones most frequently constrained. Choosing a SKU based on whether the workload is memory/shuffle-heavy, CPU-bound, or IO-heavy improves both performance and the probability that capacity is available. The capacity team often steers customers toward newer-generation alternatives when supply differs by generation version. What does the Microsoft account team actually do? They route the request into the Azure capacity intake process, advise alternate SKUs and regions, surface zonal vs. regional considerations, and provide forward visibility into known constraints. The customer’s job is to bring a complete, accurate workload profile so the account team can advocate effectively. It is also recommended to open an Azure Support ticket. This will save time later, as the capacity planning teams would like to track issues and requests via a support ticket. Once an Azure Support ticket is opened, the ticket number should be shared to the Microsoft Account Team, at a minimum to the Customer Success Account Manager (CSAM), if one is assigned to your organization.498Views1like0Comments
Checklist for Marketplace cancellation and refund requests?
Is there a guide or checklist for what should be gathered before submitting a cancellation and refund request for a private or multiparty private offer?Specifically, what does Microsoft need from the vendor, the customer, and us as the reseller? I’m looking for required IDs, reports, refund details, consent language, and any steps that need to be completed before opening the ticket. The goal is to submit everything correctly the first time, reduce back-and-forth, and help the request move faster. If anyone has a guide or standard process, I’d appreciate it.