Forum Discussion
How to quickly convert column of currency amounts to other currency using historical price data?
Hi I traded crypto spot markets in 2020 and am now in the process of journaling all those trades.
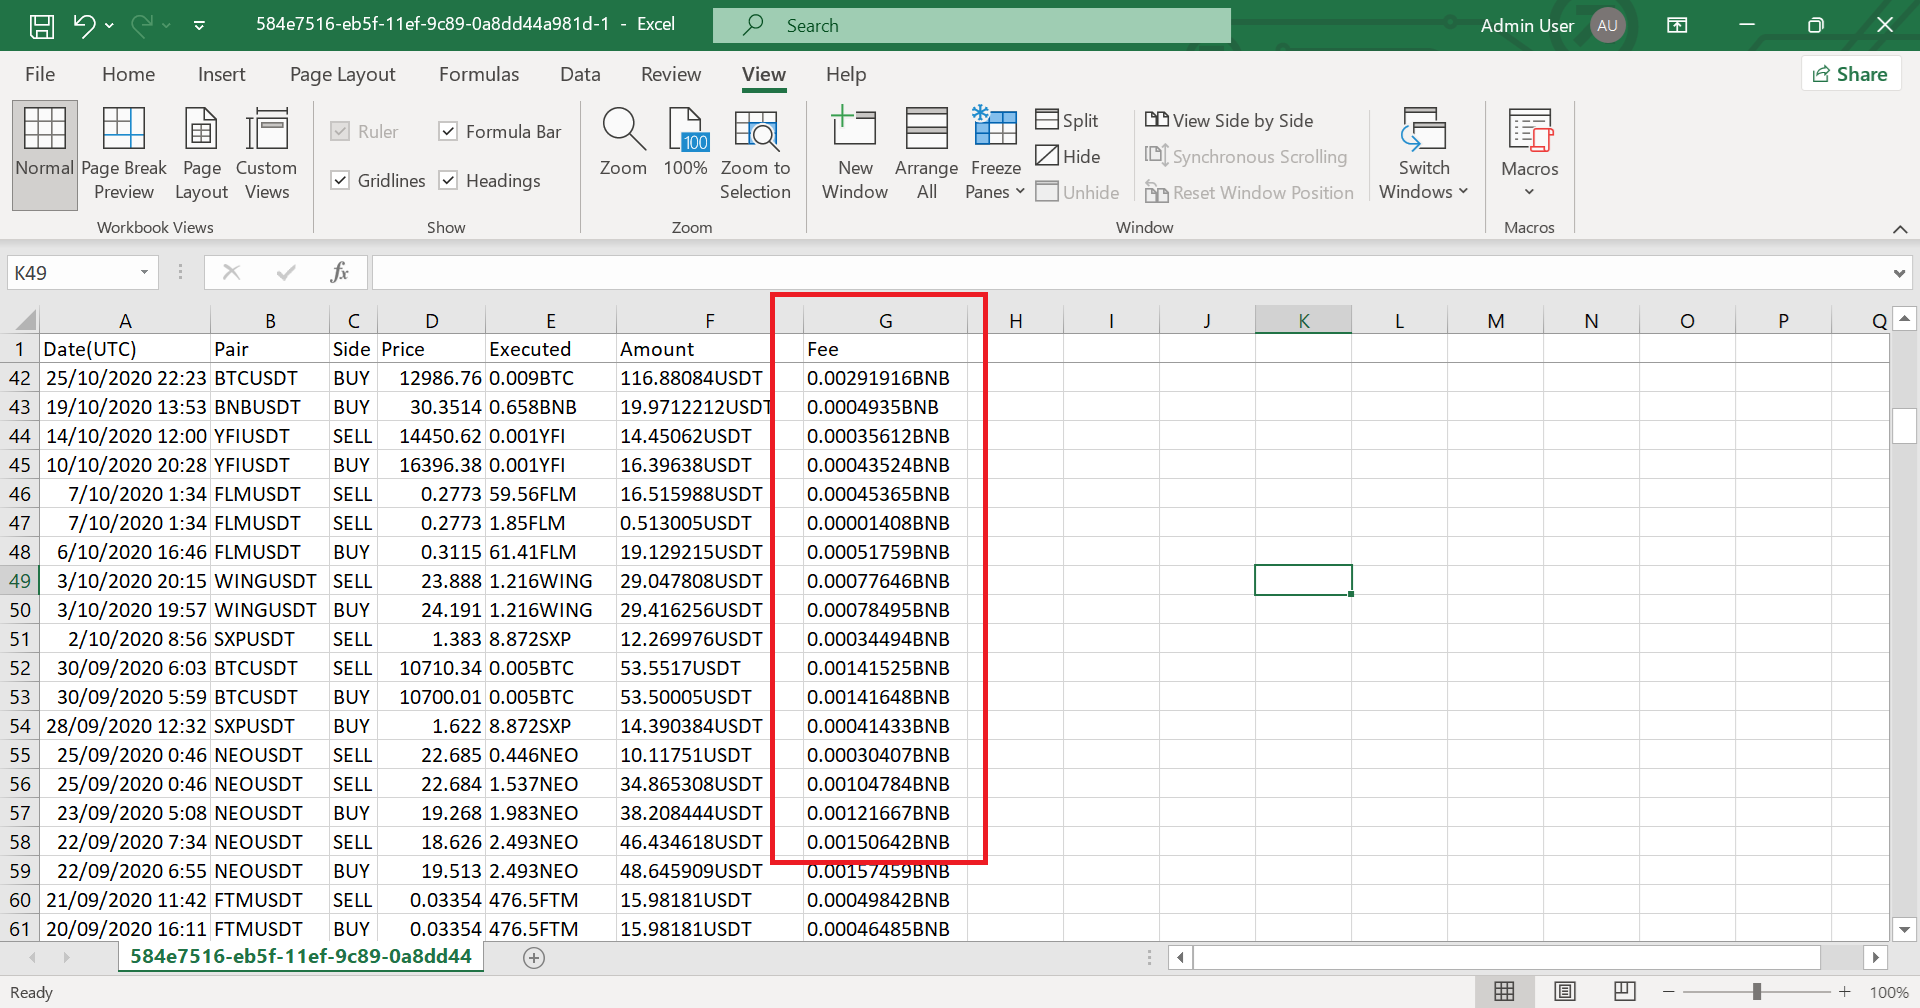
I want to know if via excel I can create something that instantly converts all the amounts of BNB trading fees in column G to USD using exchange rates from historical price data from 2020.
I tried googling for a free BNBUSD converter type tool that lets me input the amount of BNB I want converted and to what currency, date+time in the past to lookup the exchange rate then and tell me how much that BNB was worth at that moment. Unfortunately, couldn’t find anything.
I do not want to resort to manually scrolling through 1000s of rows of timestamps in a downloaded excel sheet to individually convert the fees of each 100+ trades.
From what people have told me I need a table with all the historical data. I did find a 400+mb excel file with 1m OHLC data going back to 2017 (more rows than the max excel will allow). Will this work for what I want to do? How do I use it? What's the next step?
Do I still need to mess around with APIs or do I have everything I need with this big excel file?
Is this whole process actually really quick,easy and straight forward for an excel pro?
I have no clue what I'm doing and have been at this for hours.
See attached
Thanks
7 Replies
 OliverScheurichGold Contributor
Thank you for the file and your support. In the attached file i've made a possible solution with Power Query. Can you check if this returns the expected result for the first 4 rows. For some reason many of the values from the Date(UTC) column of the left blue table aren't found in the Close time column of the right blue table. There seem to be rounding differences because of the seconds e.g. 03.05.2020 14:55 is shown in the cell but it could actually be 03.05.2020 14:55:17 in one table and 03.05.2020 14:55:31 in the other table. If the results of the first 4 rows are what you are looking for then i'll take a closer look at this. If i correctly understand you only want to calculate the fees in USD where column Fee from the left blue table contains "BNB".
 alexx1202Copper Contributor
That is correct. Only the cells in column G (left blue table) with BNB at the end of each number need converting to USD. Skip all the others.
Those 4 rows look good to me. Hopefully you can find a solution to the problem with values in the left-blue table not being found in right-blue.
I forgot to upload 2 more workbooks (1 table each) with additional rows of transactions that require BNB fee conversions. Both tables are in the same format as the SPOT table but with less rows of data (CROSS has 77, ISOLATED has 19). Sorry for not including these along with the SPOT file earlier. I promise this is everything.
Thank you again for your selfless efforts.
- OliverScheurichGold Contributor
I've rounded the dates to the minute and now the fee in USD is returned for almost all the data. There are no fees only for e.g. 30.12.2020 and 31.12.2020 since the large blue table ends on 08.12.2020. The attached file contains the data from the 2 additional workbooks as well. You are welcome. Kind regards.
- OliverScheurichGold Contributor
I'm not sure which column in the BNBUSD_1_Binance sheet shows the exchange rate. In the attached file i've made up an example where column E in sheet BNBUSD_1_Binance is the exchange rate. Sheet2 in my sample file uses Power Query for a suggestion. You can enter data to the blue dynamic tables. Then you can right-click in any cell of the green result table and select refresh to update the results in the green table.
- alexx1202Copper Contributor
Hi Oliver
Thank you for the file.
However, I can’t seem to get it to do what I want.
I’ve managed to isolate the 2020 minute by minute data I need from the big 400mb file and got it down to 6.7mb and attached it for you.
Also attached is the excel file with all the BNB fees that need converting (some fees aren’t BNB).
Hopefully this helps.
I very much appreciate your efforts.