Forum Discussion
How to quickly convert column of currency amounts to other currency using historical price data?
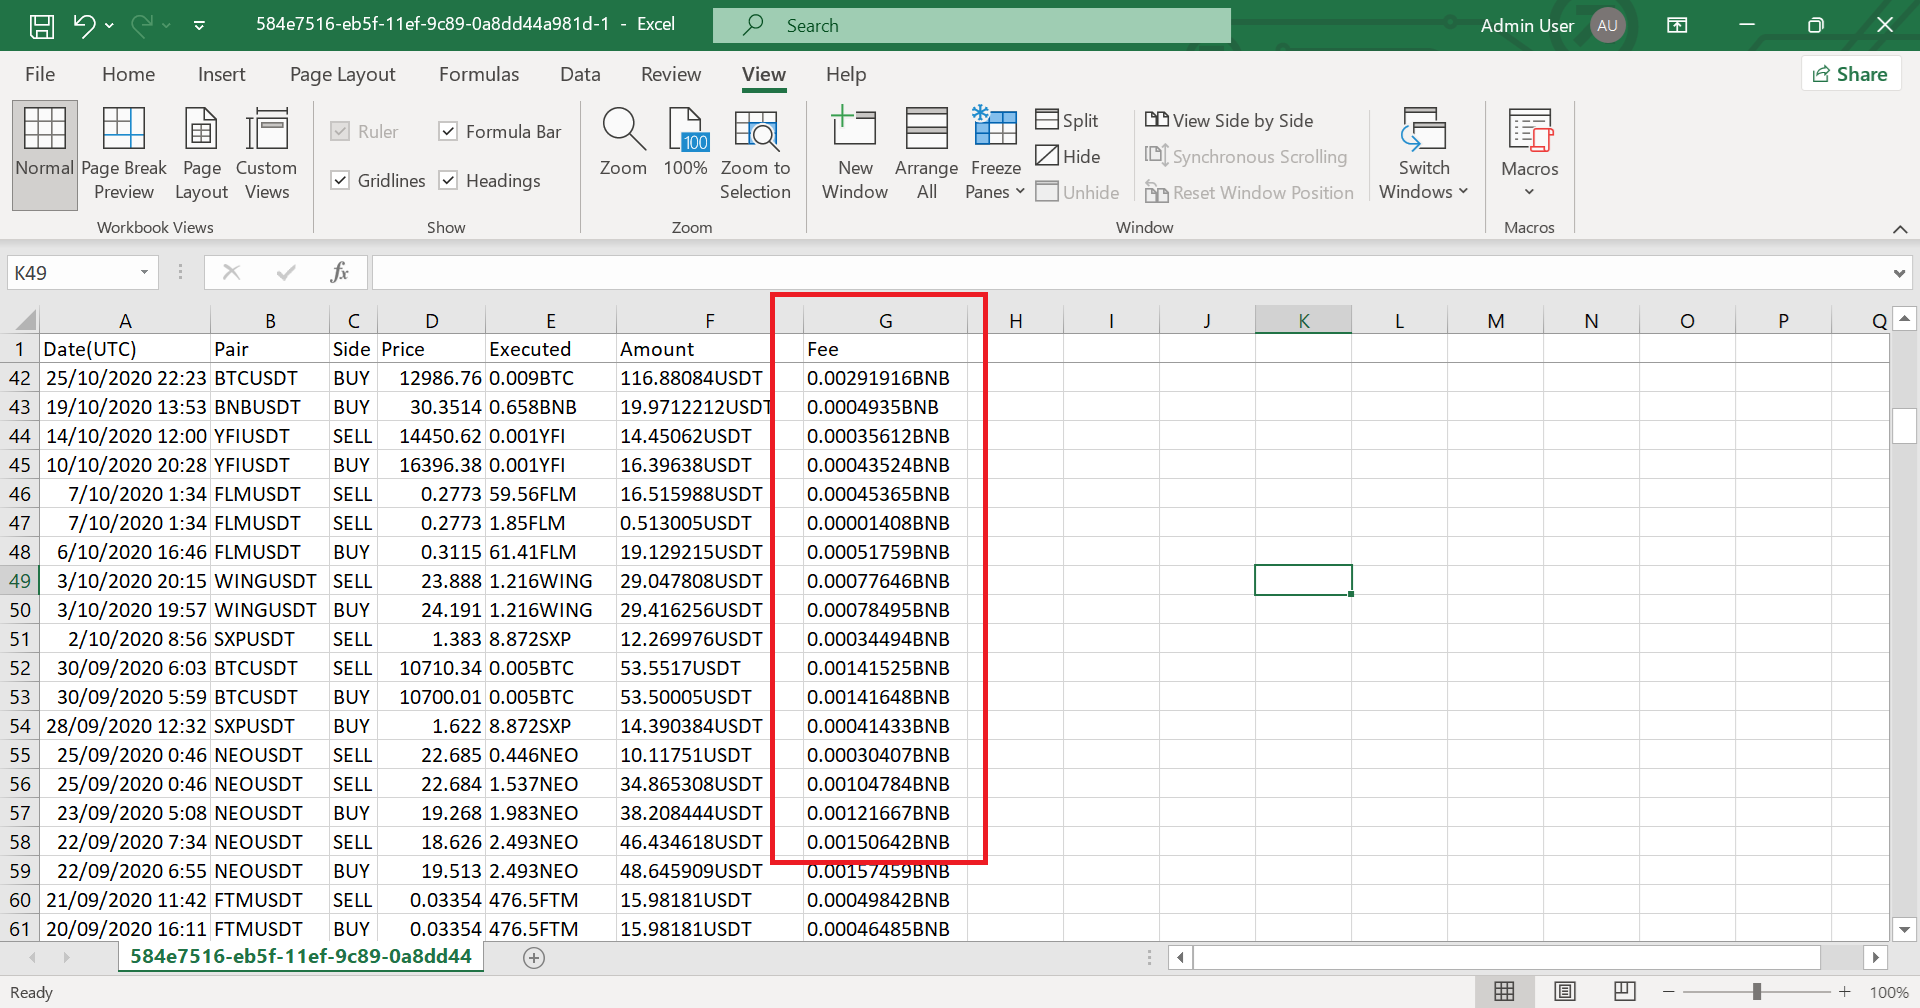
That is correct. Only the cells in column G (left blue table) with BNB at the end of each number need converting to USD. Skip all the others.
Those 4 rows look good to me. Hopefully you can find a solution to the problem with values in the left-blue table not being found in right-blue.
I forgot to upload 2 more workbooks (1 table each) with additional rows of transactions that require BNB fee conversions. Both tables are in the same format as the SPOT table but with less rows of data (CROSS has 77, ISOLATED has 19). Sorry for not including these along with the SPOT file earlier. I promise this is everything.
Thank you again for your selfless efforts.
I've rounded the dates to the minute and now the fee in USD is returned for almost all the data. There are no fees only for e.g. 30.12.2020 and 31.12.2020 since the large blue table ends on 08.12.2020. The attached file contains the data from the 2 additional workbooks as well. You are welcome. Kind regards.
 alexx1202Feb 26, 2025Copper Contributor
I now have all BNB fees converted.
I have arranged the sheet with all rows groups into their respective trades.
Can I quickly calculate the P/L on all trades instantly via formula?
If all trades had only 2 rows each (1 buy and 1 sell) then I could do it myself but I get confused on how to make it work when there are trades with e.g. 4 rows (1 buy and 3 sells).
Every trade is a long position so PL calculation for the first trade in the SPOT file would = subtract position value of buy (F3) then subtract total fees (G3:G4) then add position value of sell (F4).
 OliverScheurichFeb 27, 2025Gold Contributor
The attached sample file uses a few helper columns to calculate the P/L. If you work with Office 365 or Excel for the web then there are more up to date solutions.