postgresql on azure
26 TopicsSeptember 2026 Recap: Azure Database for PostgreSQL
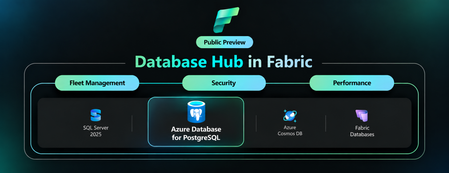
Features💡 Cross-Tenant Customer Managed Key (CMK) now Generally Available In September, cross-tenant customer-managed key (CMK) support became generally available for Azure Database for PostgreSQL flexible server. This capability enables independent software vendors (ISVs) and other service providers to host PostgreSQL resources in their tenant while their customers retain control of encryption keys stored in Azure Key Vault or Azure Managed HSM in a separate Microsoft Entra tenant. Using a multitenant application and user-assigned managed identity, organizations can maintain tenant separation while meeting data-protection and key-governance requirements. Learn more about cross-tenant customer-managed keys for Azure Database for PostgreSQL. Database Hub in Microsoft Fabric: A Single View of Your PostgreSQL Estate (Preview) Database Hub in Microsoft Fabric is now in public preview with support for Azure Database for PostgreSQL flexible server. One place to discover, monitor, and secure your entire database estate across PostgreSQL, Azure SQL, Azure Cosmos DB, and Azure SQL Server. No more hopping between portals and per-server dashboards. What you can do today: Estate view automatically discovers the PostgreSQL flexible servers you can access through Microsoft Entra ID and Azure RBAC, with filters for subscription, resource group, and tags. Security posture flags issues and suggestions such as Microsoft Entra authentication, public network access, and customer-managed keys. Fleet monitoring tracks CPU, memory, storage, IOPS, connections, and read replica lag across your servers. Spot what needs attention, then jump straight to the Azure portal or VS Code to act. No data movement, no agents. Learn more: A Single View of Your PostgreSQL Estate: Database Hub in Public Preview Azure Backup for PostgreSQL Flexible Server (v2) Public preview Azure Backup for PostgreSQL Flexible Server (v2) is now in Public Preview, bringing a redesigned, physical snapshot-based backup architecture that removes several key limitations of v1. You can now protect databases up to 32 TB on Premium SSD v1 and 64 TB on Premium SSD v2, compared with the previous 1 TB limit, and schedule daily or weekly backups with incremental backups after the first full backup, improving from v1’s weekly full backup cadence. V2 also introduces support for elastic clusters and Restore as Server, allowing recovery directly to a target flexible server or elastic cluster instead of restoring files to a storage account and manually importing them. Long-term retention remains available for up to 10 years, with additional protection through capabilities such as WORM immutability, soft delete, and multi-user authorization. Learn more: Azure Backup for PostgreSQL flexible server and elastic cluster (v2) is now in public preview | Microsoft Community Hub Azure PostgreSQL Learning Byte 🎓 PostgreSQL Skills Did you kow that with PostgreSQL Skills you can bring expert guidance, live database context, execution tools, and built-in validation into the development workflow? With 32 expert sub-skills, you can build capabilities such as vector search and row-level security, troubleshoot query performance, and manage high availability, disaster recovery, upgrades, and authentication. The plugin detects the environment automatically and routes each request to the right guidance, with one installation that works across GitHub Copilot CLI, VS Code, Claude Code, and Codex CLI. Learn more: Postgres Skills: Give Your AI Agent PostgreSQL Expertise26Views0likes0CommentsPostgres Trip Report from Postgres Summit US 2026
Photo gallery: Microsoft team at Postgres Summit US 2026 Postgres Summit US 2026 was a conference of connections: between database internals and the infrastructure underneath them, between AI ideas and production engineering, and between the people building PostgreSQL today and those who will carry it forward. For anyone who could not be in New York, this report captures the talks, technical questions, hallway conversations, and community moments that defined the week. The event also opened a new chapter. After years as PGConf NYC, the conference returned as Postgres Summit US, bringing more than 240 developers, DBAs, architects, contributors, technology leaders, and partners to Convene on Broadway from September 30 through October 2. The Microsoft team contributed six sessions across performance, replication, infrastructure, benchmarking, AI, developer tools, and community sustainability. Around those talks was a much larger program shaped by speakers and attendees from across the PostgreSQL ecosystem. 01 - Microsoft speaker highlights 02 - What the wider program was talking about 03 - Workshops and the hallway track 04 - The conversations continued after the slides 05 - What we brought home from New York 06 - Explore the Postgres Summit US 2026 program Gratitude for the organizers, speakers, sponsors, and attendees 01 - Microsoft speaker highlights Abe Omorogbe and Jared Meade: "Tour of Postgres on Azure with HorizonDB, Agentic workflows, & VS Code." Their end-to-end tour moved from HorizonDB's shared-storage architecture, rapid failover, and elastic read scale to SQL-declared chunking and embedding pipelines, durable incremental processing, intelligent product search, Copilot CLI Postgres skills, and an interactive VS Code query-plan visualizer. Although the demos used Microsoft technology, the engineering message applied broadly: production AI needs a dependable data layer, observable workflows, and tools that help developers understand what the database is doing. Microsoft Azure HorizonDB Documentation Landing Page | Microsoft Learn Claire Giordano delivered two talks that connected PostgreSQL's technical foundations with its future. In "A Secret Decoder Ring for Postgres Replication: A Beginner's Guide," Claire turned the alphabet soup of logical, physical, streaming, synchronous, and asynchronous replication into approachable mental models tied to high availability, disaster recovery, read scaling, migrations, WAL, and Patroni. In "Building the next generation of Postgres contributors: what's working & what's getting in the way," she marked PostgreSQL's 30th anniversary by examining the project through three lenses: the soul of its people and culture, the machine of its workflows and governance, and the fuel of economics and funding. Together, the talks asked both how PostgreSQL keeps data moving and how the community keeps itself moving. Divya Bhargov: "Same Postgres, Moving Ground: How Infrastructure Changes Shape Database Behavior." Divya explored a production reality that applies to every environment: PostgreSQL can remain stable while VM families, storage layers, operating systems, kernels, and networking stacks change underneath it. Drawing from large-scale operational experience, she showed why teams should correlate database symptoms with infrastructure transitions before assuming every behavioral change originated inside PostgreSQL. Gayathri Paderla: "PostgreSQL Performance Mysteries: When Low IOPS Still Means High Latency." Gayathri unpacked real production cases where latency increased even though familiar signals such as IOPS, query duration, CPU pressure, and indexing did not point to the cause. The trail instead led through memory behavior, cache eviction, PostgreSQL shared buffers, the operating system page cache, and storage interactions. The session showed how to correlate pg_buffercache, pg_stat_statements, wait events, storage behavior, and cache-warming techniques such as pg_prewarm. The practical lesson was memorable: low IOPS does not mean storage is uninvolved, and a normal query metric does not mean the application is experiencing normal latency. Here are the slides from the talk. PostgreSQL Performance Mysteries When low IOPS still means high latency - Speaker Deck Richard Yen: "Pushing PostgreSQL to the Limit: How to Benchmark Hardware with Postgres." Richard challenged the numbers used to sell hardware and cloud storage. Massive advertised IOPS or throughput does not tell a DBA whether the real limit will be storage, CPU bandwidth, PostgreSQL locks, checkpoints, archive_mode overhead, or autovacuum interference. His session focused on building an impartial PostgreSQL benchmarking harness, instrumenting both system and database metrics, and avoiding synthetic-test traps that can produce confident but misleading conclusions. Pushing PostgreSQL to the Limit: How to Benchmark Hardware with Postgres 02 - What the wider program was talking about Beyond the Microsoft sessions, the schedule showed where PostgreSQL engineering is headed. The keynote "Lessons Learned from Developing Agentic AI Tooling for Postgres" set a practical tone for AI. Other sessions explored hybrid search, agent memory, AI-agent security, PostgreSQL 19, planner behavior, VACUUM, index prefetching, change data capture, driver maintenance, Kubernetes migrations, replication, and zero-downtime operations. The breadth of the program mattered. Healthcare, financial services, government, SaaS, analytics, and cloud-native teams have different workloads, but they share the same production requirements: reliability, security, predictable performance, recovery, regional availability, and a clear way to choose the right platform for each workload. The question is no longer simply whether PostgreSQL is enterprise ready. It is how each organization should use PostgreSQL without creating unnecessary operational complexity. 03 - Workshops and the hallway track The workshop track made the conference approachable for people at different stages of their PostgreSQL journey. Sessions such as "Getting Comfortable with Postgres," "Postgres DBA Basics Nobody Told You,"And "Locks, Monitoring & the Config That Matters" turned administration, configuration, troubleshooting, and performance concepts into hands-on practice. That mix of beginner-friendly learning and deep technical sessions is one of the best things about PostgreSQL conferences. Photo gallery: hands-on learning and community conversations 04 - The conversations continued after the slides The Day 1 reception gave everyone time to compare notes after the first full program, and many of the best exchanges continued at sponsor booths, over dinner, and between sessions. Engineers compared production lessons. Contributors heard directly from users. Teams discovered that problems they had considered unique were often shared by people at other companies. That hallway track is difficult to capture in an agenda, but it is a big reason people travel to PostgreSQL events. Postgres Summit US is organized by the United States PostgreSQL Association (PgUS) and supported by volunteer organizers, reviewers, speakers, and sponsors. The sponsor community included cloud providers, database companies, observability vendors, and open-source specialists. Microsoft was proud to participate, but the event's real strength came from the range of people willing to share what they had built, what had failed, and what they had learned. 05 - What we brought home from New York Microsoft brought home five key takeaways from Postgres Summit US 2026: Production AI is now a PostgreSQL architecture and operations discussion. The community is moving beyond AI prototypes toward dependable data foundations, secure agent access, observable pipelines, hybrid search, and production-ready developer tooling. Infrastructure changes can affect database behavior even when PostgreSQL itself has not changed. VM, storage, operating-system, kernel, and networking changes must be considered when diagnosing PostgreSQL performance and reliability. Observability and explainability are essential at scale. Effective diagnosis requires correlating PostgreSQL internals, query behavior, memory, caching, wait events, infrastructure metrics, and storage behavior rather than relying on one familiar metric. Organizations want to consolidate more workloads on PostgreSQL without increasing operational complexity. Customers expect simpler operations, predictable performance, stronger recovery, high availability, and clear guidance for selecting the right PostgreSQL platform. Community knowledge sharing remains one of PostgreSQL’s greatest strengths. Technical sessions, workshops, hallway conversations, and candid production lessons help practitioners, contributors, and new community members learn from one another. These takeaways reinforce Microsoft’s continued investment in PostgreSQL performance, developer experiences, AI integration, operational reliability, and open-source collaboration. The transition from PGConf NYC to Postgres Summit US felt appropriate. The event still had the technical depth, welcoming hallway conversations, and practical learning that people value, but the scope was broader. AI-enabled applications are moving into production, PostgreSQL 19 is opening new possibilities, and operators are asking sharper questions about reliability and performance. Microsoft will continue investing in PostgreSQL performance, developer experiences, AI integration, and open-source collaboration. We are already looking forward to the next gathering. Microsoft booth, reception, community dinner, and New York moments 06 - Explore the Postgres Summit US 2026 program Conference schedule :https://postgresql.us/events/postgressummitus2026/schedule/ Conference sessions and abstracts: https://postgresql.us/events/postgressummitus2026/sessions/ Gratitude for the organizers, speakers, sponsors, and attendees A conference like this only happens because many people contribute behind the scenes. Thank you to Postgres Summit US, the volunteer organizers, the program committee, the speakers who did the work behind every slide and demo, the sponsors who helped make the event possible, and the attendees who brought thoughtful questions and real production experience into every room. To everyone who shared a lesson, asked a difficult question, demonstrated a new idea, or welcomed someone new to the community: thank you. Hopefully these photos and highlights give you a feel for the energy in New York. See you at the next PostgreSQL gathering.What sustained PostgreSQL performance really requires: Lessons from an independent benchmark
Coauthored by Jared Meade and Teneil Lawrence For teams running transaction-intensive applications, database performance is rarely about a single specification. More vCores can help, but compute is only one part of the equation. Storage performance, workload concurrency, high availability, and database configuration all influence how a PostgreSQL workload performs under sustained demand. That is why we recently commissioned Principled Technologies to independently evaluate Azure Database for PostgreSQL and Amazon RDS for PostgreSQL using a high-concurrency OLTP workload. In the configurations tested, Azure Database for PostgreSQL – flexible server delivered 72.7% higher throughput without high availability and 79.2% higher throughput with high availability than the tested Amazon RDS for PostgreSQL configurations. Those results are compelling, but the more useful story for teams evaluating a Postgres managed service is what sits behind them. The study reinforces an important principle for planning database infrastructure: sustained performance depends on how compute, storage, availability, and workload characteristics work together. Putting PostgreSQL performance to the test Principled Technologies used HammerDB 5.0 and its TPROC-C workload, which is derived from TPC-C and designed to simulate a transaction-intensive environment. The test used a 3,000-warehouse database and evaluated performance across increasing numbers of virtual users. The study compared: Azure Database for PostgreSQL – flexible server using a Standard_D16s_v6 compute instance with Premium SSD v2 storage Amazon RDS for PostgreSQL using a db.m7i.4xlarge instance with gp3 storage Both configurations used 16 vCPUs, 64 GB of memory, and 2,048 GB of storage. The Azure configuration provisioned 80,000 IOPS and 1,200 MB/s of storage throughput, while the Amazon RDS configuration provisioned 40,000 IOPS and 1,200 MB/s. Both environments were configured with wal_level=logical. Principled Technologies tested each platform both with and without high availability enabled. For Azure, that meant zone-redundant high availability. For Amazon RDS, the study used Single-AZ and Multi-AZ configurations. To measure sustained rather than momentary performance, each test included a 30-minute warm-up followed by a 30-minute measurement period and a five-minute cooldown. Each configuration was tested three times, with the database restored between runs, and the median result was reported. The results showed: Without HA: Azure Database for PostgreSQL achieved 51,134 new orders per minute (NOPM), compared with 29,605 NOPM for the tested Amazon RDS configuration, a 72.7% advantage. With HA: Azure achieved 53,620 NOPM, compared with 29,907 NOPM for the tested Amazon RDS configuration, a 79.2% advantage. Just as importantly for teams designing resilient applications, Principled Technologies found that enabling zone-redundant HA did not meaningfully reduce throughput on the Azure configuration tested. These findings apply to the specific configurations and methodology evaluated in the report. Every PostgreSQL workload is different, which is why independent benchmarks are most valuable as a starting point for your own performance evaluation. Performance is a system, not a single number It can be tempting to look at a database benchmark and attribute the result to one component. In practice, PostgreSQL performance is more interconnected. A transaction-intensive workload can be constrained by CPU, storage IOPS, throughput, latency, query behavior, connection patterns, or a combination of these factors. Increasing the capability of one layer will not automatically improve application performance if another layer becomes a bottleneck. Storage is an especially important part of that equation for OLTP workloads. The Azure configuration in the Principled Technologies study used Premium SSD v2, which gives customers flexibility to configure storage capacity, IOPS, and throughput independently, within supported limits. That flexibility can help teams align storage resources more closely with the characteristics of their workload instead of treating storage capacity and performance as the same sizing decision. The benchmark should not be interpreted as showing that storage alone produced the performance difference. The results reflect the complete configurations tested, including Dv6 compute, Premium SSD v2, PostgreSQL configuration, and the characteristics of the TPROC-C workload. The practical takeaway is straightforward: understanding where your workload is constrained is essential to making the right scaling decision. Expanding storage choices for demanding PostgreSQL workloads We are continuing to expand the storage options available for Azure Database for PostgreSQL, giving customers more flexibility as workload requirements evolve. Azure Ultra Disk is now available in preview for Azure Database for PostgreSQL, providing another storage option for I/O-intensive workloads that require high levels of IOPS and throughput with low latency. Like Premium SSD v2, Ultra Disk allows customers to configure storage capacity and performance independently within supported limits. We are also bringing storage autogrow for Premium SSD v2, helping customers address a different operational challenge: capacity growth. Storage autogrow is designed to automatically increase provisioned storage as available capacity becomes constrained, reducing the need for teams to manually manage storage expansion. These capabilities were not used in the Principled Technologies benchmark, and they should not be viewed as drivers of the results. Instead, they represent the next step in giving PostgreSQL teams more options to match storage infrastructure to their application requirements. That distinction matters. A workload approaching its storage capacity limit has a different problem from one constrained by IOPS or latency. Autogrow can help address capacity management, while a workload with demanding I/O requirements may warrant evaluating a different storage configuration or tier. The goal is always to give teams the flexibility to make that choice based on evidence. So how do you make that decision? Start with the workload Benchmarks can provide a useful reference point, but the best performance plan starts with your own application. As you evaluate PostgreSQL infrastructure, consider a few questions: What does peak demand look like? Measure sustained and peak transaction volume rather than relying only on averages. Where is the workload constrained? Look across CPU utilization, IOPS, throughput, storage latency, query execution, and connection behavior. How quickly is the database growing? Capacity requirements and performance requirements do not always grow at the same rate. What availability architecture does the application require? Test performance with the same HA configuration you expect to use in production. Does your test reflect production behavior? Representative data volumes, concurrency, query patterns, and transaction characteristics matter. The Principled Technologies study provides one useful data point. Under the specific 16-vCPU configurations and TPROC-C methodology tested, Azure Database for PostgreSQL - flexible server delivered higher OLTP throughput than the tested Amazon RDS for PostgreSQL configurations, both with and without high availability enabled. For us, the takeaway goes beyond the benchmark percentage. As PostgreSQL workloads become more demanding, teams need the ability to align compute, storage, and availability with the characteristics of their applications. With Dv6 compute, Premium SSD v2, expanding storage capabilities such as Ultra Disk, and greater automation for storage management, Azure Database for PostgreSQL Flexible Server continues to give teams more options for doing exactly that. Read the full Principled Technologies report to explore the configurations, methodology, and results, and use the findings as a starting point for testing the workloads that matter most to your applications.June 2025 Recap: Azure Database for PostgreSQL
Hello Azure Community, We have introduced a range of exciting new features and updates to Azure Database for PostgreSQL in June. From general availability of PG 17 to public preview of the SSD v2 storage tier for High Availability, there have been some significant feature announcements across multiple areas in the last month. Stay tuned as we dive deeper into each of these feature updates. Before that, let’s look at POSETTE 2025 highlights. POSETTE 2025 Highlights We hosted POSETTE: An Event for Postgres 2025 in June! This year marked our 4th annual event featuring 45 speakers and a total of 42 talks. PostgreSQL developers, contributors, and community members came together to share insights on topics covering everything from AI-powered applications to deep dives into PostgreSQL internals. If you missed it, you can catch up by watching the POSETTE livestream sessions. If this conference sounds interesting to you and want to be part of it next year, don’t forget to subscribe to POSETTE news. Feature Highlights General Availability of PostgreSQL 17 with 'In-Place' upgrade support General Availability of Online Migration Migration service support for PostgreSQL 17 Public Preview of SSD v2 High Availability New Region: Indonesia Central VS Code Extension for PostgreSQL enhancements Enhanced role management Ansible collection released for latest REST API version General Availability of PostgreSQL 17 with 'In-Place' upgrade support PostgreSQL 17 is now generally available on Azure Database for PostgreSQL flexible server, bringing key community innovations to your workloads. You’ll see faster vacuum operations, richer JSON processing, smarter query planning (including better join ordering and parallel execution), dynamic logical replication controls, and enhanced security & audit-logging features—backed by Azure’s five-year support policy. You can easily upgrade to PostgreSQL 17 using the in-place major version upgrade feature available through the Azure portal and CLI, without changing server endpoints or reconfiguring applications. The process includes built-in validations and rollback safety to help ensure a smooth and reliable upgrade experience. For more details, read the PostgreSQL 17 release announcement blog. General Availability of Online Migration We're excited to announce that Online Migration is now generally available for the Migration service for Azure Database for PostgreSQL! Online migration minimizes downtime by keeping your source database operational during the migration process, with continuous data synchronization until cut over. This is particularly beneficial for mission-critical applications that require minimal downtime during migration. This milestone brings production-ready online migration capabilities supporting various source environments including on-premises PostgreSQL, Azure VMs, Amazon RDS, Amazon Aurora, and Google Cloud SQL. For detailed information about the capabilities and how to get started, visit our Migration service documentation. Migration service support for PostgreSQL 17 Building on our PostgreSQL 17 general availability announcement, the Migration service for Azure Database for PostgreSQL now fully supports PostgreSQL 17. This means you can seamlessly migrate your existing PostgreSQL instances from various source platforms to Azure Database for PostgreSQL flexible server running PostgreSQL 17. With this support, organizations can take advantage of the latest PostgreSQL 17 features and performance improvements while leveraging our online migration capabilities for minimal downtime transitions. The migration service maintains full compatibility with PostgreSQL 17's enhanced security features, improved query planning, and other community innovations. Public Preview of SSD v2 High Availability We’re excited to announce the public preview High availability (HA) support for the Premium SSD v2 storage tier in Azure Database for PostgreSQL flexible server. This support allows you to enable Zone-Redundant HA using Premium SSD v2 during server deployments. In addition to high availability on SSDv2 you now get improved resiliency when using Premium SSD v2 with zone-redundant HA, helping customers build resilient, high-performance PostgreSQL applications with minimal overhead. This feature is particularly well-suited for mission-critical workloads, including those in financial services, real-time analytics, retail, and multi-tenant SaaS platforms. Key Benefits of Premium SSD v2: Flexible disk sizing: Scale from 32 GiB to 64 TiB in 1-GiB increments Fast failovers: Planned or unplanned failovers typically around 10 seconds Independent performance configuration: Achieve up to 80,000 IOPS and 1,200 Mbps throughput without resizing your disk. Baseline performance: Free throughput of 125 MB/s and 3,000 IOPS for disks up to 399 GiB, and 500 MB/s and 12,000 IOPS for disks 400 GiB and above at no additional cost. For more details, please refer to the Premium SSD v2 HA blog. New Region: Indonesia Central New region rollout! Azure Database for PostgreSQL flexible server is now available in Indonesia Central, giving customers in and around the region lower latency and data residency options. This continues our mission to bring Azure PostgreSQL closer to where you build and run your apps. For the full list of regions visit: Azure Database for PostgreSQL Regions. VS Code Extension for PostgreSQL enhancements The brand-new VS code extension for PostgreSQL launched in mid-May and has already garnered over 122K installs from the Visual Studio Marketplace! And the kickoff blog about this new IDE for PostgreSQL in VS Code has had over 150K views. This extension makes it easier for developers to seamlessly interact with PostgreSQL databases. We have been committed to make this experience better and have introduced several enhancements to improve reliability and compatibility updates. You can now have better control over service restarts and process terminations on supported operating systems. Additionally, we have added support for parsing additional connection-string formats in the “Create Connection” flow, making it more flexible and user-friendly. We also resolved Entra token-fetching failures for newly created accounts, ensuring a smoother onboarding experience. On the feature front, you can now leverage Entra Security Groups and guest accounts across multiple tenants when establishing new connections, streamlining permission management in complex Entra environments. Don’t forget to update to the latest version in the marketplace to take advantage of these enhancements and visit our GitHub repository to learn more about this month’s release. If you learn best by video, these 2 videos are a great way to learn more about this new VS Code extension: POSETTE 2025: Introducing Microsoft’s VS Code Extension for PostgreSQL Demo of using VS code extension for PostgreSQL Enhanced role management With the introduction of PostgreSQL 16, a strict role hierarchy structure has been implemented. As a result, GRANT statements that were functional in PostgreSQL 11-15 may no longer work in PostgreSQL 16. We have improved the administrative flexibility and addressed this limitation in Azure Database for PostgreSQL flexible server across all PostgreSQL versions. Members of ‘azure_pg_admin’ can now manage, and access objects owned by any role that is non-restricted, giving control and permission over user-defined roles. To learn more about this improvement, please refer to our documentation on roles. Ansible collection released for latest REST API version A new version of Ansible collection for Azure Database for PostgreSQL flexible server is now released. Version 3.6.0 now includes the latest GA REST API features. This update introduces several enhancements, such as support for virtual endpoints, on-demand backups, system-assigned identity, storage auto-grow, and seamless switchover of read replicas to a new site (Read Replicas - Switchover), among many other improvements. To get started with using please visit flexible server Ansible collection link. Azure Postgres Learning Bytes 🎓 Using PostgreSQL VS code extension with agent mode The VS Code extension for PostgreSQL has been trending amongst the developer community. In this month's Learning Bytes section, we want to share how to enable the extension and use GitHub Copilot to create a database in Agent Mode, add dummy data, and visualize it using the Agent Mode and VS Code extension. Step 1: Download the VS code Extension for PostgreSQL Step 2: Check GitHub Copilot and Agent mode is enabled Go to File -> Preferences -> Settings (Ctrl + ,). Search and enable "chat.agent.enabled" and "pgsql copilot.enable". Reload VS Code to apply changes. Step 3: Connect to Azure Database for PostgreSQL Use the extension to enter instance details and establish a connection. Create and view schemas under Databases -> Schemas. Step 4: Visualize and Populate Data Right-click the database to visualize schemas. Ask the agent to insert dummy data or run queries. Conclusion That's all for the June 2025 feature updates! We are dedicated to continuously improve Azure Database for PostgreSQL with every release. Stay updated with the latest updates to our features by following this link. Your feedback is important and helps us continue to improve. If you have any suggestions, ideas, or questions, we’d love to hear from you. Share your thoughts here: aka.ms/pgfeedback We look forward to bringing you even more exciting updates throughout the year, stay tuned!1.1KViews3likes0Comments
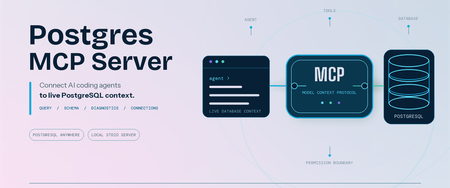
Postgres MCP Server: Connect AI coding agents to PostgreSQL
Coding agents can write SQL, troubleshoot applications, and reason about data. Useful database work starts with your schema and environment context. We are pleased to announce that Microsoft has open-sourced the Postgres MCP Server under the MIT License. Built entirely in Rust for fast, resource-efficient operation, it connects Model Context Protocol (MCP) compatible coding agents to PostgreSQL, so your agent can inspect real database context and run permitted operations. The server works with PostgreSQL locally, on-premises, on Azure, AWS, GCP, or through another PostgreSQL-compatible service. It is built for anyone who works with PostgreSQL through a coding agent, including application developers, database administrators, data professionals, platform engineers, and PostgreSQL enthusiasts. Give AI agents live PostgreSQL context The Postgres MCP Server exposes PostgreSQL operations as tools that your coding agent can call. After connecting to a profile, ask: "List the tables in my PostgreSQL database." "Show me the ten most recent orders." "Generate the schema for these tables and indexes." "What is slowing down my PostgreSQL server?" The tools let your agent: Generate queries and run analytics. Run read-only SQL or use separate tools for data and schema changes. Explore and design schemas. Inspect tables, indexes, functions, sequences, and other database objects before generating database changes. Diagnose performance. Detect server capabilities and collect focused performance metrics for the server and its queries. Manage connections. Create named connection profiles, connect to the right database, and switch between environments without placing credentials in the MCP client configuration. Install and connect securely Prerequisites: Node.js 22 or later, which includes npm and npx. Linux x64 or arm64, macOS x64 or arm64, or Windows x64. Windows on Arm uses x64 emulation. An MCP-compatible coding agent or client. A reachable PostgreSQL or wire-compatible database and a database role with the permissions needed for your intended tasks. No separate installation is required when you use npx; it downloads and runs the package for you. If you prefer the postgres-mcp command to be available globally, install the package: npm install --global @Microsoft/postgres-mcp The examples use npx. With a global installation, replace npx -y Microsoft/postgres-mcp with postgres-mcp. Create a profile and store its password: npx -y @Microsoft/postgres-mcp connection add local \ "postgresql://postgres@localhost:5432/postgres" npx -y @Microsoft/postgres-mcp connection set-password local The server stores the password in your operating system keyring, separate from the profile. For headless or CI environments without a keyring, use the environment-based connection option. Add the server to clients that use the mcpServers configuration: { "mcpServers": { "postgres": { "command": "npx", "args": ["-y", "@microsoft/postgres-mcp", "run"] } } } Configuration formats and file locations differ by client. The Postgres MCP usage guide includes examples for supported clients. For Azure Database for PostgreSQL, the server can use Microsoft Entra ID when a saved profile does not contain a password. PostgreSQL role permissions remain the security boundary. New profiles permit write tools unless you set access_mode: ro. For exploration, combine that setting with a read-only database role. Your MCP client controls approval prompts, and CSV tools can read only from approved local paths. Add expert PostgreSQL skills The open-source Postgres Skills repository complements the MCP server with expert guidance for query performance, indexing, vector search, security, operations, Azure workflows, and AI and knowledge graph scenarios. These reusable instructions help coding agents apply PostgreSQL best practices when investigating an issue or completing a task, while the MCP server supplies the live database context and permitted operations needed to act on that guidance. Next steps Explore the Postgres MCP Server repository. Review the Postgres MCP usage and security guide. Follow the Postgres Skills plugin setup guide. Share feedback or contribute through Postgres MCP GitHub issues. Thank you!1.3KViews0likes1Comment
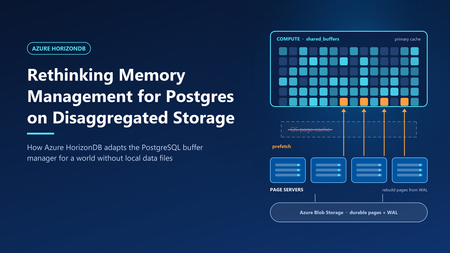
Rethinking Memory Management for Azure HorizonDB on Disaggregated Storage
In Smarter Storage for Azure HorizonDB, we described how HorizonDB moves durability, replication, checkpointing, and recovery out of PostgreSQL and into a purpose-built storage layer. The compute node writes only the write-ahead log (WAL). Data pages are rebuilt and stored by remote page servers. That design raises an obvious question: if PostgreSQL no longer reads and writes its own data files, what happens to its memory management? PostgreSQL's buffer manager was built around a specific partner: the operating system's page cache. Many of its defaults and heuristics only make sense because the kernel is quietly doing a lot of work underneath. HorizonDB removes that partner. This post explains which assumptions broke, and the changes we made to the PostgreSQL engine, so memory works well on disaggregated storage. What PostgreSQL assumes about the kernel PostgreSQL stores each table and index as ordinary files and accesses them with buffered I/O. Every page therefore can live in two places in memory: in PostgreSQL's own buffer pool (shared_buffers) and in the operating system's page cache. This "double buffering" is a deliberate part of the design, and it shapes several behaviors. A modest buffer pool. The PostgreSQL documentation suggests starting shared_buffers at about 25% of system memory. Much of the rest is expected to act as kernel file cache. A page evicted from shared_buffers is often still in the kernel cache, so reading it back costs a memory copy rather than a disk read. Prefetching is a hint to the kernel. When PostgreSQL knows it will need a page soon—during a bitmap heap scan, for example—it calls posix_fadvise with POSIX_FADV_WILLNEED. The kernel starts reading the page into its cache. A later read finds it there. PostgreSQL itself never allocates a buffer for the prefetched page. Sequential scans rely on kernel readahead. For sequential access, the kernel detects the pattern and reads ahead automatically, so PostgreSQL can issue fewer explicit hints. Ring buffers protect the cache. Large sequential scans, VACUUM, and bulk writes such as COPY use a small private ring of buffers—from a few hundred kilobytes to a few megabytes—instead of the whole buffer pool. A scan of a table much larger than memory therefore cannot push the working set out of shared_buffers. This is safe because a page that cycles through the ring is usually still in the kernel cache if it is needed again. Writes are cheap and deferred. When a dirty buffer is evicted, PostgreSQL writes it to the kernel cache, which flushes it to disk later. The background writer cleans buffers ahead of eviction so that queries rarely wait for a write. Checkpoints write all dirty pages and call fsync to make them durable. Each of these behaviors assumes that a miss in shared_buffers is usually cheap, and that writing a page means writing it to a local file. What changes in HorizonDB Figure 1. Compute memory layout: Community PostgreSQL vs. Azure HorizonDB. In HorizonDB, permanent tables and indexes do not exist as local files on the compute node. There is no kernel page cache holding database pages. A miss in shared_buffers must be served by the remote storage layer: Tier Where it lives Typical role Shared buffers Compute memory Working set; all pages are read and modified here SSD cache Compute local disk Extends shared buffers; holds cached copies of pages Page servers Remote storage fleet Page cache of the current version of every page Azure Blob Storage Remote, zone-redundant Durable backing store for pages and WAL A page that falls out of memory no longer drops into a free kernel cache. It may require a network round trip to a page server, which is much more expensive than a memory read. Writes change too. Because page servers rebuild pages from WAL, "writing" a dirty page on the compute node does not mean copying it anywhere. PostgreSQL only has to make sure the WAL describing the change is durable - a rule it already enforces before any page write. Taken together, this inverts the trade-offs behind PostgreSQL's defaults. Memory is no longer one of two caches. It is the primary cache. Design principle: shared buffers are the primary cache We organized the engine changes around one principle. shared_buffers is the primary cache, eliminating the memory overhead of double buffering and improving memory efficiency. Every page that is about to be needed should arrive in memory before the query asks for it. The following sections describe the engine changes that implement it. 1. Size shared buffers for the machine Without a kernel cache to share memory with, leaving 75% of RAM to the operating system would waste most of it. HorizonDB sizes shared_buffers automatically at 60–70% of the compute node's memory, depending on the size of the instance. The remaining memory is left for connections, query execution memory such as sorts and hashes, and the operating system. 2. Retire ring buffers Ring buffers exist so that a large scan can use a few megabytes of memory and rely on the kernel cache for anything it needs again. In HorizonDB, there is no such safety net. Recycling a small ring means that every page the scan touches is read, used once, and discarded—and a second scan of the same table must fetch everything again from storage. Ring buffers also exist to limit write traffic: a bulk operation that dirties pages in a small ring must write them out quickly. HorizonDB doesn't need to write dirty data pages back to disk at all, so that motivation disappears as well. HorizonDB therefore disables buffer ring strategies. Sequential scans, VACUUM, and bulk loads use the shared buffer pool like any other query. This is a trade-off, not a free win. A very large scan can now displace pages from shared_buffers that other queries were using. Two factors limit the cost. First, clock-sweep replacement tracks how often each buffer is used, so frequently accessed pages outlive pages a scan touched only once—and buffer replacement is an area we continue to improve. Second, pages that leave shared_buffers are not simply lost: HorizonDB can keep them close by in the local SSD cache. How it decides and what goes there is a story for a separate post. 3. Prefetch directly into shared buffers On a local disk, a prefetch miss costs a disk seek. On disaggregated storage, it costs a network round trip. Hiding that latency matters even more, so HorizonDB makes prefetching explicit, aggressive, and memory aware. Prefetch requests go to the page servers. When PostgreSQL issues a prefetch, HorizonDB sends a read request for the page to the page server that owns it, and does not wait for the answer. Each backend keeps a set of outstanding requests by default, so dozens of page reads overlap instead of running one after another. Sequential scans prefetch explicitly. PostgreSQL's read stream mechanism, which drives sequential scans and other block-range reads, normally avoids prefetching sequential blocks because it expects kernel readahead to cover them. HorizonDB turns that assumption off, so sequential reads are prefetched like any other access pattern. Responses land in their final buffer. In stock PostgreSQL, a prefetch only warms the kernel cache, so the later read still has to copy the page into shared_buffers. In HorizonDB, the page server's response goes straight into a shared buffer. When the query asks for the page, it is already in memory, with no extra copy and no second request to storage. These are only some of the prefetch optimizations we have built into the engine. Others use custom prefetch implementations and logic that tunes how far ahead each query reads. All of them share one goal: hiding storage latency so queries spend less time waiting on I/O and more time doing useful work. What this means for you As a fully managed service, our goal is to delight customers with a best-in-class PostgreSQL experience. You shouldn't have to think about kernel caches, buffer rings, or prefetch windows—that is our job. HorizonDB retains full PostgreSQL compatibility, so applications keep the familiar Postgres programming interface while the engine is tuned to deliver predictable performance on the storage underneath559Views5likes1CommentA Single View of Your PostgreSQL Estate: Database Hub in Public Preview
By Varun Dhawan, Matt McFarland, Erdem Tuna from Microsoft PostgreSQL team Azure Database for PostgreSQL support in Database Hub is now in public preview, bringing fleet visibility, security posture, and performance monitoring into one place. This preview is part of the broader vision outlined in our SQLCon Barcelona 2026 announcement: bringing database signals together so teams can see where attention is needed and take a well-informed next step. Here, we focus on the Azure PostgreSQL experience in Database Hub. Database Hub in Microsoft Fabric lets you monitor existing flexible servers in their Azure subscriptions and regions, without moving or mirroring data or building a new customer-managed telemetry pipeline. Baseline monitoring uses existing Azure Monitor metrics. Available capabilities vary by database service. Start with a practical question: Which PostgreSQL servers show sustained memory pressure, and which should I investigate first? Follow the three views below to narrow the scope and compare trends. See the PostgreSQL monitoring guide for setup and preview details. 1. Start with an estate-wide Overview Overview brings cross-engine findings and performance summaries into one starting point. Spot a signal worth investigating, such as elevated PostgreSQL memory usage, then open Estate to focus on the relevant resources. Figure 1: Overview combines cross-engine findings with performance summaries, including PostgreSQL, to help prioritize investigation. Illustrative mockup with sample data. 2. Focus on your Azure PostgreSQL estate In Estate, select the PostgreSQL view and filter by subscription or resource group to define the scope for the memory-pressure investigation. Compare the flexible servers you can access before choosing resources to examine: Filter your PostgreSQL estate by subscription or resource group to focus on the servers you manage. Review a flexible server's resource details in one place. The inventory represents server instances, not each database hosted inside them. Save and share a custom view for a scope you revisit regularly. Colleagues see only the resources their existing permissions allow. Figure 2: Estate filtered to PostgreSQL, bringing flexible server resources, status, findings, and subscription context into one inventory. Illustrative mockup with sample data. Once you have scoped your estate, switch to Performance and select the PostgreSQL servers you want to investigate. 3. Review security posture and performance Security posture In public preview, Database Hub assesses four aspects of your Azure PostgreSQL security configuration: Microsoft Entra authentication: identify servers where it is not enabled. Encryption at rest using customer-managed keys: review key management against your organization's policy. A server using service-managed keys is still encrypted at rest. Microsoft Entra authentication enforced: review whether Microsoft Entra authentication is required, rather than only available as an option. Public Network Access Disabled: review public exposure against your network policy. The private networking guidance explains the virtual network integration option. Performance monitoring In Performance, select the PostgreSQL dashboard and use CPU, memory, and storage summaries to identify servers that need a closer look. You can also review disk activity, connections, failed connections, and applicable read-replica lag. For the memory-pressure question, compare server trends over the same interval to distinguish sustained pressure from a brief spike. Use the Azure Monitor metric reference to match units and aggregation. Missing data is not proof of good health. Figure 3: Performance monitoring with PostgreSQL selected, illustrating utilization summaries and trends for closer investigation. Illustrative mockup with sample data. When a server needs a deeper look, continue in the Azure portal and PostgreSQL tools using the monitoring and diagnostics guidance. Preview scope: Monitoring is metric-based; query-level diagnostics remain in native PostgreSQL tools. Security findings are not a complete compliance audit. Database Hub does not automatically tune, resize, or remediate PostgreSQL servers. Check the servers selected in Performance: dashboard scope can differ from the Estate inventory. Why this matters if you run Postgres at scale Database Hub doesn't replace your PostgreSQL expertise or native tools. It reduces the work of finding which servers need attention, alongside your other supported database engines including SQL Database and Cosmos DB. The Database Hub FAQ explains the access boundaries and how the experiences fit together. Get started Review the Database Hub documentation and PostgreSQL prerequisites, then: Enable the preview: Ask your Fabric administrator to enable Users can access the Database hub (preview) in Tenant settings. Check access: Use a Microsoft Entra identity with Reader or greater permissions on each subscription containing the servers you want to monitor. Start here: open Database Hub in Microsoft Fabric. Scope your estate: In Estate, choose View: PostgreSQL and filter to the subscriptions or resource groups you manage. Compare servers: In Performance, select PostgreSQL, choose the servers to compare, and set the same time range and aggregation. Access boundary: Resource visibility and shared views do not grant permission to query databases. Existing PostgreSQL authentication and network controls still apply. As your PostgreSQL estate grows, Database Hub brings the bigger picture into focus, helping you see where attention is needed and take a more informed next step. We're excited to bring Azure PostgreSQL into this shared experience. Explore the public preview in Microsoft Fabric and discover a simpler way to stay on top of your PostgreSQL estate.349Views3likes2Comments
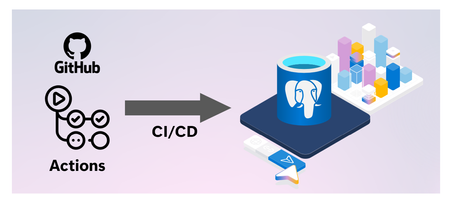
Database Change Management - Azure Database for PostgreSQL, GitHub Actions and Liquibase OSS
Introduction Database Change Management (DCM) is a comprehensive process of managing all changes to the database schema, objects, reference data, and code over the lifetime of an application. It encompasses version control, testing, deployment, and tracking of database evolutions in a consistent, reliable, and auditable manner. In modern DevOps practices, treating database changes just like application code helps maintain integrity across environments and reduces the risk of errors. Handling Database Change Management using Git Integrating database change management with GitHub brings the rigor, predictability, and safety of standard software development to relational database schemas. Much like application code deployments, where features are developed on feature branches, peer-reviewed via Pull Requests (PRs), and merged only after passing automated test suites. When integrated with GitHub Actions, database deployments transition from manual, error-prone runbooks executed by DBAs into fully automated, repeatable pipelines. When a pull request is merged into the master branch, GitHub triggers a workflow that automatically validates changelogs, dry-runs SQL changes against ephemeral test databases, and updates staging or production database servers, ensuring that database schema structures remain in perfect, synchronized step with the application code they support. Approach To implement database change management, multiple tools and frameworks must be used to handle automation, integrated approach and version management. Following Azure, Git and open-source tools will be used in this approach: Azure database for PostgreSQL (or Azure SQL database) GitHub repo GitHub actions Liquibase (open-source DB version control tool) Database schema migrations (using tools like Liquibase) are treated as declarative, version-controlled source files. This alignment allows teams to leverage the key advantages of Git: A single source of truth for database state A comprehensive and immutable audit trail of who modified what and when Ability to easily revert problematic schema changes by rolling back code commits. Tool Used – Liquibase Liquibase is an open-source, database-independent schema migration tool that treats database changes as code to automate continuous integration and deployment (CI/CD) pipelines. It operates by evaluating a user-defined core manifest file known as a Changelog, which contains granular, ordered tracking units called ChangeSets authored in SQL, YAML or JSON. When executed against a target database instance, the Liquibase engine checks the database's internal DATABASECHANGELOG tracking table to identify previously applied changesets by matching their unique combination of ID, Author, execution Filep and tag. Unexecuted changes (written in JSON or YAML) are dynamically translated via specialized JDBC drivers into dialect-specific SQL (such as PostgreSQL, SQL Server etc.) and executed within a single transaction wrapper. Beyond structural upgrades (update), Liquibase provides robust operational functionalities including Rollback capabilities, which allow to revert schema states back to targeted baseline schema tags or specific timestamps by executing explicit, user-defined “--rollback” blocks in reverse chronological order. Furthermore, it features comprehensive schema difference management via the “diff” and diff-changelog engines. This allows engineers to perform automated schema drift detection by comparing an active database against a reference baseline (or another active environment), instantly identifying disparities in tables, columns, indexes, or constraints, and auto-generating the exact operational changesets required to bring the environments back into structural synchronization. Migration-based Approach When managing database migrations, Liquibase provides three structural configuration patterns to declare and execute schema changes across environments: SQL, YAML, and JSON. Sample of SQL Changelog is given below. It follows SQL syntax of native database engine (PostgreSQL in this case): The Formatted SQL approach is highly recommended for database administrators and developers who require low-level control, as it uses standard, platform-native SQL scripts annotated with special comment tokens (like --changeset and --rollback) to direct the Liquibase parser. In contrast, the YAML and JSON approaches use a database-agnostic, declarative key-value abstraction model. Instead of raw DDL, developers define structural states using structural objects (such as “createTable” or “addColumn” fields). The Liquibase engine dynamically compiles these JSON/YAML objects into dialect-specific SQL using target JDBC drivers at runtime, while automatically inferring the exact inverse commands required for database rollbacks. Regardless of whether a team implements raw SQL for precise indexing and database-specific performance optimizations or leverages the strict serialization of JSON/YAML to maintain standardized, cross-platform migrations, all three file types integrate seamlessly into version control as a single source of truth for CI/CD automation. Versioning and Repeatable Migrations Liquibase governs schema versioning and repeatable migrations through a combination of tracking states and distinct changeset configurations. Unlike traditional application version numbering, Liquibase applies a state-driven versioning model where every discrete schema modification is tracked as an individual, ordered “changeset” identified by a unique composite key consisting of the id, author, changelog file and tag. When a deployment pipeline runs, the Liquibase engine queries the target database’s internal DATABASECHANGELOG table to evaluate this composite key signature; if the key exists, the migration is skipped to preserve environment stability. Architecture Overview A robust database change management architecture involves several key Azure components working together. At the core is Azure Database for PostgreSQL (Flexible Server) as the production-grade target database, often deployed with private endpoint connectivity to restrict network access. GitHub hosts the repository containing Liquibase migration scripts. GitHub Actions orchestrates CI/CD pipelines; a self-hosted runner, placed within the same Azure Virtual Network (VNet) as the database, executes Liquibase commands to apply migrations securely with minimal network latency. Secrets such as database connection strings and credentials are stored securely in Azure Key Vault or GitHub Secrets. Workflows use the Azure/login and azure/get-keyvault-secrets actions to fetch Azure secrets at runtime. GitHub secrets are fetched automatically when referenced in the workflow. Liquibase updates the “DATABASECHANGELOG” table on the PostgreSQL instance each time a migration is applied, providing full tracking. This formation ensures that all database changes are automated, auditable, and under version control. Following are the architectural components: GitHub repo containing the DDL/DCL scripts to be applied to the database engine. GitHub actions containing the workflow that can be scheduled based on push or commit or at a time. GitHub actions self-hosted runner on Azure VM. Azure PostgreSQL database instance where changes are to be applied. Following architecture uses same SQL scripts for multi-environment deployment. Azure Database for PostgreSQL Configuration Azure Database for PostgreSQL should be configured with a private endpoint and integrated into the Virtual Network to ensure self-hosted runner has secure, internal access. Appropriate database schemas should already be available. User account that is to be used for Liquibase migrations should have necessary access like create and modify tables, “DATABASECHANGELOG” table which Liquibase uses to track applied migrations. GitHub “secrets” or Azure Key Vault should be used to store database connection and user details. Rollback action can be used to revert database changes, however, point-in-time restore (PITR) backups should be enabled so that database can be reverted to previous states if migration causes unintended effects. Set firewall rules to restrict public access, configure SSL connections to enforce encrypted traffic for database communication. Azure Monitor should be used to capture audit logs. GitHub Actions and Self-hosted Runner GitHub Actions workflows will execute Liquibase commands, set up a self-hosted runner within the same VNet as the Azure Database fir PostgreSQL server. Provision a lightweight Azure VM (Linux recommended). Following software needs to be installed: OpenJDK Liquibase “psql” PostgreSQL client tool. GitHub Actions runner application and register it with the repository, assigning it labels (e.g., self-hosted) so workflows can target it. Attach Azure managed identity (system or user assigned) with necessary RBAC permissions to retrieve secrets from Azure Key Vault at runtime and connect to database. Liquibase Configuration Liquibase configuration contains two files as mentioned below: Changelog file – Database SQL statements pertaining to the changes. This file is the major component of the configuration as it would contain SQL statements that are to be applied to the database. E.g. postgresdb.changelog.sql. The file should follow Liquibase formatted SQL syntax. liquibase.properties – Contains peripheral details like schema and changelog configuration. Following are the key configuration parameters: changeLogFile=postgres_changelog/postgresdb.changelog.sql : Location of database changelog file relative to the location of where liquibase.properties file is stored. defaultSchemaName : Schema name in postgres database where changes will be applied. liquibaseSchemaName : Schema name in postgres database where Liquibase tracking tables will be created. logLevel : Level of logging by Liquibase execution. databaseChangeLogTableName and databaseChangeLogLockTableName : Liquibase tracking tables. Keep the default values. Setup & Execution Steps Please use the following GitHub repo to download all resources required for implementation. https://github.com/deepcontent2208/db_change_mgmt_liquibase_github.git CI/CD Pipeline Configuration CI Pipeline The Continuous Integration (CI) workflow in GitHub Actions should focus on validating migration scripts before they are merged into the main branch. Use triggers on pull requests targeting main. Begin steps by checking out the repository using actions/checkout@v4, ensuring that the sql migration and “liquibase.properties” files are available locally. Database authentication details can be stored either in Azure Key Vault or GitHub Secrets. These details will be extracted dynamically during workflow execution. Following is the code snippet for extraction: Next, execute Liquibase validate CI, by invoking CI GitHub workflow. Capture and report any validation errors to prevent faulty migrations from entering the code base. CD Pipeline Continuous Deployment (CD) workflows apply the validated migrations to target environments. Use on-demand triggers with workflow_dispatch for production deployments to avoid accidental changes. In your workflow configuration, after actions/checkout@v4, authenticate and fetch Key Vault secrets similarly to the CI pipeline. You may add environment approvals (GitHub Environments) for prod. 3 different CD workflows are being used – “Database Deployment”, “Database Rollback” and “Database Schema Drift”. Following is the architecture of schema deployment; it uses same repo to deploy across environments. Invoke Liquibase CD workflow pipeline to implement the changes. The same pipeline/workflow will work for DEV, QA and PROD as it is parameterized. Workflow will use the same SQL changelog file for all environments to ensure schema consistency across environments unless developers decide to use different SQL changelogs for different environments. Following snippet shows parameters for workflow execution. Release “tag” should be provided with proper tags. It will ensure Rollback can be done to the provided “tag”. Conclusion Database change management is critical for maintaining application integrity and enabling continuous delivery. Liquibase provides a mature and reliable framework for tracking, versioning, and applying schema changes and rollback in a production environment. By integrating Liquibase with Azure Database for PostgreSQL, Azure SQL Database, Azure SQL MI, GitHub Actions, a self-hosted runner, and Azure Key Vault, teams can establish fully automated and secure CI/CD pipelines for databases. Adopting migration-based workflows, enforcing version control, leveraging environment parity, and following best practices reduces deployment risks and supports auditing and compliance requirements. As database schemas evolve, having an auditable history and the ability to apply changes in a controlled, repeatable way empowers development teams to innovate while preserving data integrity.428Views4likes2Comments
AI features in Azure databases
A support engineer hits a fault. Somebody solved the same fault two years ago, wrote down what fixed it, and closed the ticket. The engineer searches, finds nothing, and works it out from scratch. The answer was in the database the whole time. The search could not reach it. The cost of that is not abstract. It is the same diagnosis paid for twice, a vessel or a production line down for longer than it needed to be, and an organisation that cannot tell whether a fault is new or its fifth recurrence. The knowledge was captured. The organisation still could not use it. That is a retrieval problem, not a model problem, and it is where this experiment starts. It also explains why a model alone does not fix it: the limiting factor is what the system can find, not how well it writes. Azure Database for PostgreSQL and Azure Cosmos DB have both added vector search, full text search, hybrid ranking, and the ability to call a model directly. These arrived as feature announcements. What they do under a real question, what they cost, and where each one stops being the right tool are not in the announcements. So the same 1000 records were loaded into both engines and into a graph, and every query was run live against Azure. Nothing here is a screenshot or a recorded result. Each claim is a query that executed, with its wall clock time and its request unit cost recorded. Three questions were being answered: Where does keyword search beat vector search, and where does it collapse? What changes when the database calls the model itself, rather than an application doing it? Does a graph add anything that SQL over the same table cannot already do? The third one produced the most uncomfortable answer. Background Both engines now ship the same broad capability set, at different stages of maturity. Capability PostgreSQL flexible server Cosmos DB for NoSQL Vector index DiskANN, via pg_diskann DiskANN Full text search tsvector with GIN built in, BM25 scoring Hybrid ranking written by hand RRF() as a single clause Embeddings from inside the database azure_ai extension, generally available public preview Generation from inside the database azure_ai.generate() not available Graph Apache AGE extension no The asymmetry is the interesting part. PostgreSQL gives the database its own identity and lets it call a model, which moves work out of the application entirely. Cosmos DB gives hybrid ranking as one function call and keeps latency low. Neither is a superset of the other. Method Dataset. 1000 synthetic support tickets across maritime, energy, payments and retail, generated from a fixed seed so the results reproduce exactly. Each ticket has a title, a free text description written the way a person would write it, a resolution, a fault code, an asset, a team and a severity. Two design choices decide whether the experiment says anything: The same fault is described as shuddering, juddering, trembling and knocking by different people. Without that variation there is nothing for vector search to beat keyword search at. The fault code is excluded from the embedded text. Include it and vector search half answers code lookups, which destroys the contrast being measured. Stores. Store Configuration PostgreSQL flexible server pgvector at 1536 dimensions, DiskANN, azure_ai, Apache AGE AGE graph, same server 1000 tickets, 18 assets, 12 teams, 12 codes, 3209 edges Cosmos DB for NoSQL 3072 dimension vectors, DiskANN, full text index, autoscale to 5000 RU/s Models. One Microsoft Foundry account. text-embedding-3-large for both stores, gpt-5.5 for the application, gpt-4.1-mini for generation inside PostgreSQL. Authentication. Entra ID everywhere. Password authentication disabled on PostgreSQL, local authentication disabled on Cosmos DB and Foundry. No key or connection string exists anywhere in the build. Measurement. A four page web application executes each query and reports wall clock time. A script runs every endpoint against every input and then clicks every control in a real browser. Numbers below come from that run. The setup. Note the difference in the two lines on the right: for PostgreSQL the database calls the model itself, for Cosmos DB the application does it. Results: PostgreSQL Query Time Plain English search, embedding generated in the database 1.3 s Semantic search feeding a GROUP BY 540 ms Hybrid fusion written by hand 580 ms Retrieval and generation in one statement 2.7 s The query contains no vector. azure_openai.create_embeddings() runs inside the SQL, authenticated by the server’s own managed identity. Because a similarity search returns an ordinary relation, ordinary SQL aggregates over it: which teams, how many tickets, average hours to repair. This is the operation a separate vector store cannot perform, because the join does not exist across two systems. With azure_ai.generate(), one statement embeds the question, searches, builds the prompt and calls the model. There is no application tier in the loop, so anything that can run SQL can do it: a scheduled job, a report, a trigger. The cost of that convenience is latency. Every one of these timings includes the database going out to Foundry and back on the caller’s behalf, which is why the plain English search takes over a second. The next section shows what the same questions cost when the application does that work instead. Results: the graph Apache AGE runs inside the same PostgreSQL server used above. No second database and no sync job. Three of its four edge types restate columns that already exist: which asset a ticket is on, which team fixed it, which code it carried. The fourth does not. SIMILAR_TO links each ticket to its two nearest neighbours by embedding, restricted to neighbours with a different fault code and a cosine distance under 0.40. That produced 209 edges over 1000 tickets. Same code neighbours are skipped because the existing CODED edge already connects those. Measured against a retail point of sale fault: Reached by Assets Fault code walk 5 retail stores and distribution centres SIMILAR_TO walk 4 vessels and 2 substations, none carrying that fault code The first walk is reproducible in SQL. SELECT DISTINCT asset FROM tickets WHERE error_code = ... returns the identical rows, verified one by one. The second is not, because no column connects a checkout terminal to a ship’s bridge display. Expanding from a retail point of sale fault. Grey links are the fault code, which SQL could also follow. Magenta links are the embedding-derived edge, and they reach four vessels and two substations that carry no ERR-6205 ticket at all. Note also that the graph stores no text and no vectors, so it cannot be searched by meaning, only traversed. Vector search selects the entry node and the graph decides how far to walk from there. Results: Cosmos DB The same 1000 tickets, in a document database rather than a relational one, with the application rather than the database calling the model. Query Result Time RU Keyword ERR-5012 13 tickets 130 ms 3.6 Keyword shaking 0 tickets 130 ms 3.6 Vector, paraphrased symptom the same 13 tickets, none sharing a word with the query 190 ms 7.1 Vector, given a fault code unrelated tickets, confidently ranked 420 ms 7.1 Filtered vector meaning plus metadata in one query 180 ms 8.7 Hybrid, ORDER BY RANK RRF(...) both rankings fused in the engine 380 ms 70.5 Two results stand out. The shaking query returns zero. The tickets describe that exact fault, using other words. Vector search then returns those tickets from a sentence that shares no vocabulary with them. Handed a fault code instead, vector search fails, because a code carries no meaning to embed. The two methods fail at opposite things. Hybrid search costs roughly ten times a plain vector query, 70.5 RU against 7.1. It is one clause and it works well, but it is not free and should not be the default on every request. The fusion itself is reciprocal rank fusion, which combines the two result lists by position rather than by score: score = sum over lists of 1 / (k + rank) This matters in practice, because it means the BM25 relevance score and the cosine distance never have to be made comparable. Only the ordering is used. It is also why the demo shows rank rather than the fused score: the score is an artefact of the constant k. With both sets of numbers on the table, the latency gap is the clearest difference between the two engines. Cosmos DB answers a vector query in 190 ms where PostgreSQL takes 1.3 s, roughly seven times faster, because the application has already produced the vector before the query is sent. That is the trade: PostgreSQL removes the application and pays for it in latency. Results: retrieval versus model The final test holds the model constant and varies only the retrieval. Same deployment, same prompt, same question. Each side receives whatever its search returned. Retrieval Tickets passed Answer Keyword search 0 “We have no record of this happening before.” Vector search 8 Names the causes and fixes, cites 8 ticket IDs, all verified Same deployment, same prompt, same 1000 tickets. Only the retrieval differed. The first answer is not a hallucination and not a weak model. It is accurate about what it was given, and wrong about reality, because the retrieval beneath it failed. A system that returns no results produces a confident denial rather than an error, which is why this failure mode reaches production. It is also the expensive one. A wrong answer gets challenged. “We have no record of this” gets believed, and the engineer starts again from nothing. No alert fires, no error appears in a log, and the only visible symptom is work being repeated somewhere else in the organisation months later. Constraints encountered Findings that were not documented in anything read beforehand. Cosmos DB autoscale has an irreversible floor. The maximum cannot later be set below one tenth of the highest value ever provisioned on that container. Raising throughput to 20000 briefly during a load permanently floored the container at 2000 RU/s. Data plane and control plane RBAC are independent. A subscription Owner still receives 403 when reading documents without a Cosmos data plane role. Throughput changes are control plane only. With local authentication disabled the data plane SDK cannot alter RU/s at all, regardless of identity. azure_ai.generate() sends temperature = 0.2 with no override. Newer reasoning models accept only the default and reject the request, so in database generation required a separate gpt-4.1-mini deployment. An embedding call inside ORDER BY is evaluated once per row. Over a cross join that is 1000 model calls per query. Moving it into its own CTE fixes it. The symptom presents as an unreliable network. pg_diskann is limited to 2000 dimensions. text-embedding-3-large produces 3072, so PostgreSQL indexes a 1536 dimension prefix of the same model. Apache AGE is preloaded on Azure. LOAD 'age', which most tutorials instruct, fails with a privilege error. shared_preload_libraries replaces rather than appends and changing it restarts the server. The Gremlin API does not support Entra ID on the data plane. It requires an account key and a separate account, which is incompatible with a keyless deployment. AGE inside PostgreSQL provided a graph without a second database. Role assignments take two to four minutes to propagate. During that window the error reads “Principal does not have access to API/Operation”, which is indistinguishable from a genuine misconfiguration. The /models inference endpoint requires Azure AI Developer. Cognitive Services OpenAI User grants OpenAI/* but not MaaS/*. A pooled connection survives a network change as a black hole. After the client machine changed address, the shared PostgreSQL connection remained open but unresponsive, and queries blocked indefinitely. connect_timeout, TCP keepalives and statement_timeout convert this into a recoverable error; measured recovery is 1.3 seconds. Cost Per day, in NOK, for the deployment described above: Component Cost PostgreSQL flexible server, running 83.80 Cosmos DB about 13 Storage about 1.30 The database dominates. Stopping the PostgreSQL server between sessions is the entire cost strategy. Model usage is consumption priced and negligible at this volume. Two things follow from that. The search and retrieval capability itself is nearly free, because it is a feature of a database that is already being paid for rather than a separate product with its own licence and its own operations budget. And the meter that matters is compute hours on a server that can be stopped, not tokens, which is a more predictable line item than most AI spending. Takeaways Money spent on a better model does not buy a better answer if the retrieval is weak. Both sides of the final test held the same 1000 tickets. Only the search differed, and that alone separated a correct answer from a confident denial. The search layer is where the return on an AI investment is decided, and it is usually the cheapest part of the stack to improve. The two search methods are complements, not competitors. Keyword search is exact and literal, and it is what a serial number, a part code or an invoice number needs. Vector search is approximate and semantic, and it is what a symptom described in someone’s own words needs. Each fails at what the other does well. Real questions contain both, which is the argument for hybrid rather than for choosing. Hybrid search is not free. Ten times the request units of a vector query on this dataset. That is a per-query cost multiplier at production volume, so it belongs on the queries that mix a code with a description, not on every request by default. PostgreSQL and Cosmos DB answer different questions, and the choice has consequences beyond performance. PostgreSQL keeps the semantic result inside SQL, where it can be joined, aggregated, and handed to a model without an application in between, which means a scheduled job or a report can use AI without anyone building a service first. Cosmos DB is the low latency path and gives hybrid fusion as a single clause. The first changes who in an organisation is able to deliver something. The second changes what the user waits for. Keeping operational data and vectors in one engine removes a moving part. There is no second store to provision, secure, synchronise or reconcile, and no window in which the two disagree. The experiment never had to answer the question “which copy is right”, because there was only one. A graph earns its place only through edges that are not columns. Traversing relationships that already exist as foreign keys is a GROUP BY in different syntax, and calling that a graph capability will not survive a competent question. An edge derived from embeddings is different: it reaches records that no WHERE clause can, and in this dataset it connected failures across four separate parts of the business that shared no code, no component and no domain. Keyless is achievable end to end. Entra ID across both databases and the model account, with the database calling the model as its own managed identity, removed every key, password and connection string from the system. Nothing can leak from a repository or a configuration file, because nothing is there. The cost is understanding that data plane roles are assigned separately from control plane roles. Silent failures dominate, and they are the ones that reach production. Every significant defect in this build produced no error: counts inflated by a cartesian product, unresolved tickets averaged as zero hour repairs, near duplicate generated text, a stale process serving old code, and a connection that had stopped responding. Nothing alerted. Assertions over the data and a scripted pass over every endpoint caught all of them, and both took under a day to write. On a system that answers questions rather than returning rows, that kind of check is not optional, because a wrong answer looks exactly like a right one. Where this goes next: Azure HorizonDB Nothing in this experiment used Azure HorizonDB, but it changes the shape of the argument, so it belongs here. The pattern behind the scaling question is familiar: teams want to stay on PostgreSQL and eventually hit a ceiling. HorizonDB is Microsoft’s own PostgreSQL, built for workloads past that point, and it is in public preview. It carries the same AI surface used above, pgvector, DiskANN indexing, hybrid search with reciprocal rank fusion, and the azure_ai extension, so the code in this experiment transfers rather than being rewritten. What it adds is AI pipelines. Chunking, embedding, extraction, generation and ranking are declared in SQL as a pipeline that runs inside the database, on top of durable execution. The definition is a row in a system catalog. Execution survives a crash, retries failed steps, checkpoints partial work, and re-embeds only rows that are new or changed. That closes the remaining gap. This experiment showed a database answering a question. A pipeline is the same idea applied to keeping the data ready to be asked: no orchestrator, no separate worker, no job that quietly stops running. Both are preview features and should be read as direction rather than as something to put in front of customers this quarter. Not tested Scope was limited to what the two databases do on their own. Three things were left out deliberately and would change the conclusions if included. Agentic retrieval. Query planning, sub queries, iterative retrieval and reflection over multiple knowledge sources, as offered by Azure AI Search and Foundry IQ. That is a retrieval strategy built above the database, and it would have made the single query comparison meaningless. Reranking. A semantic reranking model over the candidate set. PostgreSQL exposes azure_ai.rank() for this and it was verified as working, but nothing in the experiment used it. Scale. 1000 rows is enough to show behaviour and not enough to show performance. The query planner in particular behaves differently: at this size it correctly ignores the vector index, because a sequential scan over a thousand rows is cheaper than the index startup cost. Try it yourself Everything described here is published, including the Terraform for the Azure resources and the generator for the dataset. https://github.com/Hanifff/ai-features-in-azure-databases git clone https://github.com/Hanifff/ai-features-in-azure-databases.git cd ai-features-in-azure-databases az login ./scripts/setup.sh That reads your current Azure context, provisions the resources, loads all three stores, and starts the application. The dataset is generated from a fixed seed, so the counts quoted in this post reproduce exactly. The PostgreSQL server is the only meaningful cost. Stop it when you are not using it, and run terraform -chdir=infra/terraform destroy to remove everything.322Views1like0CommentsPostGIS and AI Retrieval in Azure HorizonDB
Fleet operators rarely search with a single kind of question. Sometimes they know exactly what they want: delayed shipments, within a certain radius of a location, arriving in a given window. Other times they only have intent, phrased in a sentence: "which delayed shipments need attention?" The first case is a deterministic filter. The second is a semantic search that a language model can shape into a query. Both need to run against the same operational data, return the same kind of exact rows, and stay inspectable enough that an operator can trust the result. The usual answer is to split that data: keep the transactional and, maybe, spatial rows in one system and copy embeddings into a separate vector store, with a search service in front. That works, but it duplicates the data, adds a synchronization problem, and hides the retrieval behind an API that no longer shows how a result was reached. The goal here is to keep both kinds of question against one database. I built a sample application, HorizonDB Fleet Intelligence, that answers them two ways: a criteria search form on the left, and a prompt-only assistant on the right. Its 24 global shipments are a deliberately small, hand-authored demo fixture, not a scale benchmark. Keeping the dataset small makes every returned row and planner choice easy to inspect. Both paths call the same repository, use PostGIS for location and pgvector for meaning, and expose the exact SQL and execution plan that produced their rows. This post walks through the goal, the two paths, and the queries and execution plans behind each. The interesting part is not that PostgreSQL can call an AI model. It is that the whole retrieval workflow, spatial filtering, vector ranking, and model reasoning, stays next to the data and remains readable. This sample demonstrates: One operational PostgreSQL database PostGIS for spatial filtering pgvector and DiskANN for semantic retrieval Agent Framework for prompt-driven search Full SQL and execution-plan visibility I ran this on Azure HorizonDB (preview), PostgreSQL 17.11, with postgis 3.6.1, vector 0.8.0, pg_diskann 0.7.3, and azure_ai 2.2.2 enabled. Both model aliases were registered with HorizonDB AI Model Management (AIMM). HorizonDB is a preview service, so region and subscription availability can change, and the plans and numbers below reflect what I ran rather than a support statement. The data model Each shipment is one row that carries relational fields, three PostGIS points, a JSON metadata blob, and a 1,536-dimensional embedding. The location columns are geometry(Point, 4326) , the standard WGS 84 longitude/latitude reference used by web maps. CREATE TABLE IF NOT EXISTS horizon_ship.shipments ( id uuid PRIMARY KEY DEFAULT pg_catalog.gen_random_uuid(), shipment_number text NOT NULL UNIQUE, title text NOT NULL, description text NOT NULL, origin_name text NOT NULL, origin_position public.geometry(Point, 4326) NOT NULL, destination_name text NOT NULL, destination_position public.geometry(Point, 4326) NOT NULL, current_location_name text NOT NULL, current_position public.geometry(Point, 4326) NOT NULL, status text NOT NULL CHECK ( status IN ('in_transit', 'delivered', 'delayed', 'exception', 'unknown') ), eta date, updated_at timestamptz NOT NULL DEFAULT now(), embedding vector(1536), metadata jsonb NOT NULL DEFAULT '{}'::jsonb ); The indexes give the planner several selective alternatives, which matters later because the two paths deliberately let the planner choose differently. There is a B-tree on status , a B-tree on eta , a GiST index on the geometry, and a second GiST index on the geography cast used by radius search: CREATE INDEX shipments_current_position_gix ON horizon_ship.shipments USING gist (current_position); CREATE INDEX shipments_current_position_geography_gix ON horizon_ship.shipments USING gist ((current_position::public.geography)); CREATE INDEX shipments_status_idx ON horizon_ship.shipments (status); CREATE INDEX shipments_eta_idx ON horizon_ship.shipments (eta); The vector index combines DiskANN with HorizonDB's spherical quantization (SQ) preview. DiskANN navigates a nearest-neighbor graph instead of scanning every vector. SQ compresses vector directions into low-bit representations, reducing the index footprint and memory traffic during graph traversal at the cost of an approximate comparison. Here each component uses four bits, shown as SQ4 in the interface, and sq_training_samples is configured at 25,000. Cosine distance matches the embedding model. CREATE INDEX shipments_embedding_diskann_idx ON horizon_ship.shipments USING diskann (embedding vector_cosine_ops) WITH ( spherical_quantized = true, sq_bits = 4, sq_training_samples = 25000 ); AI Model Management and azure_ai Both aliases are registered with HorizonDB AI Model Management (AIMM). The default-embedding alias resolves to text-embedding-3-small with 1,536 dimensions, and default-chat resolves to gpt-5.4 . Using aliases keeps the SQL and application code independent of the underlying model deployment details. The azure_ai extension provides the in-database model integration used by both paths: CREATE EXTENSION IF NOT EXISTS azure_ai CASCADE; Setup calls azure_openai.create_embeddings to create each row's embedding inside the database. The prompt-only agent later calls azure_ai.generate through its Agent Framework adapter. The embedding input uses format() with field labels, giving the model the business role of each value instead of an unlabeled sequence of words: UPDATE horizon_ship.shipments AS shipment SET embedding = azure_openai.create_embeddings( 'default-embedding', format( 'Title: %s. Description: %s. Origin: %s. Destination: %s. ' 'Current location: %s. Status: %s. Metadata: %s.', shipment.title, shipment.description, shipment.origin_name, shipment.destination_name, shipment.current_location_name, shipment.status, shipment.metadata::text ) )::vector(1536) WHERE ...; The application does not move embeddings between services, and no separate vector store is involved. Two paths, one repository The interface shown above has three panes: a criteria workbench on the left, a shared map in the center, and a prompt-only assistant on the right: Criteria workbench (left) Explicit status, ETA, and radius filters Calls POST /api/search This is a deterministic form, not a chat Agent assistant (right) Natural-language question only Calls POST /api/chat Agent Framework lets gpt-5.4 infer tool arguments The important design decision is that both paths call the same repository method, semantic_search . The criteria path fills in the filters from the form. The agent path fills them in from what the model inferred. Nothing from the left form leaks into the agent request, and the agent request contract enforces that: the /api/chat model forbids extra fields, so posting status or radius to it returns HTTP 422 before Agent Framework even runs. Here is the shared query, exactly as the repository builds it. The %s placeholders are bound with parameters. The criteria path supplies real values, while the agent path passes NULL for the filters it did not infer. -- 1. Embed the query text in the database, using the same model -- (default-embedding) that produced the row embeddings. WITH query_vector AS ( SELECT azure_openai.create_embeddings( %s, -- embedding model alias %s -- query text )::vector(1536) AS embedding ), -- 2. Retrieve candidates. MATERIALIZED forces this CTE to run once and -- be reused, so the vector distance is computed a single time. candidates AS MATERIALIZED ( SELECT s.shipment_number, s.title, -- ... projected columns, PostGIS points unpacked with ST_X / ST_Y ... -- 2a. Cosine distance between the row and the query embedding. s.embedding <=> query_vector.embedding AS vector_distance, -- 2b. Great-circle distance in km to the map center, only when a -- center was supplied (otherwise NULL). CASE WHEN %s::double precision IS NULL THEN NULL ELSE public.ST_Distance( s.current_position::public.geography, public.ST_SetSRID( public.ST_MakePoint(%s, %s), 4326 )::public.geography ) / 1000.0 END AS distance_km FROM horizon_ship.shipments AS s CROSS JOIN query_vector -- 2c. Optional filters. Each is "parameter IS NULL OR <condition>", -- so an unused filter drops out and the planner can ignore it -- (the application sets plan_cache_mode to force_custom_plan). WHERE (%s::text IS NULL OR s.status = %s) -- status AND ( -- ETA window %s::date IS NULL OR s.eta BETWEEN %s::date - (%s * INTERVAL '1 day') AND %s::date + (%s * INTERVAL '1 day') ) AND ( -- PostGIS radius %s::double precision IS NULL OR public.ST_DWithin( s.current_position::public.geography, public.ST_SetSRID( public.ST_MakePoint(%s, %s), 4326 )::public.geography, %s * 1000.0 ) ) -- 2d. Order by cosine distance and cap the list. This is the step -- DiskANN serves: nearest neighbors first, then LIMIT. ORDER BY s.embedding <=> query_vector.embedding LIMIT %s ) -- 3. Score and rank. Pure cosine similarity when there is no radius, -- otherwise a 72% semantic / 28% spatial blend. SELECT candidates.*, 1 - vector_distance AS similarity, CASE WHEN distance_km IS NULL THEN 1 - vector_distance ELSE 0.72 * (1 - vector_distance) + 0.28 * GREATEST(0, 1 - distance_km / %s) END AS hybrid_score FROM candidates ORDER BY hybrid_score DESC LIMIT %s; </condition> A few things are worth pointing out. The query embedding is created inside HorizonDB with azure_openai.create_embeddings , so the same model that embedded the rows also embeds the query, on the same connection. Each optional predicate is written as %s IS NULL OR , so an unused filter disappears from the effective query and the planner is free to ignore it. The inner ORDER BY ... <=> ... LIMIT keeps cosine distance as the candidate-retrieval step, which is what lets DiskANN serve it. The outer query then produces a hybrid score: pure cosine similarity when there is no radius, and a 72% semantic / 28% spatial blend when a radius is present. Why 72% semantic and 28% spatial The split is a tunable product choice, not a mathematical constant. Both terms are normalized from 0 to 1. Because ST_DWithin already removes rows outside the radius, semantic relevance leads among the eligible shipments and the 28% spatial term rewards proximity. Without a radius, the score is pure cosine similarity. Because the two paths share this query, the only thing that changes between them is which parameters are NULL . That is what makes the execution plans interesting: the same SQL shape produces two very different plans depending on how selective the filters are. Path one: criteria search For the first search I ask for cold-chain medicine for clinics, select the exception status, center the map near Dakar in West Africa, and choose a 3,000-kilometer radius. This is a highly selective request. In the sample data it returns exactly one row: SHIP-0007, Cold-Chain Vaccines. The cosine similarity is 0.56 and the hybrid score is 0.69. No model reasoning is needed to interpret those explicit filters. The application does not force an index. Every runtime SELECT is first run through EXPLAIN (ANALYZE, BUFFERS, WAL, FORMAT TEXT) , and the plan is retained alongside the literalized SQL. For this selective request, the planner does not touch the vector index at all. It combines the status B-tree and the PostGIS geography GiST index with a BitmapAnd , feeds one row into a Bitmap Heap Scan, and rechecks ST_DWithin there: -> Bitmap Heap Scan on shipments s (actual time=21.684..21.687 rows=1 loops=1) Recheck Cond: (status = 'exception'::text) Filter: st_dwithin((current_position)::geography, '...'::geography, '3000000'::double precision, true) Heap Blocks: exact=1 -> BitmapAnd (actual time=0.020..0.020 rows=0 loops=1) -> Bitmap Index Scan on shipments_status_idx (actual time=0.007..0.007 rows=2 loops=1) Index Cond: (status = 'exception'::text) -> Bitmap Index Scan on shipments_current_position_geography_gix (actual time=0.012..0.012 rows=3 loops=1) Index Cond: ((current_position)::geography && _st_expand('...'::geography, '3000000'::double precision)) This is the right call. The status B-tree returns two candidate rows, the geography GiST index returns three, and the BitmapAnd intersects them. The ST_DWithin recheck on the heap confirms the single match. Resolving that with relational and spatial selectivity is far cheaper than an approximate nearest-neighbor scan, and the whole query ran in about 22 ms. The vector distance is still computed in the outer query to produce the similarity and hybrid score, but it is not driving the access path. The SQL pane shows every literal, prompt, status, coordinates, and radius, so the operator can see exactly what was asked and how it was answered. Note that the GiST index scan uses the && bounding-box operator against _st_expand(...) , which is the index-friendly part of ST_DWithin . The exact distance test is then applied as the recheck, so the spatial predicate is both index-accelerated and exact. The application shows the same thing as a graph, with the literal SQL beside it. The BitmapAnd and its two bitmap index scans are visible as one flow, and the SQL pane highlights each user-supplied literal: Path two: the prompt-only agent For the second search I clear the left criteria and just ask the assistant: "Which delayed shipments need attention?" The request body contains only that question. Behind that, Microsoft Agent Framework runs a bounded two-turn loop while model inference stays inside HorizonDB. On the first turn, gpt-5.4 is asked, through azure_ai.generate , to return JSON arguments for a single registered tool, search_shipments . The model chooses delayed as the status and rewrites the intent to something like "shipments needing attention". Agent Framework validates those arguments and invokes the tool exactly once. That tool calls the same semantic_search method, with the model-chosen status and no spatial or ETA filter. On the second turn, the model receives only the serialized result rows and writes the grounded answer. The client caps the run at two model iterations and one function call, so the orchestration stays predictable. The tool is a plain typed function. The framework reads its schema from the annotations: @tool( name="search_shipments", description=( "Search live shipments by meaning and optional status. HorizonDB retrieves " "candidates with spherical-quantized DiskANN and returns ranked evidence." ), max_invocations=1, ) async def search_shipments(query_text: str, status_filter: StatusArgument = "all") -> str: ... This time the filter is not selective enough to win as a bitmap, so the planner takes the vector path. Before running a filtered vector query, the repository enables DiskANN's strict iterative search and filter hook in a transaction-local scope: SET LOCAL diskann.iterative_search TO 'strict_order'; SET LOCAL diskann.enable_filter_hook TO 'true'; SET LOCAL diskann.selectivity_min TO '0.0'; SET LOCAL diskann.selectivity_threshold TO '1.0'; SET LOCAL diskann.filtering_beta TO 0.85; SET LOCAL diskann.l_value_is TO 300; The plan is now a custom DiskANN scan. Strict iterative search applies the delayed filter and then vector ordering, collecting exactly the tuples that match: -> Custom Scan (DiskANNFilteredScan) (actual time=0.942..0.967 rows=3 loops=1) Strategy: Filter(SeqScan) -> Vector Rows Retrieved: 3 count TIDs Collected: 3 count The strategy line reads Filter(SeqScan) -> Vector : the delayed filter is applied first, then the vector index orders the survivors. It collected three tuple identifiers and retrieved three rows, and the whole statement ran in about 1.2 ms. Those three rows, Electric Vehicles, Apparel and Textiles, and Lithium Batteries, are the same rows that appear as cards in the answer, in the left-hand list, and on the map. The query pane exposes the model-selected semantic phrase and the cosine operator, so the vector path is as inspectable as the relational one. Filtered vector search is exactly what a separate vector store tends to hide. Here it stays in the plan. The plan graph makes the strategy explicit. The Query + plan button on the agent turn opens the exact SQL the model produced, "shipments needing attention" highlighted, next to the DiskANNFilteredScan node with its strategy and TID count: Both plans come from the identical query. The criteria request was selective, so the planner chose BitmapAnd over the status B-tree and geography GiST. The agent request was broad, so the planner chose DiskANNFilteredScan and let the vector index order the candidates. That is the payoff of keeping one query and one dataset: the planner adapts to the shape of each question instead of the application hard-coding an access path. The two plans do the same thing under the hood These two access paths look different in the plan, but they are solving the same problem the same way: reduce the table to the set of rows that satisfy the predicates, expressed as tuple identifiers (TIDs), the physical (block, offset) addresses of rows. In the criteria plan, each index produces a bitmap of TIDs. The status B-tree contributes the TIDs of exception rows, the geography GiST index contributes the TIDs whose bounding box intersects the radius, and BitmapAnd intersects the two bitmaps into the TIDs that satisfy both. The heap is then visited for exactly those TIDs and the exact ST_DWithin is rechecked. The predicates are resolved first, then the rows are fetched. The DiskANN filtered scan does the equivalent, but in the opposite order and against a graph. Rather than ordering by distance and hoping the top results happen to be delayed , strict iterative search evaluates the filter during graph navigation: as it walks the nearest-neighbor graph it keeps only the TIDs that pass the delayed predicate, and keeps walking until it has collected enough matches in nearest-first order. That is what Filter(SeqScan) -> Vector and TIDs Collected: 3 describe, the filter builds the set of eligible TIDs, and the vector index visits them in similarity order. So a bitmap index scan and a pre-filtered ANN search are two implementations of one idea: build the set of TIDs that match the predicates, then combine it, by bitmap intersection in one case, by filtering the candidates during navigation in the other. This is exactly the capability a separate vector store usually lacks. A pure HNSW index, for instance, orders by distance with no way to intersect a relational predicate into the walk, so it either over-fetches and filters afterward or misses matches. Keeping the vectors in the same table as the relational and spatial columns is what lets one predicate feed the other. A note on inspectability Every runtime SELECT in this sample is executed twice on purpose. The backend first runs it under EXPLAIN (ANALYZE, BUFFERS, WAL, FORMAT TEXT) to capture the real plan with buffer and WAL statistics, then runs the same statement to fetch rows. That is a demonstration choice, not something you would do in production, but it means every result carries the literal SQL and the plan that produced it. Each agent answer keeps its own plan snapshot too, so the Query + plan control still shows that turn's SQL and plan even after a later criteria search runs. Because EXPLAIN ANALYZE runs the statement, the model-backed statements run twice as well. Takeaways This started as a practical customer question: show PostGIS on HorizonDB, then combine location with AI in something that looks like a real development stack. The result is one operational database with two trustworthy ways to ask. When the operator knows the criteria, the left workflow keeps status, time, and geography deterministic, and the planner resolves it with B-tree and GiST bitmaps. When the intent is conversational, gpt-5.4 gets one controlled Agent Framework tool over the same repository, and the planner serves it from spherical-quantized DiskANN. In both cases the rows, scores, SQL literals, and planner decisions stay visible. Relational data, PostGIS geometry, pgvector embeddings, and AI model calls all live in the same HorizonDB instance, so there is no second store to synchronize and no retrieval hidden behind an opaque service. The pattern starts with shipment tracking but transfers directly to fleet, taxi, bus, and security dispatch, anywhere service intent and proximity matter together. If you want to try HorizonDB capabilities like these, the PostgreSQL Hub has sample applications and learning paths, and the PostgreSQL Developer Forum is the best place to share feedback and ask questions.225Views1like0Comments