developer
3139 Topics
SPFx Web Part Not Visible for External User in Client Tenant
Hi everyone, One of our team members has developed an SPFx web part that we have deployed and published in our client's SharePoint tenant using a service account. The web part is working as expected when we access the client tenant using the service account. However, when I access the same client tenant using my external/guest user account, I cannot see or use the SPFx web part. Current setup: The SPFx web part was developed by one of our team members. The solution has been deployed and published in the client's SharePoint tenant using a service account. The service account can see and use the web part successfully. My account has also been added to the client tenant as an external/guest user. However, when I access the same SharePoint site using my external account, the SPFx web part is not visible/available. I would like to understand whether this is expected behavior for SPFx web parts when accessed by external/guest users, or if we are missing some configuration. Could this be related to SharePoint permissions, Entra ID guest-user settings, the App Catalog, API permissions, or the SPFx solution deployment configuration? Are there any specific permissions or tenant-level settings that we should check to allow external users to access the SPFx web part? Is there any Microsoft-side restriction that prevents external/guest users from accessing SPFx web parts? Any guidance on what could be causing this issue and how we can troubleshoot or resolve it would be greatly appreciated. Thanks in advance!56Views0likes0Comments
SharePoint List Web Part - major caching issues
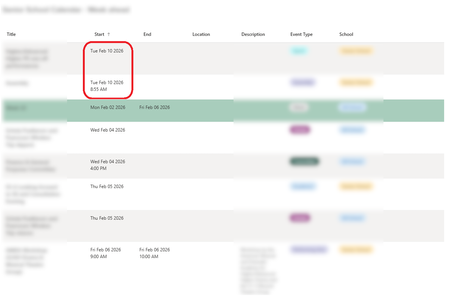
Hi All, I've spent a lot of time building a List based company calendar in our SharePoint Intranet Portal, and the calendar itself is working great, however I'm having no end of headaches with the List Web Part. (not just for this calendar, but all list web parts for that matter) The calendar has a Start and End field - both are Date and Time fields. A custom view is created for use with the List Web Part to embed an "upcoming week" view, this is based on a filter which checks both Start and End dates to see whether an event exists within or spans the date range from today to 7 days in the future, so it is a rolling 7 day window. This is based on a number of filter criteria which include [Today] and [Today]+6. The view also has a sort criteria to sort based on the Start (Date/Time) field. This all works fine when previewing the view within the list itself - at midnight the results update to include events from the day that is now 7 days in the future which were previously excluded. So the view itself is working fine. However the same view in a List Web part on another page suffers from a ridiculous amount of browser side (?) caching, to the point that it is basically broken and unusable. When I open the page the next day in a browser (even if the browser was closed) one of three things happens, somewhat at random: The events 7 days in the future (which just came into filter scope today) just don't appear until a forced page reload is done. The events 7 days in the future do appear but they are sorted incorrectly, appearing at the TOP when the date sort order should show them at the BOTTOM. Sometimes 2 happens but the event is shown with the Start and End Date/Time fields empty - so not only is it at the wrong end of the list it doesn't even show a date at all until the page is refreshed. Here is a picture showing the sort order being incorrect as in case 2: When these various problems happen a full CTRL-F5 browser refresh always updates the list to be complete, up to date and sorted correctly, however, if after that you click away from the page and follow a link to return to it OR press a regular F5 refresh it goes back to being incorrect! It takes many page reloads or a lot of time to pass (hours) before it finally settles down and gives the correct results every time. Then the next day the same caching problems happen again. If you go to a new browser or PC the same problems happen again, suggesting this is browser side caching not something at the servers. While the actual content of the list items update in real-time if you edit the list content in another page (which is pretty cool) the "result set" of list items (which items should or should not be seen) is heavily cached, and the sorting is unreliable. Has anyone else found a solution to this ? I have already done things like disabling offline mode for the list, (this only seems to affect caching of the actual data in the list items, not caching of filter results) etc and I cannot find a solution. The only thing I know which would probably work, as I have had to use this approach on another list is to extend the date range of the filter criteria for the view further into the future, then filter out the extra days using json code in "format view - however AFAIK you can only selectively hide rows like this if you use a custom rowFormatter, which means you have to fully re-implement the standard view including hard coding all the columns you want and it still won't look quite the same. This is a lot of work and maintenance overhead in the future to work around a caching problem that shouldn't exist in the first place. Any thoughts appreciated as a lot of time and effort has gone into building an entire calendar system around a SharePoint List, only to find that the list web part just doesn't work properly.734Views0likes2Comments
SharePoint Online – BLANKINTERNET#0 Publishing Portal and Modern Pages
Hi everyone, I’m trying to understand the recommended approach for an existing SharePoint Online site based on the BLANKINTERNET#0 template (Publishing Site / Publishing Portal). The site is still based on the classic SharePoint architecture and currently uses: a custom Master Page; Publishing Pages; custom Web Parts developed with SharePoint Framework (SPFx); the SPFx Web Parts also communicate with a backend/API developed using .NET Framework 4.8. I’ve read Microsoft’s recent announcement regarding the deprecation of classic publishing sites and classic user-created pages. As I understand it: starting March 1, 2027, the creation of new classic publishing sites and activation of the classic publishing features will be disabled; starting October 1, 2028, existing classic user-created pages, including Publishing Pages, will become read-only; existing pages will not be deleted, but users will no longer be able to create or edit them; Microsoft recommends assessing and gradually modernizing classic content to modern SharePoint experiences. However, I’m confused about the recommended modernization path for an existing Publishing Portal. The deprecation announcement made me think that one possible approach would be to progressively replace the existing classic pages with Modern Pages. However, in Microsoft’s documentation about modernizing classic publishing portals, I found the following statement: "For publishing portals (sites based upon BLANKINTERNET#0, ENTERWIKI#0, SRCHCEN#0, SRCHCENTERLITE#0, BICENTERSITE#0, POINTPUBLISHINGHUB#0, POINTPUBLISHINGTOPIC#0 or sites using the “Pages” library) it's not currently supported to connect these to a Microsoft 365 group or to use modern pages. If you want to modernize your publishing portal it's recommended to start from a new communication site and configure that one accordingly." This raises an important question for my scenario. My question For an existing BLANKINTERNET#0 Publishing Portal, is it currently supported to: A) Keep the existing Publishing Portal and progressively create/use Modern Pages within the same site, migrating the content from the existing classic Publishing Pages to Modern Pages so that the content remains editable after 2028? Or: B) Are Modern Pages actually not supported in an existing BLANKINTERNET#0 Publishing Portal, meaning that the supported modernization path is to create a new Communication Site and migrate/configure the content there? I would particularly like to understand what Microsoft currently considers the officially supported approach. In other words: For an existing BLANKINTERNET#0 Publishing Portal, can I progressively replace the classic Publishing Pages with Modern Pages within the same site, or do I need to create a new Communication Site and migrate the content there in order to move away from the classic Publishing architecture? I would like to avoid a full migration to a new Communication Site if it is not necessary, but at the same time I want to make sure that I’m not implementing an approach that Microsoft considers unsupported. Thanks in advance for any clarification!260Views0likes1CommentPublisher ExportAsFixedFormat ignores “Publication Page” while manual PDF/XPS export works
I am migrating a large archive of Microsoft Publisher files to PDF before Publisher is retired. We have isolated a repeatable problem in older publications. Example publication: Publisher page size: 210 x 148 mm, landscape • Manual export through File → Export → Create PDF/XPS → Options → Print Options • Settings shown by Publisher: • One page per sheet • Paper size: Publication Page • 210 x 148 mm • Landscape • Resulting PDF: 210 x 148 mm — correct However, both PowerShell/COM and VBA using Document.ExportAsFixedFormat produce a 215.9 x 279.4 mm portrait PDF. Explicitly using: PrintStyle:=pbPrintStyleOnePagePerSheet does not fix the problem. We tested the same publication using: Application.CommandBars.ExecuteMso "FileSaveAsPdfOrXps" This opens Publisher’s own PDF/XPS dialog. The dialog still shows Publication Page, 210 x 148 mm, landscape, and when published through that UI the resulting PDF is correct. We analysed 349 Publisher files: •120 exported with the correct page size • 229 exported with the wrong page size • all 229 failing files opened with an Adobe PDF / A4 portrait printer context The Publisher PageSetup.PageWidth and PageHeight values themselves remain correct. Question: Is there any documented or undocumented Publisher VBA/COM property, parameter, registry setting, or command that corresponds specifically to the PDF/XPS Print Options setting “Paper size: Publication Page”? In other words, how can ExportAsFixedFormat be made to reproduce exactly the same page-size behaviour as Publisher’s interactive PDF/XPS dialog? If this is not exposed through the Publisher object model, is automating the built-in FileSaveAsPdfOrXps command the only reliable approach? Publisher: Microsoft 365 desktop version on Windows.173Views0likes0Comments
Join Microsoft and M-Files on Sept 23: Content readiness for AI and Agents webinar
What does it take to get your content ready for Microsoft Copilot and Agentic AI? Join M-Files and Microsoft for the “https://aka.ms/SPEmbedded/Webinar/M-Files-20260923” webinar on September 23, 2pm ET, to find out. Ian Story, Principal Product Manager, Microsoft, will be presenting with Cheryl McKinnon (Principal Analyst, Forrester) and Ryan Barry (Vice President of Strategic Operations & Corporate Development, M-Files). Together they'll explore what it takes to make enterprise content ready for the next generation of AI-powered applications and agents. https://aka.ms/SPEmbedded/Webinar/M-Files-20260923 In this webinar, you’ll hear practical perspectives on how to: Assess content readiness: Identify the quality, governance, access, and discoverability gaps that can limit Copilot and agent outcomes. Build a trusted knowledge foundation: Keep content secure, compliant, and permission-aware while making it easier for AI to retrieve the right information. Reduce fragmentation: Bring content and context together so users and agents can work with higher precision. Prepare for agentic workflows: Move beyond static document storage toward intelligent, adaptive content experiences that support reasoning and action. See you there!134Views0likes0CommentsSharepoint view level permissions
Hello, I’m facing an issue in SharePoint. I have a main list where I need to create two views one for “A” users and another for “B” users. What should change is, for example, that “A” users can only see column “A” and “B” users can only see column “B”. And being sensitive data, they shouldn't be able see each other's columns. Using different lists is the only viable way I currently see this working, which i don't really want since this requires a lot more of work, unless someone can suggest a better solution. Note that currently I'm using two different pages inside the same website for user's "A" and "B". Thank you very much.1KViews1like2Comments
Invoke-PnPSiteTemplate slower than it used to be
Hi everyone, Since last Friday, our provisioning engine has become noticeably slower than usual, and it's now blocking site creation for one of our customers. Setup Azure Function App (Windows OS, Consumption plan, hard 10-min timeout) Provisioning engine applies a PnP site template to newly created SharePoint sites via Invoke-PnPSiteTemplate PnP PowerShell: 2.12.0 PowerShell: 7.6 What changed Previously, if a run went over the 10-min limit, it wasn't a real problem: our retry mechanism kicked in, and the second pass was much faster because a large part of the template had already been provisioned. Now, however, every run stays slow and consistently hits the 10-min timeout, so the retry never gets far enough to complete. The result is that the customer's sites are no longer being created. My question Has anyone else seen this same slowdown since last Friday? Could this be related to the recent CSOM issue with Invoke-PnPSiteTemplate / Set-PnPDefaultColumnValues? (Invoke-PnPSiteTemplate AND Set-PnPDefaultColumnValues error since this morning | Microsoft Community Hub) Any confirmation or workarounds would be greatly appreciated. Thanks!210Views0likes1Commentpnp-modern-search does not work in the local SharePoint workbench
Version used 4.9.0 (SPFx 1.15.0) Describe the bug The solution works correctly when deployed using the .sppkg package in SharePoint Online, but it does not work in the local SharePoint workbench. There are two related issues: When running gulp serve, the build/runtime reports an error related to BANNEDUSERNAME/sp-webpart-workbench/lib/api/, suggesting a failure in loading or resolving the local workbench API module. When adding the web part to the local workbench page, the web part fails to render with the following error: Error: Cannot find module './15.js' The second error appears to be related to a missing or incorrectly resolved chunk/module during bundle loading. The issue only occurs in the local workbench. The deployed .sppkg solution in SharePoint Online works correctly. Node.js version: 16.8.0 (compatible with SPFx 1.15.0). Dependencies installed via npm install without errors. To Reproduce Clone the repository Run npm install Run gulp serve Open the local SharePoint workbench Add the web part to the page Observe: Error during gulp serve related to BANNEDUSERNAME/sp-webpart-workbench/lib/api/ Web part fails to load with Cannot find module './15.js' Expected behavior The web part should load and render correctly in the local workbench without module resolution errors. Desktop : Browser: Chrome Node.js: 16.8.0 SPFx: 1.15.0209Views0likes2Comments
Invoke-PnPSiteTemplate AND Set-PnPDefaultColumnValues error since this morning
Since this morning we experience a blocking issue with Invoke-PnPSiteTemplate cmdlet which is failing as soon as there are lists included in a pnp site template (which is pretty much every template in our case). We see this behaviour on all of our own tenants and all customer tenants. This is a very important part of our provioning engine so it's blocking all new sites & teams in all tenants. Context We have a provisioning engine that runs in Azure. It automatically creates SharePoint-sites and applies a configured PnP site template (either .pnp or .xml) Expected behavior Normally, the template gets applied correctly without any error Actual behavior An error occurs in our logging, also visible when reproducing this locally: Error applying default column values Microsoft.SharePoint.Client.ServerException: Exception of type 'Microsoft.SharePoint.Client.ServiceUnavailableException' was thrown. Microsoft.SharePoint.Client.ClientRequest.ProcessResponseStream(Stream responseStream) StackTrace: at Microsoft.SharePoint.Client.ListExtensions.SetDefaultColumnValuesImplementation(List list, IEnumerable1 columnValues) at Microsoft.SharePoint.Client.ListExtensions.SetDefaultColumnValues(List list, IEnumerable1 columnValues, Boolean overwriteExistingDefaultColumnValues) at PnP.Framework.Provisioning.ObjectHandlers.ObjectListInstance.ProvisionObjects(Web web, ProvisioningTemplate template, TokenParser parser, ProvisioningTemplateApplyingInformation applyingInformation) at PnP.Framework.Provisioning.ObjectHandlers.SiteToTemplateConversion.ApplyRemoteTemplate(Web web, ProvisioningTemplate template, ProvisioningTemplateApplyingInformation provisioningInfo, Boolean calledFromHierarchy, TokenParser tokenParser) at CallSite.Target(Closure , CallSite , Object , Object , Object , Object ) Steps to reproduce behavior Create a PnP template Apply the template, using invoke-pnpsitetemplate -Path "..." We also see the same error happening when executing this cmdlet: Set-PnPDefaultColumnValues -List "Documents" -Field Status -Value "MyDefaultValue" -Connection $pnpConnTargetSite So it seems related... anyone getting the same issues?805Views6likes10Comments