azure sql
69 TopicsSeconds of Downtime, Hours of Confusion: Handling Transient Azure SQL Disconnects
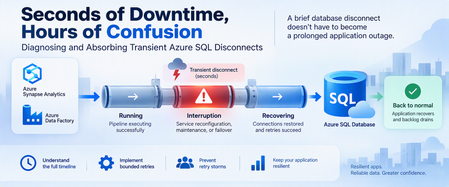
A database can recover in seconds while an application remains unavailable for much longer. Brief connectivity interruptions are expected failure modes that cloud applications should be designed to tolerate. With Azure SQL Database, transient connectivity errors can occur during short-lived service reconfiguration events. Microsoft notes that many such reconfiguration events complete in less than 60 seconds and recommends that applications implement retry logic rather than immediately surfacing transient failures to users. But the database interruption is only part of the story. An application might continue experiencing problems because of: Failed connections. Lost in-flight operations. Retry behavior. Connection-pool recovery. Authentication or token issues. Queued requests. Application instances retrying simultaneously. Backlogs that must drain after connectivity returns. This leads to an important troubleshooting principle: Database recovery and application recovery are separate milestones. Understanding that difference can turn a confusing availability incident into a defensible timeline and, more importantly, a more resilient application design. 1. Transient Does Not Mean Harmless A transient interruption is temporary, but its application impact doesn't have to be. Consider a simplified timeline: Time Event T0 Application healthy T1 Database connectivity is interrupted T2 Database connectivity becomes available again T3 Applications reconnect T4 Request backlog begins draining T5 Application returns to normal The actual database connectivity event is: T1 → T2 But users might experience impact across: T1 → T5 Calling the entire T1-to-T5 period a continuous database outage would be inaccurate unless evidence proves that the database itself remained unavailable. Instead, investigate the periods separately. 2. Build a Three-Layer Timeline A good post-incident investigation should correlate three timelines. Layer 1: Database/connectivity behavior Capture: Connection failures. Successful reconnections. Relevant Azure monitoring signals. Azure Service Health information when applicable. Database resource behavior. Layer 2: Client connectivity Capture: SQL exception number. Exception timestamp in UTC. Connection timeout. Retry attempts. Retry delays. Authentication failures. Network errors. Azure SQL troubleshooting guidance recommends logging failure timestamps and notes that SQL Database can return tracing information helpful during connectivity investigations. Layer 3: Application recovery Capture: Application health. Request failures. Queue depth. Retry volume. Connection-pool recovery. Backlog drain time. Time when users actually recovered. The timelines might reveal: Database connectivity restored │ ▼ Applications reconnect │ ▼ Backlog continues │ ▼ Application fully recovered That distinction is essential. 3. Classify the Failure Before Retrying It Not every SQL connectivity error means the same thing. Classify the symptom into categories such as: Transient availability/connectivity failure. Authentication failure. Token-related failure. Network-path problem. DNS problem. Firewall/configuration issue. Resource-governance condition. Application timeout. Long application recovery after SQL connectivity returns. Azure SQL Database documents multiple connectivity failure categories, including transient fault errors such as 40197 and 40613, authentication failures such as 18456, network termination conditions, firewall issues, and connection timeouts. The classification matters because: Not every failure should be retried in the same way. 4. Use Azure SQL Connectivity History Carefully Azure SQL Database exposes connectivity-event information through system views in the logical server's master database. One useful view is: sys.database_connection_stats It provides aggregated connection success and failure information in five-minute intervals. Connect to the logical server's master database and run: DECLARE @StartTime datetime2 = DATEADD(HOUR, -2, SYSUTCDATETIME()); SELECT database_name, start_time, end_time, success_count, total_failure_count, connection_failure_count FROM sys.database_connection_stats WHERE start_time >= @StartTime ORDER BY start_time DESC; This can help answer: Did connection failures occur? Which database was affected? In which five-minute interval? Were successful connections also occurring? But there's an important limitation. This is aggregated historical information, not a second-by-second outage trace. The data can also arrive later, with Microsoft documenting that it can take up to 24 hours for all information to appear. Therefore, don't use one five-minute bucket containing failures to claim: "The database was unavailable for five minutes." The evidence only tells you connection failures were recorded during that interval. 5. Look Deeper With sys.event_log For additional connectivity-event information, Azure SQL Database exposes: sys.event_log This view records successful database connections and connection failures and is intended to help track and troubleshoot Azure SQL Database connectivity activity. Again, connect to master. DECLARE @StartTime datetime2 = DATEADD(HOUR, -2, SYSUTCDATETIME()); SELECT database_name, start_time, end_time, event_category, event_type, event_subtype, event_subtype_desc, severity, event_count, description FROM sys.event_log WHERE start_time >= @StartTime AND event_category = N'connectivity' ORDER BY start_time DESC; Useful columns include: start_time end_time event_category event_type event_subtype_desc severity event_count description Microsoft cautions that querying sys.event_log can consume significant resources on logical servers with many databases or high login volumes, so keep the time range and other filters appropriately narrow. 6. Correlate SQL Evidence With Application Errors Now correlate the Azure SQL evidence with client telemetry. For every important application-side SQL exception, capture: UTC timestamp. SQL error number. Error message. Application instance. Operation. Retry attempt. Retry delay. Final outcome. Correlation or request ID when available. For example: UTC Layer Observation 10:00:02 Application SQL connection exception 10:00:04 Application Retry 1 fails 10:00:08 Application Retry 2 fails 10:00:15 SQL Connectivity succeeds 10:00:18 Application New connection succeeds 10:01:30 Application Queue still processing 10:05:00 Application Normal service restored Now you can separate: Connectivity interruption. Reconnection period. Application recovery period. That's substantially more useful than describing the full period as: "SQL was down." 7. Understand Connectivity and Reconfiguration Applications connect to the Azure SQL Database gateway, after which traffic is handled according to the effective connection policy and directed to the appropriate database environment. In a managed database service, applications must be designed for transient connectivity interruption. Microsoft specifically describes transient faults as conditions whose underlying cause resolves itself and notes that service reconfiguration can temporarily affect database connectivity. The application therefore shouldn't depend on one connection remaining valid indefinitely. Design for: Connections occasionally being terminated. New connection attempts occasionally failing. In-flight work requiring recovery. DNS and network paths needing to remain correctly configured. Authentication credentials or tokens remaining valid. Retry behavior that allows the system time to recover. Avoid guessing at undocumented platform internals when investigating an event. If evidence establishes only: "Connections failed briefly." Don't convert that into an unsupported explanation of why the platform changed state. 8. Retry Smartly, Not Aggressively Retry logic is essential for cloud applications that connect to Azure SQL Database. Microsoft explicitly recommends retry logic for transient connection failures. But a retry strategy needs boundaries. A good strategy considers: Number of attempts. Delay between attempts. Increasing delay. Random jitter. Maximum interval. Total retry budget. Whether the operation can safely be repeated. A bad strategy looks like: Failure ↓ Retry immediately ↓ Failure ↓ Retry immediately ↓ Failure ↓ Retry immediately... Across hundreds of application instances, this behavior can make recovery harder. A better pattern is: Failure ↓ Wait + jitter ↓ Retry ↓ Longer wait + jitter ↓ Retry ↓ Stop after bounded attempts 9. Use Microsoft.Data.SqlClient Retry Logic For .NET applications using Microsoft.Data.SqlClient, configurable retry logic is available in version 3.0 and later. Microsoft documents providers for configuring connection and command retries. A connection retry provider can be configured like this: var options = new SqlRetryLogicOption() { NumberOfTries = 5, DeltaTime = TimeSpan.FromSeconds(1), MaxTimeInterval = TimeSpan.FromSeconds(20) }; SqlRetryLogicBaseProvider provider = SqlConfigurableRetryFactory.CreateExponentialRetryProvider(options); using var connection = new SqlConnection(connectionString); connection.RetryLogicProvider = provider; connection.Open(); With this configuration: NumberOfTries = 5 Allows one initial attempt and up to four retries. DeltaTime Influences the delay between attempts. MaxTimeInterval Caps an individual retry delay. The exponential provider adds randomized jitter to retry intervals. The actual values should be tested against your application's: Latency requirements. Failure budget. Traffic volume. Concurrency. User experience. They're not universal service recommendations. 10. Connection Retry and Command Retry Are Different This is one of the most important resiliency distinctions. Suppose this fails: connection.Open(); Retrying the connection after an appropriate delay is generally straightforward for a transient connection condition. But suppose this fails: UPDATE dbo.Orders SET ProcessingStatus = N'Completed' WHERE OrderID = @OrderID; The application now has a harder question: Did the UPDATE execute before the connection was lost? Blindly repeating the command isn't always safe. Microsoft's Azure SQL guidance recommends establishing a fresh connection after a transient command failure before retrying, and retry logic must correctly account for the transaction's outcome. 11. Idempotency Matters Different operations require different retry treatment. Read-only operation For example: SELECT OrderID, ProcessingStatus FROM dbo.Orders WHERE OrderID = @OrderID; Repeating a read is often relatively straightforward, subject to your application's consistency requirements. Update operation For example: UPDATE dbo.Orders SET ProcessingStatus = N'Completed' WHERE OrderID = @OrderID; The client must determine whether repeating this operation is safe. Insert operation Consider: INSERT dbo.PaymentRequests ( RequestID, AccountID, Amount ) VALUES ( @RequestID, @AccountID, @Amount ); If the connection disappears after the server commits but before the client receives confirmation, an unconditional retry could create duplicate business activity unless the application and schema provide an idempotency mechanism. For example, a unique request identifier can make duplicate detection possible. The important principle is: Retryability is a business-operation property, not simply a SQL error property. 12. Transactions Need Special Treatment Be particularly careful with multi-statement transactions. Consider: BEGIN TRANSACTION; UPDATE dbo.Inventory SET Quantity = Quantity - @Quantity WHERE ProductID = @ProductID; INSERT dbo.ShipmentQueue ( RequestID, ProductID, Quantity ) VALUES ( @RequestID, @ProductID, @Quantity ); COMMIT TRANSACTION; If connectivity is interrupted, don't simply reconnect and retry the last statement. Your application needs a strategy that protects the integrity of the entire unit of work. Microsoft's retry documentation specifically cautions that if a transient failure invalidates an active transaction, the application should retry the entire transaction rather than only the failed statement. 13. Prevent the Retry Storm Imagine 500 application instances lose connectivity simultaneously. If every instance retries immediately: 500 requests fail ↓ 500 immediately retry ↓ Another synchronized wave ↓ Another synchronized wave Recovery traffic itself can become disruptive. Exponential backoff with jitter helps spread retries across time instead of concentrating them into synchronized bursts. The configurable retry provider in Microsoft.Data.SqlClient supports exponential retry behavior with randomized jitter. Also consider application-level resilience mechanisms such as: Circuit breakers. Back-pressure. Queueing. Controlled concurrency. Connection-pool recovery. Rate limiting. Load shedding where appropriate. The objective isn't: "Retry until SQL succeeds." It's: Recover gracefully without creating a second problem. 14. Don't Ignore the Network Path Not every SQL connection failure originates from the database. Azure SQL Database connectivity includes several components between the application and database, with connection behavior also influenced by the configured connection policy. Troubleshooting may need to include: DNS. Firewall configuration. Private endpoints. Network security rules. Client outbound connectivity. Connection policy. Authentication. Application host health. Azure SQL supports Redirect, Proxy, and Default connection-policy configurations depending on the environment and configuration. In Redirect mode, clients establish connections directly to the node hosting the database after the initial gateway interaction, which requires appropriate network access. This is another reason not to classify every connection exception as: "Azure SQL outage." 15. Test Resiliency Before an Incident Don't wait for a real platform event to discover whether your application's recovery logic works. Test controlled failure scenarios involving: New connections. Existing connections. Read-only requests. Writes. Multi-statement transactions. Multiple application instances. Queued workloads. Connection pools. Measure: Time to detect failure. First retry delay. Number of attempts. Time to establish a new connection. Failed user requests. Queue growth. Queue drain time. Full application recovery. The real success metric isn't merely: "Can I connect to the database again?" It's: "How quickly can the application return to normal service without compromising correctness?" 16. Write a Defensible Post-Incident Report A strong post-incident report separates facts, inferences, and unknowns. Confirmed facts Examples: Client connection failures were recorded during a specific UTC interval. Successful connections later resumed. Certain client instances continued failing after initial connectivity returned. Application backlog persisted beyond the connectivity event. Retry activity increased during recovery. Supported inference Example: Aggressive retry behavior likely contributed to slower application recovery. Use this classification only when application telemetry supports the relationship. Unknowns Examples: The exact internal platform operation responsible for a transient event. Whether an unrelated network event contributed. Whether a capacity change affected recovery. Don't fill gaps in telemetry with assumptions. 17. A Practical Decision Tree When an application reports an Azure SQL connectivity incident: 1. Is the database reachable now? No Check current Azure status and application connectivity. Validate networking, DNS, firewall, authentication, and Azure SQL availability. Yes Continue reconstructing the historical incident. 2. Did Azure SQL record connection failures? Yes Correlate: sys.event_log. sys.database_connection_stats. Application timestamps. Azure monitoring evidence. No or evidence isn't yet available Continue investigating application and network telemetry. Remember that historical connectivity data can arrive later. 3. Did the application retry? No Implement a bounded transient-fault handling strategy. Yes Evaluate: Retry count. Delay. Backoff. Jitter. Error classification. 4. Did many instances retry simultaneously? Yes Investigate: Retry synchronization. Circuit breaking. Back-pressure. Queue recovery. Connection pools. 5. Were writes or transactions interrupted? Yes Validate: Transaction outcome. Idempotency. Duplicate prevention. Whole-transaction retry behavior. 6. Did the application remain unhealthy after connections succeeded? Yes Measure application recovery separately from the original database connectivity event. Final Takeaway The hardest part of a transient Azure SQL event isn't always the interruption itself. Sometimes it's the application's response. A resilient architecture recognizes three separate timelines: Connectivity interruption Database/connectivity recovery Application recovery Azure SQL Database is designed as a cloud service where applications should expect and tolerate transient connectivity conditions. Microsoft recommends implementing retry logic rather than exposing appropriate transient failures directly to users. But resilient retry logic must be: Bounded. Delayed. Appropriately randomized. Error-aware. Transaction-aware. Idempotency-aware. Observable. And post-incident analysis should distinguish: What is confirmed. What is inferred. What remains unknown. Because: A brief database disconnect doesn't have to become a prolonged application outage. The objective isn't to design an application that never experiences a disconnected connection. The objective is to design an application that absorbs the interruption, recovers safely, and returns to normal operation predictably. Further reading Working with Transient Errors in Azure SQL Database Troubleshoot Common Connection Issues in Azure SQL Configure Retry Logic in Microsoft.Data.SqlClient Azure SQL Database Connectivity Architecture sys.event_log for Azure SQL Database sys.database_connection_stats for Azure SQL Database174Views0likes0CommentsThe Pipeline Is Slow, or Is SQL Waiting? Diagnosing Synapse-to-Azure SQL Regressions
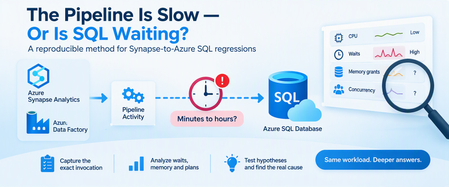
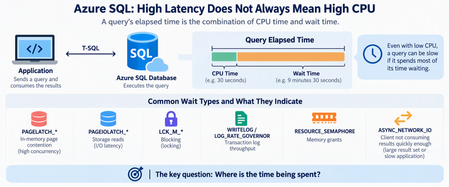
A query can consume very little CPU and still keep a pipeline waiting for hours. A pipeline activity that normally finishes in minutes suddenly starts taking hours. Nothing obvious has changed: The pipeline definition looks the same. The stored procedure looks the same. Azure SQL Database isn't showing sustained high CPU. Pipeline monitoring still points toward the SQL activity. At this point, saying "SQL is slow" isn't enough. The request may actually be: Executing expensive work. Waiting for memory. Blocked by another transaction. Reading more data than before. Running with a different execution plan. Competing with concurrent pipeline activities. Experiencing different cardinality because of different parameter values. The key is to connect the pipeline invocation to the database execution and determine where elapsed time is really going. 1. Define the Regression Precisely Before troubleshooting SQL, establish what actually changed. Capture: Expected pipeline duration. Observed pipeline duration. Pipeline activity involved. Stored procedure or statement invoked. Exact parameter values. Affected and unaffected executions. Pipeline concurrency. Retry behavior. Connection and command timeout. Deployment or configuration changes. For example: Evidence Baseline Regression Pipeline duration Minutes Much longer Stored procedure Same Same Parameter range A B Concurrent activities Low Higher Azure SQL CPU Normal Normal/moderate SQL wait behavior Unknown To investigate The most important rule is: Don't assume the SQL workload is identical simply because the stored procedure is identical. Different parameters can result in dramatically different: Row counts. Join choices. Memory grants. Sort requirements. Execution plans. Total duration. 2. Preserve the Exact Invocation One of the easiest ways to lose a performance regression is to reproduce it with different parameters. Capture the invocation before testing: Procedure name. Parameter values. Date range. Entity or partition identifier. Batch size. Pipeline run ID. Retry number. Number of parallel activities. Relevant timeout configuration. Then sanitize any business-sensitive values before sharing them outside your organization. The diagnostic principle is simple: Reproduce the same workload before trying to improve the workload. 3. Reproduce Safely Whenever possible, reproduce the issue using: A nonproduction database containing representative data. A controlled production troubleshooting window. The same stored procedure. The same parameter pattern. Comparable concurrency. For a controlled test, SQL execution statistics can help: SET STATISTICS IO ON; SET STATISTICS TIME ON; EXEC dbo.SampleProcedure @StartDate = '2026-01-01', @EndDate = '2026-01-31', @EntityID = 100; SET STATISTICS TIME OFF; SET STATISTICS IO OFF; Replace these synthetic names and values with the sanitized equivalent of the invocation you're investigating. Capture: Elapsed time. CPU time. Logical reads. Physical reads when relevant. Execution plan. Returned row count. The goal isn't simply to reproduce "slow." The goal is to understand why it is slow. 4. First Question: Is SQL Running or Waiting? This distinction changes the entire investigation. During the slow execution, examine the active request. SELECT r.session_id, r.request_id, r.status, r.command, r.start_time, r.cpu_time, r.total_elapsed_time, r.wait_type, r.wait_time, r.last_wait_type, r.wait_resource, r.blocking_session_id, r.reads, r.writes, r.logical_reads, r.row_count FROM sys.dm_exec_requests AS r WHERE r.database_id = DB_ID() ORDER BY r.total_elapsed_time DESC; sys.dm_exec_requests is supported for Azure SQL Database and exposes information about currently executing requests. Pay particular attention to the relationship between: cpu_time and: total_elapsed_time Suppose a request has: Very high elapsed time. Relatively little accumulated CPU time. A significant current wait. That's a strong reason to investigate waiting, rather than immediately treating the problem as insufficient CPU. Conversely: High elapsed time. High accumulated CPU. High logical reads. points more strongly toward expensive execution. 5. Identify Blocking Another request may be preventing the pipeline's SQL request from progressing. Start with: SELECT session_id, status, wait_type, wait_time, wait_resource, blocking_session_id, cpu_time, total_elapsed_time FROM sys.dm_exec_requests WHERE blocking_session_id <> 0 ORDER BY wait_time DESC; Blocking can explain a scenario where: Pipeline duration increases dramatically. Database CPU remains moderate. The SQL activity appears "active" for a long time. Microsoft documents sys.dm_exec_requests as one of the tools for identifying requests suspended on lock-related waits and tracing blocking behavior in Azure SQL Database. Don't confuse: "The SQL call took two hours." with: "SQL executed for two hours." Those statements aren't necessarily equivalent. 6. Look at the SQL That's Actually Running During an active incident, retrieve the request and its current SQL text: SELECT r.session_id, r.status, r.command, r.cpu_time, r.total_elapsed_time, r.wait_type, r.blocking_session_id, r.logical_reads, txt.text AS batch_text FROM sys.dm_exec_requests AS r CROSS APPLY sys.dm_exec_sql_text(r.sql_handle) AS txt WHERE r.database_id = DB_ID() ORDER BY r.total_elapsed_time DESC; sys.dm_exec_sql_text accepts the sql_handle exposed by sys.dm_exec_requests and returns the associated SQL batch text. This helps validate an important cross-service question: Is the database executing the statement we think the pipeline invoked? 7. Investigate Memory Grants Some operations need execution memory before they can proceed efficiently. Common examples include: Sorts. Hash joins. Hash aggregates. Some index operations. sys.dm_exec_query_memory_grants exposes queries that: Requested a memory grant and received one. Requested a memory grant and are still waiting. It is supported for Azure SQL Database. SELECT mg.session_id, mg.request_id, mg.dop, mg.request_time, mg.grant_time, mg.requested_memory_kb, mg.granted_memory_kb, mg.required_memory_kb, mg.used_memory_kb, mg.max_used_memory_kb, mg.query_cost, mg.timeout_sec, mg.resource_semaphore_id FROM sys.dm_exec_query_memory_grants AS mg ORDER BY mg.requested_memory_kb DESC; Interpret the important columns carefully: requested_memory_kb Memory requested by the query. granted_memory_kb Memory actually granted. required_memory_kb Minimum memory required for execution. used_memory_kb Memory currently being used. max_used_memory_kb Maximum used so far. grant_time NULL when the requested grant hasn't yet been granted. Microsoft specifically documents that queries waiting for memory grants appear in this DMV, and that grant_time remains NULL until the grant is provided. 8. Find Waiting Memory Grants During the active regression, focus specifically on requests that haven't received their grants: SELECT mg.session_id, mg.request_id, mg.request_time, mg.grant_time, mg.requested_memory_kb, mg.required_memory_kb, mg.granted_memory_kb, mg.timeout_sec, mg.dop, mg.query_cost FROM sys.dm_exec_query_memory_grants AS mg WHERE mg.grant_time IS NULL ORDER BY mg.request_time; If the affected session repeatedly appears here, you now have meaningful evidence supporting a memory-grant contention hypothesis. But that's still not enough to state: "Memory grants caused the pipeline regression." You should also establish: Whether the waiting session is actually the pipeline request. How long it remained waiting. Whether other statements were consuming large grants. Whether concurrency changed. Whether the execution plan requested unusually large memory. Why the query requested that amount of memory. That last question is particularly important. Memory-grant problems can be downstream symptoms of: Poor cardinality estimates. Large sorts. Large hash joins. Plan changes. Data growth. Parameter sensitivity. Microsoft's memory-grant troubleshooting guidance emphasizes that operations such as sorts and hash operations can require execution-memory reservations and that these grants exist for the lifetime of the query. Memory-grant contention is a diagnostic hypothesis until the evidence supports causality. 9. Pipeline Concurrency Is Database Concurrency This connection is easy to overlook. Suppose one stored-procedure invocation performs acceptably. Now imagine the orchestration layer starts: 2 copies concurrently. 5 copies concurrently. 10 copies concurrently. 20 copies concurrently. Each execution may individually be reasonable. Together, they can compete for: CPU. Workers. Memory grants. Buffer pool resources. I/O. Locks. This means: A pipeline concurrency change is also a database workload change. Even when: SQL code hasn't changed. Database configuration hasn't changed. Stored procedure code hasn't changed. As part of troubleshooting, compare: Single-execution performance. Typical production concurrency. Regression-period concurrency. Temporarily reducing pipeline concurrency can also be a valuable diagnostic experiment, provided the change is safe for the workload. 10. Capture the Live Execution Plan For a request that's still executing, Azure SQL Database supports sys.dm_exec_query_statistics_xml(), which returns Showplan XML containing transient execution statistics for an in-flight request. First identify the target session: SELECT session_id, request_id, status, command, cpu_time, total_elapsed_time, wait_type, logical_reads FROM sys.dm_exec_requests WHERE database_id = DB_ID() ORDER BY total_elapsed_time DESC; Then, for a known session: DECLARE @SessionID smallint = 123; SELECT qsx.session_id, qsx.request_id, qsx.query_plan FROM sys.dm_exec_query_statistics_xml(@SessionID) AS qsx; Replace 123 with the session being investigated. The live plan can help answer: Which operator is consuming time? How many rows are flowing through operators? Are estimates diverging significantly from runtime behavior? Are large joins or sorts involved? Where does execution appear to be spending time? Microsoft describes access to execution-plan runtime information as particularly useful when investigating long-running queries, because the information can be inspected without waiting for the query to finish. Use live-plan collection purposefully, especially on heavily loaded production systems. 11. Compare Historical Behavior in Query Store A live snapshot explains what's happening now. Query Store helps answer: What was happening when the query used to be fast? For example, find queries with multiple retained Query Store plans: SELECT TOP (50) q.query_id, COUNT(DISTINCT p.plan_id) AS plan_count, COUNT(DISTINCT p.query_plan_hash) AS distinct_plan_shapes, MIN(p.first_execution_time) AS first_plan_execution, MAX(p.last_execution_time) AS last_plan_execution FROM sys.query_store_query AS q JOIN sys.query_store_plan AS p ON q.query_id = p.query_id GROUP BY q.query_id HAVING COUNT(DISTINCT p.plan_id) > 1 ORDER BY plan_count DESC; Multiple plans aren't automatically evidence of a problem. Instead, investigate whether plan changes correlate with: Pipeline regressions. Duration changes. CPU changes. Logical-read changes. Memory behavior. Different parameter populations. 12. Compare Runtime Distributions, Not Just Averages Averages can hide regression patterns. Consider: Most executions take 10 seconds. A few take 45 minutes. The average won't fully describe the operational impact. For a known Query Store query_id, compare plans and runtime intervals: DECLARE @QueryID bigint = 123; SELECT p.plan_id, rsi.start_time, rsi.end_time, SUM(rs.count_executions) AS execution_count, CAST(AVG(rs.avg_duration) / 1000.0 AS decimal(18,2)) AS avg_duration_ms, CAST(MAX(rs.max_duration) / 1000.0 AS decimal(18,2)) AS max_duration_ms, CAST(AVG(rs.avg_cpu_time) / 1000.0 AS decimal(18,2)) AS avg_cpu_ms, CAST(AVG(rs.avg_logical_io_reads) AS decimal(18,2)) AS avg_logical_reads FROM sys.query_store_query AS q JOIN sys.query_store_plan AS p ON q.query_id = p.query_id JOIN sys.query_store_runtime_stats AS rs ON p.plan_id = rs.plan_id JOIN sys.query_store_runtime_stats_interval AS rsi ON rs.runtime_stats_interval_id = rsi.runtime_stats_interval_id WHERE q.query_id = @QueryID GROUP BY p.plan_id, rsi.start_time, rsi.end_time ORDER BY rsi.start_time DESC, p.plan_id; Replace 123 with the Query Store ID being investigated. Compare: Fast periods. Slow periods. Plans. Execution counts. CPU. Duration. Logical reads. This often produces a better picture than looking at lifetime averages. 13. Don't Force the Fastest Historical Plan Yet Suppose Query Store shows: Plan A took 30 seconds. Plan B takes 20 minutes. It might be tempting to immediately force Plan A. But first ask: How many times did Plan A execute? Which parameters used Plan A? Was the data distribution comparable? Was workload concurrency comparable? Did Plan A perform well repeatedly? Is the query parameter sensitive? A plan that was excellent for one parameter combination might be disastrous for another. The goal isn't to find the lowest historical duration. The goal is to find the plan behavior that's safe for the intended workload. If plan forcing is tested, define rollback criteria before deployment. 14. Test One Hypothesis at a Time Avoid simultaneously changing: Statistics. Indexes. Query code. Pipeline concurrency. Plan forcing. Compute tier. Doing everything together may improve performance, but you'll learn very little about why. Instead: Hypothesis: stale or inaccurate statistics Test: Appropriate statistics maintenance. Same parameters. Same concurrency. Then measure again. Hypothesis: memory-grant contention Test safely with: Reduced concurrency. Same parameter set. Same procedure. Same database configuration. Then compare: Grant wait behavior. Elapsed time. CPU time. Query plan. Hypothesis: plan regression Compare: Historical plans. Representative parameters. Runtime distributions. Only then evaluate targeted plan intervention. Hypothesis: poor cardinality Look for: Estimate-to-actual row differences. Parameter sensitivity. Implicit conversions. Sort/hash behavior. Excessive memory requests. This approach turns troubleshooting from guesswork into experimentation. 15. Correlation Is Not Root Cause This is perhaps the most important principle in cross-service troubleshooting. Suppose you see: A slow pipeline. A SQL memory-grant wait. Several concurrent activities. Those facts are correlated. They don't yet prove: "Memory contention caused the pipeline regression." A stronger conclusion requires a causal chain such as: The pipeline invokes the identified SQL request. That request repeatedly waits for execution memory during the regression. Competing queries hold substantial memory grants during the same period. Reducing the competing concurrency removes or materially reduces the grant wait. The same SQL invocation then returns toward its normal runtime. Repeating the workload reproduces the relationship. Now the evidence for causality is much stronger. This distinction matters because Azure SQL memory pressure can arise from several sources, including the chosen service objective, aggregate workload demand, and individual query memory demand. 16. Build a Cross-Service Evidence Package For difficult Synapse or Data Factory to Azure SQL regressions, both teams should be able to work from the same timeline. Capture: Pipeline evidence Pipeline run ID. Activity name. Activity start and end times. Sanitized parameters. Retry count. Timeout. Concurrent activities. Azure SQL evidence Session/request identification when captured live. Query Store query_id. Query Store plan_id. Runtime intervals. CPU time. Elapsed time. Logical reads. Wait type. Blocking session. Memory grant information. Execution plan. Investigation evidence Separate everything into: Facts Pipeline execution took longer than baseline. SQL request was identified. Request waited for memory. Multiple pipeline activities overlapped. A different plan appeared during the regression. Hypotheses Pipeline concurrency created memory-grant contention. Cardinality changes increased the requested memory grant. Parameter sensitivity caused a plan regression. Blocking contributed to runtime. Resource contention amplified an otherwise acceptable query. Experiments Document: What changed. Why it changed. Test duration. Result. Whether the hypothesis was strengthened or weakened. This prevents the pipeline and database teams from investigating two different incidents that simply happened at the same time. A Practical Decision Tree When a Synapse or Data Factory pipeline's Azure SQL activity suddenly becomes slow: 1. Can you identify the exact invocation? No Capture it before continuing. Yes Reproduce with equivalent parameters and concurrency. 2. Is SQL consuming significant CPU? Yes Investigate: Execution plan. Logical reads. Cardinality. Indexing. Parameter sensitivity. No Look at waits. 3. Is the request blocked? Yes Investigate: Blocking session. Transaction duration. Locking pattern. No Continue. 4. Is the request waiting for a memory grant? Yes Investigate: Requested versus granted memory. Other active grants. Sorts and hash operations. Cardinality estimates. Pipeline concurrency. No Investigate the actual current wait. 5. Did the execution plan change? Yes Compare: Runtime distributions. Parameter sets. CPU. Reads. Memory requirements. No Continue correlating waits, workload volume, and concurrency. 6. Does reducing concurrency improve the same invocation? Yes Resource competition becomes a stronger hypothesis. No Continue investigating query-specific behavior. Final Takeaway When a pipeline goes from minutes to hours, the fact that the Azure SQL activity is taking a long time doesn't automatically mean Azure SQL is spending all that time executing. The request might be spending much of its lifetime: Waiting for memory. Waiting behind another transaction. Waiting for another resource. Executing with a different plan. Processing a different parameter population. Competing with concurrent pipeline activities. A reliable investigation connects two perspectives: Pipeline context What exactly was invoked? With which parameters? At what time? At what concurrency? Database context Was the SQL request executing or waiting? How much CPU did it actually consume? What was it waiting for? Which plan did it use? How much memory did it request? What else was happening concurrently? sys.dm_exec_requests can identify active requests and their current execution state, while sys.dm_exec_query_memory_grants exposes statements that have requested or received execution memory. Azure SQL Database also supports obtaining transient plan information for in-flight requests through sys.dm_exec_query_statistics_xml(). Most importantly: Treat waits, memory grants, plan changes, and concurrency as evidence to test, not automatic root causes. That is how "the pipeline is slow" becomes a reproducible, evidence-backed performance diagnosis.138Views0likes0CommentsWhen More vCores Aren’t the Fix: Diagnosing Azure SQL CPU and Compilation Storms
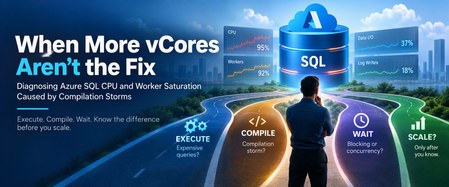
Before changing MAXDOP or adding compute, answer one question: Is the database executing work, compiling work, or waiting for work? When an Azure SQL Database approaches its CPU or worker limits, the natural reaction is often straightforward: Add more vCores. Move to a higher service objective. Change MAXDOP. Find the most expensive query. Add an index. Sometimes one of those actions is exactly what the workload needs. But not always. A database experiencing very high CPU does not necessarily have an execution CPU problem. It might instead be spending substantial resources: Repeatedly compiling queries. Generating plans that aren't efficiently reused. Processing excessive application concurrency. Holding workers while requests wait. Handling large numbers of inexpensive but extremely frequent queries. Recompiling statements because workload characteristics keep changing. Adding compute can make these symptoms less visible without making the workload healthier. The more useful question is: Where is the resource pressure actually coming from? In this article, we'll build a practical troubleshooting workflow to distinguish: Execution CPU. Compilation and recompilation pressure. Worker saturation. Blocking and concurrency. Plan instability. Parameterization problems. I/O and transaction-log pressure. Genuine capacity constraints. The goal isn't to avoid scaling. The goal is to understand the workload before deciding that scaling is the solution. 1. Start With the Symptom, Not the Conclusion Imagine an incident where you observe: CPU approaching the database's resource limit. Worker utilization rising rapidly. Application latency increasing. More active sessions than usual. Intermittent application timeouts. No obvious increase in legitimate business volume. It's tempting to conclude: "We don't have enough CPU or workers." That conclusion is premature. High worker utilization tells us that many workers are being consumed. It doesn't explain why. The underlying cause might include: Expensive queries actively consuming CPU. Large numbers of concurrent requests. Parallel query execution. Blocking. Long-running requests. Query compilation or recompilation. Excessive application calls. Several of these conditions happening simultaneously. The first step is therefore to correlate Azure SQL's primary database resource measurements. 2. Establish the Resource Timeline For recent diagnosis, sys.dm_db_resource_stats provides resource utilization samples for the current database. Run this inside the Azure SQL Database you're investigating: SELECT TOP (240) end_time, avg_cpu_percent, avg_data_io_percent, avg_log_write_percent, avg_memory_usage_percent, max_worker_percent, max_session_percent FROM sys.dm_db_resource_stats ORDER BY end_time DESC; This gives us several important signals: avg_cpu_percent CPU utilization relative to the database resource limit. avg_data_io_percent Data I/O utilization. avg_log_write_percent Transaction log write utilization. avg_memory_usage_percent Memory usage. max_worker_percent Worker utilization. max_session_percent Session utilization. sys.dm_db_resource_stats returns approximately one hour of resource data at roughly 15-second intervals for Azure SQL Database. A useful summary is: SELECT MIN(end_time) AS sample_start_utc, MAX(end_time) AS sample_end_utc, CAST(AVG(avg_cpu_percent) AS decimal(10,2)) AS avg_cpu_percent, CAST(MAX(avg_cpu_percent) AS decimal(10,2)) AS max_cpu_percent, CAST(MAX(max_worker_percent) AS decimal(10,2)) AS max_worker_percent, CAST(MAX(max_session_percent) AS decimal(10,2)) AS max_session_percent, CAST(MAX(avg_data_io_percent) AS decimal(10,2)) AS max_data_io_percent, CAST(MAX(avg_log_write_percent) AS decimal(10,2)) AS max_log_write_percent, CAST(MAX(avg_memory_usage_percent) AS decimal(10,2)) AS max_memory_usage_percent FROM sys.dm_db_resource_stats; Look for relationships between: CPU and workers. Workers and sessions. CPU and data I/O. CPU and log writes. Memory and concurrency. When the spike begins. How long it persists. How quickly the database returns to normal. Important: sys.dm_db_resource_stats provides recent, high-resolution resource statistics. For longer historical analysis, Azure SQL also exposes sys.resource_stats from the logical server's master database, with five-minute aggregation and longer retention. 3. First Classification: Executing, Compiling, or Waiting? Before tuning anything, classify the workload. Scenario A: The database is executing expensive work Typical evidence includes: High CPU. A small set of queries dominates total CPU. High logical reads. Large joins or aggregations. Expensive scans. Parallel query execution. Execution plans that explain the consumption. In this case, compilation may be perfectly normal. The database is simply performing expensive execution work. Scenario B: The workload may have excessive compilation Typical evidence might include: Many similar query shapes. Large numbers of distinct query texts. High compile counts. Frequent recompilation. Poor parameterization. Very frequent short-running queries. Temporary-object-heavy procedures. CPU usage not fully explained by the top executing queries. None of these signals alone proves that a compilation storm exists. The key is correlation. Scenario C: Workers are waiting rather than computing Typical evidence includes: High worker utilization. CPU that isn't proportionally high. Significant blocking. Lock waits. Long-running transactions. Many concurrent requests. Requests holding workers while waiting for resources. The remedy here can be completely different from an execution CPU problem. 4. Build a Minimum Evidence Packet Before making configuration changes, capture enough evidence to explain the incident. At minimum, collect: Exact incident window in UTC. CPU utilization. Worker utilization. Session utilization. Data I/O. Log-write utilization. Memory utilization. Top queries by CPU. Top queries by duration. Execution counts. Query Store wait categories. Number of relevant Query Store plans. Compile counts. Application deployment timestamps. Scheduled workload timestamps. Blocking information, if the incident is currently happening. Query Store is particularly useful because it provides historical information about: Query text. Execution plans. Runtime statistics. Execution counts. Query performance over time. Query Store wait categories. 5. Find the Queries Consuming the Most CPU Don't rely only on whatever happens to be executing at the moment you connect. Query Store can help determine which queries consumed CPU during the period under investigation. The following example examines approximately the last hour. DECLARE @StartTime datetimeoffset = DATEADD(HOUR, -1, SYSUTCDATETIME()); WITH RuntimeStats AS ( SELECT rs.plan_id, rs.runtime_stats_interval_id, rs.execution_type, SUM(rs.count_executions) AS execution_count, SUM ( CONVERT(decimal(38,4), rs.avg_cpu_time) * rs.count_executions ) AS total_cpu_us FROM sys.query_store_runtime_stats AS rs GROUP BY rs.plan_id, rs.runtime_stats_interval_id, rs.execution_type ) SELECT TOP (20) q.query_id, qt.query_sql_text, SUM(r.execution_count) AS executions, CAST ( SUM(r.total_cpu_us) / NULLIF(SUM(r.execution_count), 0) AS decimal(20,2) ) AS weighted_avg_cpu_us, CAST ( SUM(r.total_cpu_us) AS decimal(38,2) ) AS total_cpu_us FROM RuntimeStats AS r JOIN sys.query_store_runtime_stats_interval AS rsi ON r.runtime_stats_interval_id = rsi.runtime_stats_interval_id JOIN sys.query_store_plan AS p ON r.plan_id = p.plan_id JOIN sys.query_store_query AS q ON p.query_id = q.query_id JOIN sys.query_store_query_text AS qt ON q.query_text_id = qt.query_text_id WHERE r.execution_type = 0 AND rsi.end_time > @StartTime GROUP BY q.query_id, qt.query_sql_text ORDER BY total_cpu_us DESC; A few important details: Query Store CPU statistics are reported in microseconds. The query pre-aggregates Query Store runtime rows. execution_type = 0 restricts the analysis to normally completed executions. The average CPU calculation is weighted by execution count. Now ask the critical question: Do the highest-CPU queries explain the database-level CPU spike? If they do, investigate: Execution plans. Logical reads. Indexing. Cardinality estimates. Join strategies. Parallelism. Parameter sensitivity. If they don't, widen the investigation. Compilation, concurrency, waits, application request volume, or another engine activity may deserve more attention. 6. Don't Ignore Execution Frequency A query doesn't need to be individually expensive to create substantial pressure. Imagine: Query A consumes 500 ms of CPU and runs 20 times. Query B consumes 2 ms of CPU but runs 200,000 times. Query B may represent far more total work. Use Query Store to identify high-frequency queries: DECLARE @StartTime datetimeoffset = DATEADD(HOUR, -1, SYSUTCDATETIME()); WITH RuntimeStats AS ( SELECT rs.plan_id, rs.runtime_stats_interval_id, rs.execution_type, SUM(rs.count_executions) AS execution_count, SUM ( CONVERT(decimal(38,4), rs.avg_cpu_time) * rs.count_executions ) AS total_cpu_us FROM sys.query_store_runtime_stats AS rs GROUP BY rs.plan_id, rs.runtime_stats_interval_id, rs.execution_type ) SELECT TOP (20) q.query_id, qt.query_sql_text, SUM(r.execution_count) AS executions, CAST ( SUM(r.total_cpu_us) AS decimal(38,2) ) AS total_cpu_us FROM RuntimeStats AS r JOIN sys.query_store_runtime_stats_interval AS rsi ON r.runtime_stats_interval_id = rsi.runtime_stats_interval_id JOIN sys.query_store_plan AS p ON r.plan_id = p.plan_id JOIN sys.query_store_query AS q ON p.query_id = q.query_id JOIN sys.query_store_query_text AS qt ON q.query_text_id = qt.query_text_id WHERE r.execution_type = 0 AND rsi.end_time > @StartTime GROUP BY q.query_id, qt.query_sql_text ORDER BY executions DESC; This becomes particularly important when diagnosing compilation problems because a high-frequency workload can amplify a relatively small inefficiency thousands of times per second. 7. What Does a Compilation Storm Look Like? A compilation storm usually isn't one expensive compilation. It's a workload pattern. Signals worth investigating include: Large numbers of nearly identical queries. Literal values embedded into otherwise identical SQL statements. Poor plan reuse. Elevated compile counts. Rapid plan generation. Temporary-object-heavy execution. Dynamically generated SQL where query text changes unnecessarily. Application parameter types that don't align with SQL types. For example, an application might continuously submit: SELECT OrderID, OrderDate FROM dbo.Orders WHERE CustomerID = 1001; Then: SELECT OrderID, OrderDate FROM dbo.Orders WHERE CustomerID = 1002; Then: SELECT OrderID, OrderDate FROM dbo.Orders WHERE CustomerID = 1003; Compare that with an appropriately parameterized application call: DECLARE @CustomerID int = 1001; EXEC sys.sp_executesql N' SELECT OrderID, OrderDate FROM dbo.Orders WHERE CustomerID = @CustomerID; ', N'@CustomerID int', @CustomerID = @CustomerID; Parameterized SQL can make plan reuse possible when the workload characteristics make reuse appropriate. But there's an important caveat: Parameterization itself is not universally better. Highly skewed data distributions can produce different optimal plans for different parameter values. The target isn't: "Reuse every plan." It's: Avoid unnecessary compilation while preserving appropriate plan choices. 8. Look for Plan Churn and Compilation Activity Query Store can help identify queries associated with multiple retained plans and elevated compile activity. SELECT TOP (50) q.query_id, COUNT(DISTINCT p.plan_id) AS plan_count, COUNT(DISTINCT p.query_plan_hash) AS distinct_plan_shapes, q.count_compiles, q.initial_compile_start_time, q.last_compile_start_time, CAST ( q.avg_compile_duration AS decimal(20,2) ) AS avg_compile_duration_us, q.last_compile_duration AS last_compile_duration_us, CAST ( q.avg_optimize_cpu_time AS decimal(20,2) ) AS avg_optimize_cpu_time_us FROM sys.query_store_query AS q JOIN sys.query_store_plan AS p ON q.query_id = p.query_id GROUP BY q.query_id, q.count_compiles, q.initial_compile_start_time, q.last_compile_start_time, q.avg_compile_duration, q.last_compile_duration, q.avg_optimize_cpu_time HAVING COUNT(DISTINCT p.plan_id) > 1 ORDER BY plan_count DESC, q.count_compiles DESC; This distinction is important: Multiple Query Store plans do not automatically mean harmful plan churn. Query Store intentionally maintains query and plan history. Multiple plans may be perfectly legitimate because of: Plan changes over time. Statistics changes. Index changes. Parameter-sensitive behavior. Database changes. Query Store history. Intentional plan management. The signal becomes more interesting when multiple plans correlate with: High compile counts. Compilation during the incident. Rising CPU. Large latency variation. Performance regression. Also compare: COUNT(DISTINCT p.plan_id) with: COUNT(DISTINCT p.query_plan_hash) Several retained plan records don't necessarily mean several materially different plan shapes. 9. Look for Queries With Large Duration Variation Average latency can hide an important problem. A query averaging 30 ms might look harmless until some executions take several seconds. Use Query Store to identify significant variation: DECLARE @StartTime datetimeoffset = DATEADD(HOUR, -1, SYSUTCDATETIME()); WITH RuntimeStats AS ( SELECT rs.plan_id, rs.runtime_stats_interval_id, rs.execution_type, SUM(rs.count_executions) AS execution_count, SUM ( CONVERT(decimal(38,4), rs.avg_duration) * rs.count_executions ) AS total_duration_us, MAX(rs.max_duration) AS max_duration_us FROM sys.query_store_runtime_stats AS rs GROUP BY rs.plan_id, rs.runtime_stats_interval_id, rs.execution_type ) SELECT TOP (30) q.query_id, COUNT(DISTINCT p.plan_id) AS plan_count, SUM(r.execution_count) AS execution_count, CAST ( SUM(r.total_duration_us) / NULLIF(SUM(r.execution_count), 0) AS decimal(20,2) ) AS weighted_avg_duration_us, MAX(r.max_duration_us) AS max_duration_us, CAST ( MAX(r.max_duration_us) / NULLIF ( SUM(r.total_duration_us) / NULLIF(SUM(r.execution_count), 0), 0 ) AS decimal(20,2) ) AS max_to_average_ratio FROM RuntimeStats AS r JOIN sys.query_store_runtime_stats_interval AS rsi ON r.runtime_stats_interval_id = rsi.runtime_stats_interval_id JOIN sys.query_store_plan AS p ON r.plan_id = p.plan_id JOIN sys.query_store_query AS q ON p.query_id = q.query_id WHERE r.execution_type = 0 AND rsi.end_time > @StartTime GROUP BY q.query_id ORDER BY max_to_average_ratio DESC; Large variation can justify investigating: Parameter-sensitive behavior. Blocking. Different execution plans. Data skew. Changing memory requirements. Concurrent workload effects. It doesn't, by itself, tell us which one is responsible. 10. Use Query Store Wait Categories Correctly Wait information provides another dimension. Query Store can associate wait categories with query plans and runtime intervals. That's an important distinction. Query Store isn't intended to provide a historical record of every individual SQL Server wait type. The following query summarizes Query Store waits for approximately the last hour: DECLARE @StartTime datetimeoffset = DATEADD(HOUR, -1, SYSUTCDATETIME()); WITH WaitStats AS ( SELECT ws.plan_id, ws.runtime_stats_interval_id, ws.execution_type, ws.wait_category, ws.wait_category_desc, SUM(ws.total_query_wait_time_ms) AS total_wait_ms FROM sys.query_store_wait_stats AS ws GROUP BY ws.plan_id, ws.runtime_stats_interval_id, ws.execution_type, ws.wait_category, ws.wait_category_desc ) SELECT TOP (30) w.wait_category_desc, SUM(w.total_wait_ms) AS total_wait_ms FROM WaitStats AS w JOIN sys.query_store_runtime_stats_interval AS rsi ON w.runtime_stats_interval_id = rsi.runtime_stats_interval_id WHERE w.execution_type = 0 AND rsi.end_time > @StartTime GROUP BY w.wait_category_desc ORDER BY total_wait_ms DESC; Look for categories associated with: Locking. CPU. Parallelism. Buffer I/O. Transaction log activity. Memory. Other resource pressure. Use these categories to determine where the next investigation should go, not as standalone proof of root cause. 11. Capture Exact Wait Types During an Active Incident When the issue is occurring now, live DMVs can provide more specific evidence. For example: SELECT wt.session_id, wt.exec_context_id, wt.wait_type, wt.wait_duration_ms, wt.blocking_session_id, r.status, r.command, r.cpu_time, r.total_elapsed_time, r.logical_reads, r.reads, r.writes, wt.resource_description FROM sys.dm_os_waiting_tasks AS wt LEFT JOIN sys.dm_exec_requests AS r ON wt.session_id = r.session_id WHERE wt.session_id <> @@SPID ORDER BY wt.wait_duration_ms DESC; This creates an important analytical distinction. Query Store Use it for: Historical query behavior. Historical plan behavior. Runtime statistics. Historical wait categories. Live DMVs Use them for: Specific waits occurring now. Current requests. Current blocking. Current resource use. For example, individual waits such as: RESOURCE_SEMAPHORE_QUERY_COMPILE or: SOS_SCHEDULER_YIELD need to be interpreted alongside the rest of the evidence. A compile-related wait doesn't automatically prove that compilation CPU caused the incident. Likewise, a scheduler-related wait doesn't automatically prove that MAXDOP is wrong. 12. Don't Ignore Data-Type Mismatches Another frequently overlooked issue is inconsistent data types between the application and database. Imagine a column defined as: CustomerCode varchar(30) while the application sends: @CustomerCode nvarchar(30) Or perhaps the column is: CustomerID int while the application uses: bigint Depending on the particular expression and conversion direction, an implicit conversion may affect: Index access methods. Cardinality estimation. Plan selection. Reads. CPU consumption. As a general principle: Application parameter definitions should align with the corresponding database column types wherever practical. Compare: Data type. Length. Precision. Scale. Unicode versus non-Unicode. Collation when relevant. Don't reach for a hint when the underlying problem is an application/database contract mismatch. 13. Temporary Tables Require Evidence, Not Assumptions Temporary tables are useful and common SQL Server constructs. They're not inherently a performance problem. However, some workloads repeatedly: Create temporary tables. Populate them. Modify them. Create or drop temporary indexes. Execute queries heavily dependent on temporary-table cardinality. Those patterns can affect optimization and recompilation behavior. The important troubleshooting principle is: Don't rewrite temporary-table logic just because compilation appears high. First demonstrate the relationship. Correlate: Compilation timing. Procedure executions. Query Store history. CPU peaks. Plan variation. Application workload cycles. Then decide whether temporary-table behavior actually requires modification. 14. OPTION (RECOMPILE) Is Not a Universal Compilation Fix This hint deserves particular care: SELECT ... FROM ... WHERE ... OPTION (RECOMPILE); OPTION (RECOMPILE) instructs SQL Server to compile a new temporary plan for that execution rather than reuse the normal cached plan for the statement. That can be very useful for certain parameter-sensitive workloads. For example: A query behaves very differently for different parameter populations. Reusing one cached plan consistently produces poor performance. Compilation cost is small compared with savings in execution cost. But consider the problem we're investigating. If the workload already suffers from excessive compilation, broadly introducing OPTION (RECOMPILE) may increase compilation work. Treat it as: A targeted tool. A workload-specific optimization. A controlled experiment. A change requiring before-and-after measurement. Not as: A universal response to high CPU. A default fix for plan instability. A general cure for compilation storms. 15. MAXDOP Is Not a Universal CPU Fix Either Suppose CPU and worker utilization are both elevated. Should we immediately lower MAXDOP? Not necessarily. MAXDOP controls the maximum degree of parallelism available to a parallel query plan. It doesn't directly fix: Excessive compilation. Poor parameterization. Blocking. Inefficient serial queries. Excessive application concurrency. Data-type mismatches. Poor indexes. Check the database-scoped setting: SELECT name, value, value_for_secondary FROM sys.database_scoped_configurations WHERE name = N'MAXDOP'; Then determine whether parallelism is genuinely implicated. Ask: Are the CPU-dominant queries running parallel plans? Are parallel requests consuming a meaningful share of workers? Does the workload benefit from parallelism? Would reducing parallelism decrease worker pressure but increase latency? Is concurrency the real problem instead? The correct reasoning is not: High workers = reduce MAXDOP. It is: Determine whether intra-query parallelism is materially contributing to the observed resource pressure. Also remember that database-scoped configuration changes can result in plan invalidation and subsequent recompilation. Configuration experiments should therefore be controlled and monitored. 16. Be Careful With Forced Plans Query Store allows you to force a selected plan. That's an extremely useful capability. It's also easy to misuse. A plan that was historically fast isn't automatically safe for: Every parameter value. Every data distribution. Every concurrency level. Every future workload. Before forcing a plan, evaluate: Parameter sensitivity. Data distribution. Query execution frequency. CPU. Duration. Logical reads. Memory use. Concurrency. Performance across representative parameter values. If the evidence supports a controlled test: EXEC sys.sp_query_store_force_plan @query_id = 123, plan_id = 456; Monitor forcing status: SELECT plan_id, query_id, is_forced_plan, force_failure_count, last_force_failure_reason, last_force_failure_reason_desc FROM sys.query_store_plan WHERE query_id = 123; And have a rollback path: EXEC sys.sp_query_store_unforce_plan @query_id = 123, plan_id = 456; Replace the sample IDs with the Query Store identifiers from your own database. Most importantly: Plan forcing attempts to reproduce the selected plan. It shouldn't be treated as a guarantee that future execution will always behave exactly like the historical execution you're trying to reproduce. Treat plan forcing as a controlled intervention rather than an automatic response to plan variation. 17. A Practical Remediation Ladder Once you've identified the likely source of resource consumption, move from structural corrections toward infrastructure scaling. Step 1: Correct data-type mismatches Align: Application parameters. Database columns. Stored procedure parameters. Dynamic SQL parameter definitions. Step 2: Reduce unnecessary query-shape variation Use appropriate parameterization where the workload benefits from plan reuse. Avoid generating thousands of logically identical query strings simply because literal values change. Step 3: Investigate high-frequency workload patterns Determine whether the problem is a single expensive query or thousands of inexpensive queries executed continuously. Step 4: Investigate temporary-table behavior Only redesign temporary-table logic when evidence links it to: Recompilation. Poor cardinality estimates. Plan instability. Excessive CPU. Step 5: Control burst concurrency If large numbers of requests arrive simultaneously, consider: Application-side throttling. Batching. Queuing. Staggering jobs. Reducing redundant requests. Controlling parallel application calls. Step 6: Optimize genuinely expensive execution Investigate: Index design. Logical reads. Access methods. Cardinality estimates. Join strategies. Memory grants. Parameter-sensitive behavior. Parallel execution. Step 7: Use targeted plan interventions Where supported by evidence, consider: Query Store plan forcing. Query Store hints. Carefully tested query hints. Always define: What behavior you're trying to change. What success looks like. How long you'll observe it. What triggers rollback. Step 8: Scale when the workload genuinely requires it Scaling is completely reasonable when: Workload optimization has been assessed. Business growth has increased concurrency. CPU demand represents useful execution work. Latency requirements justify additional compute. Scaling is the lowest-risk mitigation for an active business impact. The optimized workload legitimately requires more capacity. The important distinction is: Scaling should solve a capacity problem, not simply hide an unexplained workload problem. 18. Scale or Fix? Use the following matrix as a starting point. Observation Likely investigation First response High CPU + a few queries dominate CPU Execution pressure Investigate plans, reads, indexes, and query design High CPU + many similar query texts Parameterization/compilation Investigate query generation and plan reuse High workers + moderate CPU + blocking Waiting/concurrency Investigate blockers and transaction duration High CPU + high Data I/O Data-access pressure Investigate scans, logical/physical reads, and indexes High CPU + large plan variation Plan instability Correlate Query Store plans with performance periods Sudden spike after application release Workload change Compare deployment timing with query behavior Predictable scheduled spike Burst workload Tune, stagger, batch, or provide appropriate capacity Optimized workload + sustained legitimate CPU demand Capacity Consider scaling Scaling helps temporarily but the pattern repeatedly returns Workload or capacity issue still unexplained Revisit root-cause evidence This matrix is diagnostic, not an Azure SQL service guarantee. There is no universal CPU percentage or worker percentage at which every workload should automatically scale. 19. Validate the Fix A performance investigation isn't complete when CPU drops once. Validate the change against an equivalent workload cycle. Compare: CPU utilization. Worker utilization. Session utilization. Execution counts. Query CPU. Query duration. Query Store wait categories. Relevant plan counts. Application latency. Application timeouts. Start again with: SELECT end_time, avg_cpu_percent, max_worker_percent, max_session_percent, avg_data_io_percent, avg_log_write_percent, avg_memory_usage_percent FROM sys.dm_db_resource_stats ORDER BY end_time DESC; Whenever possible, compare equivalent periods: Same business workload. Same scheduled job. Similar request volume. Similar concurrency. Similar parameter distribution. Don't declare success simply because the workload disappeared. 20. Define Regression Criteria Before Deployment Before applying a tuning change, decide what constitutes failure. Possible rollback signals include: CPU becomes materially worse. P95 or P99 application latency regresses. Worker utilization rises. Timeouts increase. Logical reads rise materially. Another parameter population becomes slower. Query Store reveals a plan regression. These aren't universal thresholds. Define them according to: Your workload baseline. Application requirements. Business SLAs or SLOs. Normal workload variation. 21. Build an Escalation-Ready Evidence Package If further investigation or escalation is required, a clear evidence package dramatically reduces troubleshooting time. Include: Incident start and end in UTC. CPU timeline. Worker timeline. Session timeline. Memory timeline. Data I/O timeline. Log-write timeline. Sanitized Query Store identifiers. Relevant execution plans. Query Store wait categories. Live wait types captured during the incident. Compile counts. Query execution counts. Application deployment timeline. Scheduled workload information. Reproduction steps, when available. Separate your conclusions into two categories. Facts Examples: CPU increased during the incident window. Worker utilization increased at the same time. Query Store contained multiple plans. Compile counts were elevated. Execution count rose. Blocking was observed. Latency increased following a deployment. Hypotheses Examples: Compilation contributed materially to CPU utilization. Application-generated query variation reduced plan reuse. Temporary-table behavior contributed to recompilation. Parameter sensitivity contributed to latency variation. Increased concurrency amplified an existing query-performance problem. This distinction matters. Correlation is evidence. It isn't automatically root cause. 22. The Complete Diagnostic Decision Tree When Azure SQL CPU or worker utilization suddenly climbs, use this sequence. Question 1: Is CPU high? No Investigate: Workers. Blocking. Waits. Sessions. Long-running transactions. Concurrency. Yes Continue. Question 2: Do a small number of queries explain most execution CPU? Yes Investigate: Execution plans. Logical reads. Indexing. Cardinality estimates. Parallelism. Parameter sensitivity. No Broaden the investigation toward: Compilation. Query frequency. Concurrency. Workload shape. Question 3: Is there significant query-text or plan variation? Yes Investigate: Application parameterization. Dynamic SQL generation. Compile counts. Plan history. Parameter sensitivity. No Continue. Question 4: Are workers primarily waiting? Yes Investigate: Blocking. Locks. Long-running transactions. Current waits. Application concurrency. No Continue. Question 5: Are data I/O or log-write resources saturated? Yes Investigate those as potential independent bottlenecks. No Continue CPU-focused analysis. Question 6: Does compilation activity correlate with the CPU window? Yes Investigate: Query-shape variation. Parameterization. Recompilation. Application request patterns. Temporary-object behavior. No Return to: Execution CPU. Concurrency. Parallelism. Other engine work. Question 7: Does the workload still need additional compute after optimizations are assessed? Yes Scaling is appropriate. No Fix the workload behavior first. Final Takeaway The most important lesson is simple: High CPU describes a symptom. It doesn't identify the cause. The same applies to workers. High worker utilization doesn't necessarily mean Azure SQL Database needs more workers or more vCores. Before scaling or changing MAXDOP, determine whether the database is primarily: Executing expensive work. Executing inexpensive work far too frequently. Compiling excessive work. Waiting on other work. Handling excessive concurrency. Moving too much data. Generating unnecessary query variations or plans. The strongest diagnosis comes from correlating multiple sources of evidence: sys.dm_db_resource_stats. Query Store execution statistics. Query Store plan history. Query Store compilation information. Query Store wait categories. Live wait information. Execution plans. Application and deployment timelines. Sometimes the correct answer really is more compute. But if the underlying problem is unnecessary compilation, poor parameterization, blocking, uncontrolled concurrency, or inefficient queries, additional compute might simply give the problem more room to grow. Diagnose first. Optimize where the evidence points. Scale when the workload actually needs it. Further Reading For more information on the concepts and diagnostic techniques discussed in this article, refer to the following official Microsoft documentation: https://learn.microsoft.com/en-us/sql/relational-databases/system-dynamic-management-views/sys-dm-db-resource-stats-azure-sql-database sys.resource_stats (Azure SQL Database) Monitor performance by using the Query Store Best practices for monitoring workloads with Query Store sys.query_store_query (Transact-SQL) sys.query_store_plan (Transact-SQL) sys.query_store_runtime_stats (Transact-SQL) sys.query_store_wait_stats (Transact-SQL) https://learn.microsoft.com/en-us/sql/relational-databases/system-dynamic-management-views/sys-dm-os-waiting-tasks-transact-sql sp_query_store_force_plan (Transact-SQL) Configure the maximum degree of parallelism (MAXDOP) in Azure SQL Database https://learn.microsoft.com/en-us/sql/relational-databases/performance/query-store-hints Query Store hints best practices289Views0likes0CommentsWhat Really Happens When You Scale Azure SQL Database? How to Monitor Long-Running Scale Operations
One of the advantages of Azure SQL Database is the ability to scale compute resources without managing the underlying infrastructure. Changing from 4 vCores to 8 vCores can be only a few clicks or a single command. But there is a question I frequently see when troubleshooting scaling operations: "Why is my Azure SQL Database scaling operation taking so long?" An even more interesting question appears when two databases undergo what looks like the same change: Database A Business Critical → Business Critical Scaling duration: ~1 hour 15 minutes Database B Business Critical → Business Critical Scaling duration: ~2 hours 15 minutes Same service tier. Similar scaling request. Very different completion time. At first glance, that might look unusual. However, a scale operation isn't simply Azure changing a configuration value from one number of vCores to another. Depending on the source and target configuration, Azure SQL Database can need to provision target compute, prepare or copy database data, transition connections to the target compute, and clean up the original environment. Microsoft specifically notes that creating a database replica on the new compute instance for some scaling combinations can strongly influence the overall latency. Let's look at what happens and, more importantly, how to monitor it. Scaling Is More Than Changing vCores When you submit a scaling request such as: Business Critical 4 vCores ↓ Business Critical 8 vCores it's tempting to imagine something like: CPU allocation: 4 → 8 Done. That isn't necessarily what happens. At a high level, Microsoft documents a scaling workflow involving two important stages: Create a new compute instance with the requested service tier and compute size Switch routing from the original compute instance to the new one For some combinations of service-tier and compute-size changes, Azure SQL Database must also create a replica on the new compute instance, involving data copying. A simplified view is: Scaling request ↓ Prepare target compute ↓ Prepare/copy database if required ↓ Bring target environment ready ↓ Switch connections ↓ Scaling complete The important takeaway is: A scale operation can involve moving database execution to a new compute environment, not simply increasing CPU on the existing environment. Why Can Two Similar Databases Take Different Amounts of Time? This is where troubleshooting becomes interesting. Imagine two databases: Database A 4 vCores → 8 vCores Completed in 75 minutes Database B 4 vCores → 8 vCores Completed in 135 minutes The natural question is: "If the source and destination configurations are the same, shouldn't the duration also be the same?" Not necessarily. The requested configuration tells us where the database needs to end up. It does not mean the work required to reach that state is identical. Several factors can affect the operation. 1. Database Size and Data Movement One of the most important factors can be the amount of data that must be prepared on the target compute. Microsoft's scaling documentation explicitly states that for some source/target combinations, a replica must be created on the new compute instance. That involves copying data and can significantly affect the overall scaling latency. Conceptually: Small database Provision ████ Data preparation ██████ Switch █ versus: Large database Provision ████ Data preparation ████████████████████████ Switch █ Database size alone doesn't provide a precise prediction of completion time, but it can influence the amount of work required during applicable scaling paths. 2. Workload Activity Matters A database also doesn't necessarily stop processing application traffic while Azure prepares the target environment. Microsoft states that during target compute creation, the database remains online and connections continue to the original compute instance. That creates an interesting challenge: Target environment preparing + Application still generating workload A highly active transactional database and a relatively idle database can therefore present different operational conditions during scaling. The practical lesson is: Two databases with the same service objective aren't necessarily in the same workload state when scaling begins. When investigating a slow scale operation, look at the activity around the scaling window, including: transaction volume; write activity; long-running transactions; workload peaks; batch operations; maintenance activity. 3. Long-Running Transactions Can Affect Switchover Toward the end of scaling, connections need to transition to the target compute instance. Microsoft documents that existing connections to the original compute are dropped and new connections are established to the target compute. The switch generally results in a short interruption, often only a few seconds and generally less than 30 seconds. However, there's an important exception. Microsoft notes that: If long-running transactions are active when connections are dropped, the switch can take longer because aborted transactions need to recover. Conceptually: Normal transition Target ready ↓ Switch ↓ Reconnect ↓ Done With a long-running transaction: Target ready ↓ Connection transition ↓ Transaction interruption ↓ Recovery work ↓ Reconnect ↓ Done This is one reason application workload should be considered when evaluating scaling duration. 4. Resource Availability Can Matter Another clue comes from Azure SQL's operation-status metadata. The sys.dm_operation_status DMV exposes several states for database operations, including: PENDING IN_PROGRESS COMPLETED FAILED CANCEL_IN_PROGRESS CANCELLED Importantly, Microsoft defines PENDING as an operation waiting for resource or quota availability. That means some of the elapsed time around an operation may occur before active processing progresses as expected. This is why comparing scale operations purely by database size or vCore count can be misleading. How Can I Monitor a Scaling Operation? Rather than repeatedly refreshing the Azure portal, there are several useful methods for inspecting progress. Method 1: Azure PowerShell with Get-AzSqlDatabaseActivity Azure PowerShell provides: Get-AzSqlDatabaseActivity Microsoft documents this cmdlet specifically for retrieving the status of operations against Azure SQL databases. For example: Get-AzSqlDatabaseActivity ` -ResourceGroupName "MyResourceGroup" ` -ServerName "myserver" ` -DatabaseName "mydatabase" This can help identify database operations associated with the selected database. For clearer output: Get-AzSqlDatabaseActivity ` -ResourceGroupName "MyResourceGroup" ` -ServerName "myserver" ` -DatabaseName "mydatabase" | Select-Object ` Operation, OperationId, DatabaseName, State, PercentComplete, StartTime, ErrorCode, ErrorMessage The specific fields returned can vary with module/API behavior, so always interpret them in the context of the operation being monitored. The important point is that you're no longer asking only: "Is scaling still happening?" You can inspect the operation itself. Method 2: Check Current and Requested Service Objectives Another useful PowerShell command is: Get-AzSqlDatabase Microsoft documents this cmdlet for retrieving Azure SQL Database properties. Its output includes service-objective information such as CurrentServiceObjectiveName and RequestedServiceObjectiveName. For example: Get-AzSqlDatabase ` -ResourceGroupName "MyResourceGroup" ` -ServerName "myserver" ` -DatabaseName "mydatabase" | Select-Object ` DatabaseName, Status, Edition, CurrentServiceObjectiveName, RequestedServiceObjectiveName During a change, comparing these fields can help establish the current and requested configuration. Think of it as: CurrentServiceObjectiveName ↓ Where am I now? RequestedServiceObjectiveName ↓ Where am I trying to go? Once the operation completes successfully, the current configuration should reflect the requested target. Method 3: Use sys.dm_operation_status For SQL-side monitoring, sys.dm_operation_status provides information about database operations such as CREATE and ALTER. For example: SELECT major_resource_id, operation, state_desc, percent_complete, start_time, last_modify_time, error_code, error_desc FROM sys.dm_operation_status ORDER BY start_time DESC; Useful columns include: operation state_desc percent_complete start_time last_modify_time error_code error_desc Microsoft defines the operation states as including PENDING, IN_PROGRESS, COMPLETED, and FAILED. Be Careful With PercentComplete This is an important detail. It is tempting to interpret: PercentComplete = 50 as: "Half of the work is finished, so half of the remaining time is left." That isn't necessarily correct. For sys.dm_operation_status, Microsoft documents percent_complete for most operations as: 0 = Operation not started 50 = Operation in progress 100 = Operation complete Restore operations are an important exception, where values between 1 and 99 can indicate more granular progress. So for a normal ALTER/scale operation: 50% should generally be interpreted as: The operation is in progress rather than: Exactly half the work remains. This distinction is very useful when communicating with application teams during long-running operations. A Practical Monitoring Script For PowerShell users, I like combining the configuration and operation views. First check the database: $db = Get-AzSqlDatabase ` -ResourceGroupName "MyResourceGroup" ` -ServerName "myserver" ` -DatabaseName "mydatabase" $db | Select-Object ` DatabaseName, Status, Edition, CurrentServiceObjectiveName, RequestedServiceObjectiveName Then check database operations: Get-AzSqlDatabaseActivity ` -ResourceGroupName "MyResourceGroup" ` -ServerName "myserver" ` -DatabaseName "mydatabase" This gives you two complementary perspectives: DATABASE STATE + OPERATION STATE ↓ Better understanding of scaling progress What About Application Availability During Scaling? One of the biggest concerns is: "Does the database remain available while scaling?" For Azure SQL Database, Microsoft states that the database remains online while the new compute environment is being prepared. Connections continue to the original compute during that stage. The important availability event occurs during the transition. At switchover: Existing connections ↓ Dropped ↓ Routing switches ↓ New connections ↓ Target compute Microsoft says the switch generally causes an interruption of less than 30 seconds and often only a few seconds. Applications should therefore implement appropriate transient-error handling and retry logic. Microsoft explicitly recommends retry logic for applications and components using the database while the service tier is being changed. Don't Immediately Cancel a "Slow" Scaling Operation A scale operation taking longer than expected does not automatically mean: Scaling is stuck. It could still be legitimately working through: Resource availability ↓ Target compute preparation ↓ Data/replica preparation ↓ Synchronization / workload handling ↓ Switchover Before assuming failure, gather evidence. Check: Operation state Current service objective Requested service objective Start time Last modification time Error details Workload activity Long-running transactions Then determine whether the operation is: Pending Actively progressing Completed or: Failed Troubleshooting Two Databases With Different Scaling Durations Suppose you're investigating: Database A Scale duration: 1h15 Database B Scale duration: 2h15 Here is the approach I recommend. 1. Verify that the changes truly match Compare: Source service tier Target service tier Source vCores Target vCores Compute tier Storage configuration Do not assume both operations were identical simply because both ended at, for example, Business Critical 8 vCores. 2. Compare database characteristics Look at: Database size Workload level Write activity Transaction volume Long-running transactions 3. Compare operation timing Retrieve: Start time State Last modification time Completion time sys.dm_operation_status exposes this operation metadata for Azure SQL database operations. 4. Determine whether either operation spent time pending Remember: PENDING can mean the operation is waiting for resource or quota availability. That represents a very different explanation from: "The database took longer to copy." 5. Check workload around the transition Look for: Large transactions Bulk writes ETL operations Maintenance High transaction rates Long-running transactions particularly around the switchover period. Scaling Duration Is Not an SLA Stopwatch This leads to perhaps the most important takeaway. If: Database A took 75 minutes you should not assume: Database B must take approximately 75 minutes. Even apparently similar scale operations can encounter different database and platform conditions. A better operational expectation is: Treat each scaling operation as an asynchronous platform operation whose duration depends on the work required to safely reach the requested configuration. Monitor the operation rather than predicting its completion from a previous database. Recommended Checklist Before scaling a production Azure SQL Database: Before Review workload activity. Identify long-running transactions or batch processes. Confirm the requested service objective. Ensure application retry logic is implemented. Record the UTC start time. Understand dependent application connection behavior. During Monitor: Get-AzSqlDatabaseActivity Get-AzSqlDatabase sys.dm_operation_status and watch: State CurrentServiceObjectiveName RequestedServiceObjectiveName StartTime LastModifyTime Error information After Confirm: Current service objective = requested target Database status = Online Application connectivity = Healthy Workload performance = Expected Also validate that applications successfully reconnected after the transition. Final Thoughts When Azure SQL Database scaling takes longer than expected, it's easy to think: "Something must be wrong." And when two similar databases take very different amounts of time, it's equally tempting to expect the durations to match. But a scale operation can involve substantially more than changing a vCore number. At a high level: Request scaling ↓ Provision target compute ↓ Prepare/copy database when required ↓ Transition connections ↓ Complete Microsoft's documentation confirms that data copying for applicable scale paths can strongly influence latency, that the switchover can take longer in the presence of long-running transactions, and that a pending operation might be waiting for resource or quota availability. So when someone asks: "Why is Azure SQL scaling taking so long?" my recommendation is not to start by guessing how many minutes it should take. Instead ask: "What state is the operation currently in, and what evidence do we have about its progress?" With Get-AzSqlDatabaseActivity, Get-AzSqlDatabase, and sys.dm_operation_status, you can turn an opaque waiting period into a much more structured investigation. References Scale single database resources in Azure SQL Database Scale resources in Azure SQL Database sys.dm_operation_status Get-AzSqlDatabaseActivity Get-AzSqlDatabase301Views0likes0CommentsAzure SQL Performance Troubleshooting: When High Latency Is Not High CPU
When an application connected to Azure SQL Database becomes slow or starts timing out, one of the first questions is usually: Is the database running out of CPU? It's a reasonable starting point, but CPU is only one part of the performance story. Some Azure SQL performance problems occur while CPU, Data IO, and worker utilization appear healthy. The database may have plenty of compute capacity while queries spend most of their time waiting rather than executing. The key troubleshooting question is therefore not simply: "How much CPU is Azure SQL using?" Instead, ask: "Where is the elapsed time being spent?" Start With Resources, But Don't Stop There Resource utilization should still be the first checkpoint. A simple query using sys.dm_db_resource_stats can help identify whether Azure SQL is approaching CPU, Data IO, Log IO, memory, or worker limits: SELECT DB_NAME() AS database_name, AVG(avg_cpu_percent) AS avg_cpu_percent, MAX(avg_cpu_percent) AS max_cpu_percent, MAX(avg_data_io_percent) AS max_data_io_percent, MAX(avg_log_write_percent) AS max_log_write_percent, MAX(avg_memory_usage_percent) AS max_memory_percent, MAX(max_worker_percent) AS max_worker_percent FROM sys.dm_db_resource_stats; If CPU is consistently near 100%, investigate CPU consumption. If Log IO reaches its limit, investigate transaction-log generation. If workers are exhausted, investigate concurrency. But if none of these resources is saturated, don't conclude that Azure SQL is healthy. Move to wait analysis. Follow the Waits A useful simplified model is: Query elapsed time = CPU execution If a query runs for 10 minutes but uses only 30 seconds of CPU, most of its elapsed time occurred somewhere else. Common wait patterns can point the investigation in different directions: Wait Area to investigate PAGELATCH_* In-memory page contention PAGEIOLATCH_* Storage reads LCK_M_* Blocking WRITELOG Transaction log LOG_RATE_GOVERNOR Log throughput RESOURCE_SEMAPHORE Memory grants ASYNC_NETWORK_IO Client/result consumption The wait type is not automatically the root cause. Think of it as a sign telling you: Look in this direction next. PAGELATCH Does Not Mean Slow Storage One important distinction is: PAGELATCH versus: PAGEIOLATCH Despite their similar names, they represent different problems. PAGEIOLATCH is associated with waiting for data pages involved in physical I/O. PAGELATCH, however, is synchronization around pages that are already in memory. Consider a highly concurrent workload: Hundreds of sessions ↓ Same memory page ↓ Latch contention ↓ Sessions wait ↓ Application CPU may still have available capacity. This is why increasing vCores doesn't necessarily eliminate latch contention. Additional compute provides more workload headroom, but it doesn't automatically remove a serialization point around a hot page. Microsoft's I/O troubleshooting guidance also distinguishes PAGEIOLATCH and other I/O-related waits when diagnosing storage-performance problems. Microsoft Learn: Troubleshoot SQL Server I/O performance Query Frequency Matters Too Another common mistake is focusing only on individually expensive queries. Imagine a query that takes only 20 milliseconds but executes hundreds of thousands of times, often concurrently. Its impact is better thought of as: Workload Impact = Cost per execution × Execution frequency × A small metadata lookup or initialization query can become significant when hundreds of application instances execute it simultaneously. This is where Query Store becomes particularly useful. Query Store preserves query, execution-plan, and runtime history, allowing you to compare executions, duration, CPU, plans, and other performance characteristics over time. Microsoft Learn: Monitor performance using Query Store Instead of asking only: "What's my most expensive query?" also ask: "What changed in the workload?" When Nine Hours of Duration Is Only One Minute of CPU Now consider the opposite problem. Suppose Query Store shows something like: Elapsed time 9 hours SQL CPU time 1 minute Returned rows 750,000+ Dominant wait ASYNC_NETWORK_IO Would adding CPU solve this? Probably not. CPU represents only a tiny fraction of the elapsed time. ASYNC_NETWORK_IO commonly occurs when SQL Server has results available but the client application is not consuming them quickly enough. Microsoft documents several possible causes, including: large result sets; slow application processing; applications fetching rows slowly; network-related delays. Microsoft Learn: Troubleshoot ASYNC_NETWORK_IO Importantly: ASYNC_NETWORK_IO does not automatically mean the network is slow. The bottleneck might actually be the application. Measure Time to First Row A useful troubleshooting technique is to separate database response time from result-consumption time. Instead of measuring only: Query start → Application finished measure: T0 = Query submitted T1 = First row received T2 = Last row received T3 = Application processing completed You can then separate: Database response = T1 - T0 Result consumption = T2 - T1 Application For example: First row received: 2 seconds Last row received: 2 hours Processing completed: 2.5 hours Calling this a "2.5-hour SQL query" would be misleading. SQL started returning results after two seconds. Most of the time was spent transferring or processing them. Don't Forget Blocking Low CPU can also be caused by blocking. If many sessions are waiting behind a transaction, increasing CPU isn't going to solve the problem. During an active incident, check requests and their waits: SELECT r.session_id, r.blocking_session_id, r.status, r.wait_type, r.wait_time, r.wait_resource, r.cpu_time, r.total_elapsed_time, st.text FROM sys.dm_exec_requests AS r CROSS APPLY sys.dm_exec_sql_text(r.sql_handle) AS st WHERE r.blocking_session_id <> 0 ORDER BY r.wait_time DESC; This helps determine whether the application is experiencing a resource problem or simply waiting behind another transaction. Why Scaling Can Be Misleading Imagine this sequence: Application slow ↓ Scale database ↓ Performance improves It's tempting to conclude: "We needed more CPU." But scaling can change more than CPU availability. Depending on the operation and environment, it can alter resource availability or execution conditions. Therefore: A successful mitigation does not automatically prove the root cause. Always distinguish between: What made the symptoms disappear? and: What originally caused the symptoms? A Practical Troubleshooting Workflow When investigating Azure SQL performance, I use the following approach: 1. Define the exact incident window Preferably using UTC timestamps. 2. Check core resources Look at: CPU Data IO Log IO memory workers 3. Compare CPU time with elapsed time If: Elapsed ≈ CPU investigate computational workload. If: Elapsed >>> CPU investigate waits. 4. Identify dominant waits Ask what prevented SQL from continuing execution. 5. Check blocking Determine whether requests are waiting behind other transactions. 6. Use Query Store Compare healthy and problematic periods for: execution count; CPU; duration; logical reads; plans; wait behavior. Microsoft provides Query Store examples specifically for workload and performance investigation. Microsoft Learn: Tune performance with Query Store 7. Inspect the execution plan Look for inefficient access patterns, cardinality problems, excessive reads, repeated lookups, spills, scans, or plan changes. 8. Investigate the application Especially when SQL CPU is low but result-transfer waits are high. Look at: rows returned; fetch size; batch size; application processing; concurrency; downstream dependencies. 9. Compare healthy vs unhealthy periods Don't analyze an incident in isolation. Ask: What changed? Common Misdiagnoses "CPU isn't 100%, so SQL is healthy." Not necessarily. Queries might simply be waiting. "ASYNC_NETWORK_IO means we have a network problem." Not necessarily. The client may be consuming results slowly. "PAGELATCH means storage is slow." No. Don't confuse PAGELATCH with PAGEIOLATCH. "Scaling fixed the problem, so CPU was the root cause." Not necessarily. Mitigation and root cause are different concepts. "The slowest query must be the problem." Not always. A small query executed extremely frequently can generate larger cumulative impact. Final Thought: Follow the Time When Azure SQL becomes slow, avoid jumping directly from: Slow database → Add more vCores Instead, work through: High latency ↓ Resource utilization ↓ CPU vs elapsed time ↓ Wait statistics ↓ Query Store ↓ Execution plan ↓ Application behavior ↓ Root cause ↓ Targeted optimization Performance troubleshooting becomes much easier once you stop asking only: "How busy is Azure SQL?" and start asking: "Where did the time go?" Because sometimes the database isn't busy at all. It's waiting. References Monitor Performance by Using the Query Store Tune performance with the Query Store Troubleshoot slow queries resulting from ASYNC_NETWORK_IO Troubleshoot slow SQL Server performance caused by I/O issues308Views0likes0CommentsLessons Learned #555: The First 60 Seconds of a Production Incident: Stop, Scope, Correlate
When a critical production incident starts, the first message we often receive is something like: “The database is down.” At that moment, everything suddenly becomes urgent. Engineers open monitoring dashboards. Someone starts checking logs. Another person reviews CPU and memory. Someone else asks whether there was a deployment. Connections are tested. Metrics are queried. Teams are contacted. All of these actions may eventually be necessary. But there is a more important question to answer first: What exactly does “down” mean? After working on many production incidents, one lesson becomes increasingly clear: The first 60 seconds are not about solving the incident. They are about defining the incident. A vague problem description can send troubleshooting in many different directions. A precise problem statement dramatically reduces the investigation space. This article describes a simple approach that can be applied during the first moments of an incident: Stop. Scope. Correlate. 1. Stop: Define What “Down” Actually Means The first mistake during many incidents is assuming that everyone understands the problem in the same way. Consider the statement: “The database is unavailable.” That statement could mean many different things: Applications cannot establish new connections. Existing connections are still working, but new connections fail. Queries are timing out. A specific login cannot authenticate. One database is inaccessible. One application is failing while other applications work correctly. Performance degradation makes the service appear unavailable. The application returns HTTP 500 errors, but the database itself is healthy. Connections fail intermittently. A failover is occurring. DNS or networking issues prevent the application from reaching the database. These scenarios require completely different investigation paths. Before opening ten different tools, try to transform the original statement into something more specific. For example: Instead of: “The database is down.” Try to reach something like: “Since approximately 14:32 UTC, new application connections to Database A have intermittently failed with login errors, while existing sessions remain active.” Now we have something we can investigate. The problem statement contains: a timestamp, a specific database, a specific symptom, affected connection behavior, and an indication that the issue may be intermittent. That is already much more valuable than the original alert. 2. Scope: Determine the Blast Radius Once we understand the symptom, the next question is: Who or what is affected? This is sometimes called determining the blast radius. The scope can immediately eliminate entire categories of possible causes. Ask questions such as: Is one user affected or every user? Is one application affected or several applications? Is one database affected or all databases? Are all connection types affected? Are existing connections healthy while new connections fail? Are only specific clients or drivers affected? Imagine the following situation. Application A reports database connectivity failures. However: Application B connects successfully. SSMS connects successfully. Azure metrics show the database is available. Existing sessions continue executing queries. This changes the investigation dramatically. The problem may not be: “Azure SQL is unavailable.” It may instead be: “Application A cannot establish new connections.” That distinction is extremely important. A large percentage of troubleshooting time can be saved simply by identifying the correct scope early. 3. Build the Timeline The next critical dimension is time. During an incident, timestamps are evidence. Ask: When did the issue start? Is there an exact timestamp? How long did it last? Is the issue continuous or intermittent? Did the problem recover automatically? Did the issue occur once or multiple times? Was there another event immediately before the problem? A good incident timeline may look like this: 14:31:52 UTC – Application operating normally 14:32:08 UTC – First connection error reported 14:32:10 UTC – Database failover detected 14:32:14 UTC – Additional login failures 14:32:18 UTC – New connections begin succeeding 14:32:20 UTC – Application fully recovere Now the investigation is no longer based on assumptions. We have a five-to-ten-second window that can be correlated with platform telemetry, database events, application logs, networking information, and deployment history. Without the timeline, engineers may analyze hours of logs. With the timeline, the investigation becomes focused. 4. Correlate Before Changing Anything The next step is correlation. Once we understand the symptom, scope, and timeline, we can ask: What changed at the same time? Useful correlation sources may include: application deployments, infrastructure changes, configuration changes, database failovers, scaling operations, maintenance events, firewall changes, authentication changes, networking events, DNS changes, resource utilization, query regressions, blocking, deadlocks, connection pool behavior, driver updates, platform events. etc The key word here is correlation. It is tempting during an incident to immediately change something. For example: restart the application, restart a service, scale the database, clear the connection pool, change configuration, rebuild an index, modify a query, fail over manually. Sometimes these actions are necessary. But every change also modifies the evidence. A restart may restore the service while simultaneously removing valuable diagnostic information. Whenever possible: Collect evidence before changing the environment. 5. Use Multiple Sources of Evidence Production incidents rarely provide the complete answer in one telemetry source. A better approach is to correlate multiple sources. For a database-related incident, we may investigate: Application telemetry Application logs may reveal: connection failures, authentication errors, request latency, retry attempts, timeout exceptions, HTTP errors, dependency failures. Platform metrics Cloud metrics may help determine: service availability, CPU utilization, storage pressure, connection count, throttling, resource saturation. Database telemetry Database-level information may include: active sessions, waits, blocking, query performance, login failures, failover events, resource statistics. Query Store For performance incidents, Query Store can be extremely valuable. It may help identify: query regressions, plan changes, increased execution duration, abnormal CPU consumption, changes in execution frequency. Deployment history Always ask: What changed recently? Many incidents have a strong temporal relationship with: application deployments, schema changes, configuration modifications, infrastructure updates, new releases, security changes. The goal is not to assume that the most recent change caused the incident. The goal is to determine whether the events correlate. 6. Avoid Starting With a Tool One common troubleshooting pattern is: “Open the monitoring portal.” or: “Run this query.” or: “Check this log.” Tools are essential, but tools should follow the investigation strategy. The investigation should determine which tool we need. Not the other way around. If the problem is authentication, the investigation path may focus on: login errors, authentication configuration, identity providers, user mappings, connection strings. If the problem is performance, the investigation may focus on: Query Store, waits, blocking, execution plans, resource utilization. If the problem is connectivity, we may investigate: DNS, network paths, firewalls, drivers, retries, connection pools. A clear problem definition tells us where to look. 7. Ask the Same Questions Every Time One of the most effective improvements teams can make is standardizing the first questions asked during incidents. A simple initial checklist could be: Symptom: What exactly is failing? Scope: Who or what is affected? Timeline: When did it start? Error: What exact error message or error code is being returned? Frequency: Is the issue continuous, intermittent, or already recovered? Changes: What changed immediately before the incident? Evidence : Which telemetry sources can confirm the behavior? These questions are intentionally simple. During a high-severity incident, simplicity is valuable. 8. The First 60 Seconds Framework We can summarize the approach in four steps. 1. Define: What does the reported symptom actually mean? 2. Scope: Determine the blast radius. 3. Timeline: Identify exactly when the problem occurred. 4. Correlate Connect the symptom with telemetry, events, and recent changes. Only after these steps should we decide the deeper troubleshooting path. 9. Speed Is Important, but Direction Is More Important During critical incidents, teams naturally want to move quickly. That is the correct instinct. But speed without direction can create noise. Ten engineers investigating ten different theories at the same time may generate enormous activity without producing clarity. A well-defined incident allows teams to divide the investigation intelligently. For example: One engineer investigates application telemetry. Another checks database telemetry. Another reviews platform events. Another investigates recent deployments. Another builds the incident timeline. All of them are now investigating the same defined problem. That is very different from everyone independently trying to determine what the problem might be.Lessons Learned #551: Azure SQL Connection Timeouts: Three Things to Check
An application starts reporting intermittent timeouts when connecting to Azure SQL Database. Some requests succeed, others fail, and a test from a developer’s laptop works perfectly. The database appears online, no recent deployment seems related, and the natural reaction is to ask: Is Azure SQL unavailable? Is the firewall blocking the connection? Should we increase the connection timeout? Should we change the driver or scale the database? Those are reasonable questions, but they may lead the investigation in the wrong direction. The most important lesson is simple: A timeout tells us how long the application waited. It does not tell us what the application was waiting for. Not every “SQL timeout” happens inside Azure SQL From the application’s point of view, opening a database connection may involve several operations: Resolving the server name. Reaching the SQL endpoint. Obtaining a Microsoft Entra access token. Waiting for an available pooled connection. Completing the SQL login. Executing the first command. When all these operations are reported through the same application method or log entry, it can look as though Azure SQL took thirty seconds to accept the connection. In reality, only part of that time may have been spent connecting to the database. In one anonymized support scenario, the application experienced problems mainly on its first connection. Network tests were successful and no corresponding SQL connection failure was identified. The investigation eventually showed that access-token acquisition was consuming a significant part of the available time. Increasing the SQL timeout or changing the firewall would not have addressed the real delay. Check 1: Capture the complete error and the exact time A screenshot containing only “Connection Timeout Expired” is rarely enough. Capture: The complete exception and inner exception. The operation being performed. The driver and version. The authentication method. The exact timestamp in UTC. Whether the issue affects every connection or only some of them. The wording around the timeout matters. For example, a timeout while obtaining a connection from the pool points toward the application’s pooling and concurrency behavior. A pre-login or TLS error belongs to a different investigation. A command timeout after the connection was established is usually a query-performance problem rather than a connection problem. Check 2: Measure the application timeline The application should record important operations separately. A simple timeline can completely change the investigation: 10:14:20.100 Token acquisition started 10:14:28.400 Token acquired 10:14:28.405 SQL connection started 10:14:29.050 SQL connection established The complete operation took almost nine seconds, but Azure SQL connection establishment took less than one second. Useful measurements include: Token-acquisition duration. Time waiting for a pooled connection. SQL connection-open duration. SQL command duration. Number of retry attempts. Applications using Microsoft Entra authentication must obtain an access token before authenticating to Azure SQL. Measuring that operation separately helps distinguish an identity delay from a database connectivity problem. This is particularly useful when the issue appears: On the first connection after startup. After a token expires. Only with Managed Identity or Workload Identity. Intermittently, while SQL authentication connections remain unaffected. Check 3: Test from the application environment A successful connection from a laptop does not validate the path used by an application running in: Azure App Service. Azure Functions. Azure Kubernetes Service. A virtual machine. An on-premises application server. A container or integration runtime. The laptop and the application may use different DNS servers, routes, firewalls, proxies and identities. Connectivity and DNS tests should therefore be performed from the environment that is actually failing. This becomes especially important when Private Endpoint is used. The application should continue connecting with: <server>.database.windows.net It should not use the Private Endpoint IP address or the privatelink.database.windows.net hostname directly. Direct login attempts using the private IP or the private-link FQDN fail; the normal logical-server FQDN must remain in the connection string. From the affected environment, confirm that: The expected DNS server answers the request. The server FQDN resolves to the expected private IP. The Private Endpoint connection is approved. The Private DNS zone is linked correctly. The resolved address is reachable through the intended route. A test from an unrelated machine is still useful for comparison, but it does not prove that the application path is healthy. Observed symptom Likely investigation area Timeout while obtaining a connection from the pool Application connection pooling Server name cannot be resolved DNS TCP connection to the endpoint cannot be established Network path, firewall or routing Error during the pre-login handshake TLS, driver, network interruption or pre-login processing Authentication or access-token error Microsoft Entra authentication, identity or token acquisition Timeout during the post-login phase Login completion, session initialization or server-side processing Execution or command timeout after connecting Query execution and database performance Avoid changing several things at once During a production incident, it is tempting to: Increase the timeout. Add firewall rules. Change the connection policy. Upgrade the driver. Restart the application. Clear connection pools. Applying several changes together makes it difficult to determine which one helped, and some may only hide the symptom. A better approach is to define one hypothesis: We believe DNS in the application environment is resolving the public endpoint instead of the Private Endpoint. Then define: The evidence supporting the hypothesis. One controlled change. The expected result. How the result will be measured. How the change will be reverted. Azure SQL supports Proxy and Redirect connection policies, which determine how traffic flows after reaching the Azure SQL gateway. The policy is configured for the logical server, so it should be verified before making firewall assumptions or changes. What should we collect before opening a support request? A small but precise evidence package can avoid several rounds of questions: Complete error and inner exception. Exact UTC timestamps. Application platform and location. Public or Private Endpoint. Server FQDN used by the application. Driver and version. Authentication method. Token, pool, connection and command durations. DNS result from the affected environment. Whether the issue is constant, intermittent or limited to the first connection. Recent application, network, identity or configuration changes.559Views0likes0CommentsAzure SQL DB Fabric Mirroring with Private Endpoint
Introduction Overview steps for configuration of Mirroring between Azure SQL Database to Fabric Mirrored Database over Private Endpoint and Public Connectivity Disabled on source. Prerequisites #1 - The minimum requirement for the source Azure SQL Database tier is - it is Standard Tier with DTUs equal or greater than 100. Free, Basic Tier, or <100 DTUs are NOT supported. All vCore model tiers supported. #2 - System Assigned Managed Identity (SAMI) must be enabled on the Azure SQL logical server. #3 - Microsoft.PowerPlatform should be registered as a source provider at the subscription level. If this step is not completed, you'll face error in the next steps, while creating the 'Virtual Network Data Gateway', example below. #4 - The Virtual Network Subnet of the configured Private Endpoint should have the following selected. Select Microsoft.PowerPlatform/netaccesslinks for the Subnet Delegation tab. This is a required step, otherwise the subnet is grayed out to select while configuration of the Virtual Network Data Gateway at Fabric level. High Level Configuration Steps #1 - Go to Fabric Portal > Settings Click on Settings button on top right > Click on Manage Connections and Gateways Go to 'Virtual Network Data Gateway' tab > Click New In the new page, Select your Capacity, Subscription, Resource Group, VNET and Subnet of the source Azure SQL DB and create it. #2 - Go back to your workspace, and click new item > Search 'Mirrored Azure SQL Database' #3 - Here, in Data Gateway section, chose your new created gateway which we created in previous step, and fill the required source Azure SQL Database details and click connect. #4 - Select the tables to be mirrored in the next steps and you will be able to successfully mirror from Azure SQL Database to Mirrored Azure SQL Database without Public Connectivity and using Private Endpoint.477Views1like0CommentsConnect to Azure SQL Database using a custom domain name with Microsoft Entra ID authentication
Many of us might prefer to connect to Azure SQL Server using a custom domain name (like devsqlserver.mycompany.com) rather than the default fully qualified domain name (devsqlserver.database.windows.net), often because of application-specific or compliance reasons. This article details how you can accomplish this when logging in with Microsoft Entra ID (for example, user@mycompany.com) in Azure SQL Database specific environment. Frequently, users encounter errors similar to the one described below during this process. Before you start: If you use SQL authentication (SQL username/password), the steps are different. Refer the following article for that scenario: How to use different domain name to connect to Azure SQL DB Server | Microsoft Community Hub With SQL authentication, you can include the server name in the login (for example, username@servername). With Microsoft Entra ID authentication, you don’t do that—so your custom DNS name must follow one important rule. Key requirement for Microsoft Entra ID authentication In an Azure SQL Database (PaaS) environment, the platform relies on the server name portion of the Fully Qualified Domain Name (FQDN) to correctly route incoming connection requests to the appropriate logical server. When you use a custom DNS name, it is important that the name starts with the exact Azure SQL server name (the part before .database.windows.net). Why this is required: Azure SQL Database is a multi-tenant PaaS service, where multiple logical servers are hosted behind shared infrastructure. During the connection process (especially with Microsoft Entra ID authentication), Azure SQL uses the server name extracted from the FQDN to: Identify the correct logical server Route the connection internally within the platform Validate the authentication context This behavior aligns with how Azure SQL endpoints are designed and resolved within Microsoft’s managed infrastructure. If your custom DNS name doesn’t start with the Azure SQL server name, Azure can’t route the connection to the correct server. Sign-in may fail and you might see error 40532 (as shown above). To fix this, change the custom DNS name so it starts with your Azure SQL server name. Example: if your server is devsqlserver.database.windows.net, your custom name must start with 'devsqlserver' devsqlserver.mycompany.com devsqlserver.contoso.com devsqlserver.mydomain.com Step-by-step: set up and connect Pick the custom name. It must start with your server name. Example: use devsqlserver.mycompany.com (not othername.mycompany.com). Create DNS records for the custom name. Create a CNAME or DNS alias to point the custom name to your Azure SQL server endpoint (public) or to the private endpoint IP (private) as per the blog mentioned above. Check DNS from your computer. Make sure devsqlserver.mycompany.com resolves to the right address before you try to connect. Connect with Microsoft Entra ID. In SSMS/Azure Data Studio, set Server to your custom server name and select a Microsoft Entra ID authentication option (for example, Universal with MFA). Sign in and connect. Use your Entra ID (for example, user@mycompany.com). Example: Also, when you connect to Azure SQL Database using a custom domain name, you might see the following error: “The target principal name is incorrect” Example: This happens because Azure SQL’s SSL/TLS certificate is issued for the default server name (for example, servername.database.windows.net), not for your custom DNS name. During the secure connection process, the client validates that the server name you are connecting to matches the name in the certificate. Since the custom domain does not match the certificate, this validation fails, resulting in the error. This is expected behavior and is part of standard security checks to prevent connecting to an untrusted or impersonated server. To proceed with the connection, you can configure the client to trust the server certificate by: Setting Trust Server Certificate = True in the client settings, or Adding TrustServerCertificate=True in the connection string This bypasses the strict name validation and allows the connection to succeed. Note: Please use the latest client drivers (ODBC/JDBC/.NET, etc.). In some old driver versions, the 'TrustServerCertificate' setting may not work properly, and you may still face connection issues with the same 'target principal name is incorrect' error. So, it is always better to keep drivers updated for smooth connectivity with Azure SQL. Applies to both public and private endpoints: This naming requirement and approach work whether you connect over the public endpoint or through a private endpoint for Azure SQL Database scenario, as long as DNS resolution for the custom name is set up correctly for your network.897Views4likes1Comment
Why do I see many VDI_CLIENT_WORKER sessions in Azure SQL Database — and do they impact performance?
Sometimes you’ll notice many sessions showing the command VDI_CLIENT_WORKER in Azure SQL Database—often around scaling, replica/copy workflows, or internal seeding operations. These sessions can look alarming, especially during a performance investigation, but they are typically internal background workers. This post explains how to recognize them, what’s safe to do (and what isn’t), and how to focus on the real bottlenecks like blocking/deadlocks or log rate throttling when you’re troubleshooting slowness. Why you might see VDI_CLIENT_WORKER sessions in Azure SQL Database The symptom You run a session query (for example, using sys.dm_exec_requests or a monitoring tool) and observe: Many sessions with command text VDI_CLIENT_WORKER They may appear to be “stuck,” persist longer than expected, and can’t be killed Teams may worry these sessions are “the cause” of slowness Why it shows up in Azure SQL In Azure SQL, VDI_CLIENT_* wait types and VDI_CLIENT_WORKER sessions are commonly associated with platform operations that involve copying/seeding—for example: Scaling operations (service objective changes) Geo-replication / copy workflows Replica seeding-like behaviors Important: The presence of these sessions does not automatically mean they are the bottleneck. How to validate whether VDI_CLIENT_WORKER is benign? 1) Correlate to recent platform operations. Ask: did you recently perform (or did the platform perform) one of these? Scale up/down. Creation of replicas / geo-secondary operations. Any database copy-like workflow. If yes, it’s a strong indicator you’re seeing background workers tied to that lifecycle event. 2) Check whether they consume resources. A practical approach: Look for CPU/IO/log pressure at the database level. Compare the timing of slowness reports with spikes in waits/locks/log write percentage. If these sessions show minimal resource consumption and are just “present,” treat them as background noise while you investigate real contention. 3) Don’t try to kill them! These sessions are typically system/internal. Attempts to kill them may fail or be ineffective—and generally aren’t recommended. 4) If you need them to disappear. In many cases, these internal workers naturally age out. If they remain visible and you need a cleanup path, operational actions like failover/restart may clear stale workers (use change control / maintenance windows as appropriate for your environment). (This is a practical operational observation; always weigh downtime/impact.) When performance is actually slow: focus on what usually hurts. In many real-world incidents, the main causes of slowness are: Blocking chains / deadlocks. Transaction log rate throttling (LOG_RATE_GOVERNOR) during heavy DML. Hot queries running concurrently and contending on the same objects. Key takeaways Seeing many VDI_CLIENT_WORKER sessions is often expected around platform copy/seeding workflows and doesn’t automatically indicate a bottleneck. Don’t attempt to kill system/internal workers; instead, validate resource impact and focus on actual bottlenecks. For real slowness, prioritize diagnosing blocking/deadlocks and LOG_RATE_GOVERNOR-driven DML throttling.189Views0likes0Comments