azure kubernetes service
208 TopicsAnyscale on Azure is now Generally Available
Anyscale on Azure is now Generally Available. Enterprises can run the Ray distributed runtime as a managed service on Azure Kubernetes Service (AKS), with workloads running in the customer’s own Azure subscription, network, and identity boundary. With General Availability, Anyscale on Azure is ready for production workloads and comes with the commitments enterprises need. It is backed by a service level agreement and production support from both Microsoft and Anyscale. Customer workloads, datasets, and model artifacts run in their Azure subscription, while Anyscale operates the control plane in its own Azure tenant. Customers can use their Azure identity and governance controls for the resources in their subscription. Xoople is already using Anyscale on Azure to turn planetary-scale satellite imagery into decision-ready intelligence. AI systems need more than a good model Model quality is only part of the challenge. Enterprises must also connect, secure, and operate the stages around the model. A typical stack assembles one tool for data preparation, another for distributed training, a third for evaluation, and a fourth for serving. Each tool solves part of the problem. Connecting them can require custom integration code, separately provisioned compute, and security controls that teams must maintain across systems. The resulting challenges fall into four areas: Utilization: GPUs provisioned per stage can sit idle while another stage waits for capacity. Reserved capacity that is idle is still billed. Security and governance: Teams must manage who can access data and models, where they are processed, and how security controls are configured across each system and handoff. Engineering time: Integration code requires ongoing maintenance, monitoring, and troubleshooting alongside the tools themselves. Development cycle time: Handoffs between stages can slow the path from experimentation to production. Anyscale on Azure addresses this fragmentation by bringing data preparation, training, evaluation, and inference into a common runtime and operational model. Shared infrastructure can reduce idle compute capacity, while managed Ray cluster lifecycles reduce the infrastructure work teams perform themselves. Workloads, datasets, and model artifacts remain in the customer’s Azure subscription, where teams configure access and networking controls. Using a common runtime across stages can also reduce the need to maintain separate compute stacks. The goal is to support an AI learning loop, not just inference: production feedback informs data curation, training or post-training, and evaluation before updated models return to serving. Anyscale provides the common compute platform; teams remain responsible for their models, evaluation criteria, application workflows, and security configuration. How Anyscale on Azure works Anyscale on Azure is an Azure Native Integration with an Anyscale-operated control plane and a customer data plane that keeps core resources in the customer’s Azure tenant, helping teams maintain their security and data-residency requirements. Anyscale hosts and operates the control plane in Azure. You reach it from the Azure Portal, the Anyscale console, or the Anyscale CLI and SDK. The data plane runs entirely inside your own Azure subscription: Anyscale deploys an operator into your AKS cluster, which manages Ray cluster lifecycles on your behalf. This keeps Ray workloads, datasets, and model artifacts in your Azure subscription, while the Anyscale-hosted control plane processes operational metadata. Workloads run on AKS within your virtual network and use your existing Microsoft Entra ID, Azure RBAC, and private networking controls. The Anyscale operator and Ray clusters initiate outbound connections to the Anyscale control plane, so Anyscale does not require inbound firewall access to AKS nodes for those connections. Anyscale on Azure integrates with Azure Managed Identities for authentication, Azure Blob Storage and ADLS for data, Azure Key Vault for secrets, and Azure Container Registry for images. Use familiar Azure identity and resource controls Anyscale on Azure is backed by Azure Resource Manager, allowing platform teams to apply Azure Policy and discover Anyscale resources through Azure Resource Graph, just as they do with other Azure resources. Control How it works on Anyscale on Azure Provisioning A guided Azure Portal flow provisions storage, managed identity, container registry, and service account, then installs the Anyscale operator. ARM templates and Terraform are supported. Identity Sign-in runs through Microsoft Entra SSO. Conditional Access policies that govern Azure portal sign-in govern Anyscale sign-in too. Authorization Azure RBAC against your existing role assignments, with three built-in Anyscale roles as a starting point. Policy Platform teams can apply Azure Policy to supported Azure resource types. Validate policy coverage for the Anyscale resource and its underlying infrastructure. Private connectivity Connect the Anyscale operator and Ray clusters on AKS to Anyscale control plane through a private endpoint in the customer’s virtual network. Outbound traffic travels over the Microsoft backbone rather than the public internet. Cost visibility Usage appears in Microsoft Cost Management and on the same Azure invoice, drawing down against MACC. Data boundary Ray workloads run on AKS, with datasets and model artifacts in your subscription; operational metadata is managed separately. For regulated industries such as financial services, healthcare, and public sector, Anyscale on Azure makes in-tenant AI attainable. In production: Xoople Xoople is building what it calls Earth's system of record, a continuously updated and AI-ready picture of how the planet's surface is changing. The workload is a useful illustration of why a unified runtime matters. Turning raw spectral data from satellite constellations into decision-ready measurements is not primarily a model problem. It is continuous, large-scale, heterogeneous computation: ingest and reprojection, calibration, feature extraction, model training, and inference, each at a different shape and each needing different hardware. With Anyscale on Azure, Xoople can reliably run massively distributed AI workloads over planetary-scale satellite imagery, transforming complex spectral data into decision-ready intelligence. Anyscale lets our teams focus on models and outcomes rather than infrastructure, dramatically accelerating the path from experimentation to deployment. — Milos Colic, VP of Engineering, Xoople Workloads teams run on Anyscale on Azure Workload What it's used for Why it fits a unified runtime Multimodal data preparation Curating and preparing image, video, text, and sensor datasets for training CPU decoding and GPU model-based processing run in one pipeline, with no handoff between systems Distributed training and fine-tuning Scaling distributed training across available GPU capacity Checkpointing and, when using Ray Data for data loading, mid-epoch resume can reduce repeated work after interruptions Composite AI serving Deploying and orchestrating multi-model AI applications in production Ray Serve runs multiple models and steps as a single service Embedding generation Producing embeddings at scale for search and retrieval CPU preprocessing and GPU inference share one cluster and one scheduler Reinforcement learning for LLMs Coordinating parallel reinforcement-learning post-training workloads Rollouts, reward scoring, and training are coordinated in one Ray program Physical AI simulation Running thousands of concurrent simulation environments Ray schedules large numbers of parallel simulations alongside training One runtime for the entire AI lifecycle One Ray runtime supports data preparation, training and fine-tuning, batch and online inference, and long-running agentic workloads. When each stage has its own compute, capacity reserved for one can sit idle while another waits. A shared scheduler reallocates compute as demand shifts, which can reduce idle capacity and lower infrastructure costs. Model choice also matters. Fine-tuned, task-specific models can cut serving costs when they meet quality requirements, so weigh total cost, not inference alone. The Anyscale Runtime supports Ray APIs, so existing Ray code needs fewer changes to move over. Customers should validate dependencies, data access, networking, and deployment configuration. Get started Anyscale on Azure is provisioned from the Azure Portal onto an AKS cluster in your own subscription. You manage and monitor deployments from Portal, and use the Anyscale console, CLI, and SDK for cluster-level work. Review the Anyscale on Azure overview on Microsoft Learn for architecture and prerequisites. Check regional availability against where your data resides. Create an Anyscale cloud on an existing AKS cluster from the Azure Portal, then configure managed identities for access to Blob Storage, Key Vault, and Container Registry. Move an existing Ray workload using compatible Ray APIs, after validating dependencies and deployment configuration, or start from the Anyscale on Azure quickstart. Check current Azure pricing and offer eligibility before assuming free-account credits apply to Anyscale on Azure usage. Resources Anyscale on Azure architecture and overview Anyscale on Azure pricing Anyscale on Azure solution page Anyscale on AKS Terraform reference deployment Anyscale on Azure public preview announcement Anyscale on Azure press release, June 2, 2026 Announcing Anyscale Runtime Ray on AKS overview761Views0likes0CommentsVirtual nodes on Azure Container Instances: a new compute layer for AKS
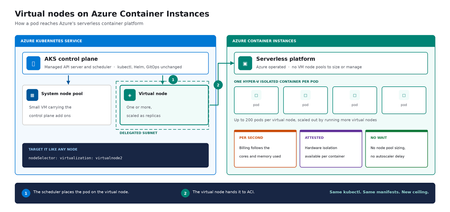
Meet virtual nodes on ACI Azure Kubernetes Service (AKS) gives you managed Kubernetes: the full Kubernetes API without operating the control plane yourself. Virtual nodes on Azure Container Instances go a step further, letting your pods run directly on Azure's serverless container platform, with the elasticity and with no capacity planning and no waiting for machines. Whether you already run AKS or want a managed Kubernetes that bursts without node management, this is for you. In short: virtual nodes on ACI attach Azure's serverless container platform to your cluster as Kubernetes nodes. Pods run as Hyper-V isolated containers, sized per pod rather than packed onto a fixed VM, up to 200 pods per virtual node. Run multiple virtual nodes, scaled as replicas, for more. They behave like any other pod: same kubectl, Helm, and GitOps. Kubernetes has always assumed a fixed set of machines underneath it. That assumption shapes everything above it: you size a node pool for a specific VM type in a specific region, you plan for peak rather than for average, and every workload on a node shares the same kernel and the same security boundary. Virtual nodes on ACI relaxs that assumption, which is what makes both elastic capacity and per container isolation possible without a different Kubernetes. If you've used the original AKS virtual nodes add-on (Virtual Kubelet based), this is not a rebrand. It is a new implementation that integrates far more deeply with Kubernetes, lifts most prior limitations (init containers, persistent volumes, managed identity, richer networking), and adds confidential containers as a first-class capability. The migration guide can be found here. Two capabilities carry the rest of this post: effortless burst capacity, and confidential containers. How virtual nodes on ACI work ACI runs every container as a Hyper-V isolated container, which means each one gets its own lightweight virtual machine boundary rather than sharing a kernel with its neighbors. Azure operates that platform. A virtual node connects it to your cluster. The cluster's control plane, the component that decides where each container runs, sees two kinds of destination: a small pool of virtual machines carrying cluster services, and one or more virtual nodes. From the application manifest's perspective, nothing changes. The pod lands on a virtual node; the virtual node hands it off to ACI. See Microsoft Learn: virtual nodes on ACI for the official capability and current limits. Virtual nodes on ACI in practice The rest of this post is hands on. You do not need to be a Kubernetes expert to follow it. kubectl is the command line tool for talking to a cluster, Helm installs packaged software into one, and a manifest is a text file describing what you want to run. If you have a cluster, everything below runs against it as written. The manifests behind the examples live in a companion demo repo. Setup is documented officially, and you can reproduce this end to end from the ACI virtual nodes documentation and the microsoft/virtualnodesOnAzureContainerInstances Helm repo. One requirement before you start: deploy into a delegated ACI subnet, meaning a subnet in your virtual network set aside for the ACI platform to place containers in. Size it for peak pod count plus headroom, since every pod consumes an address from it for its lifetime. Demo manifest files can be found in this repo, a personal sample repo provided as is and not a supported Microsoft artifact. Enable virtual nodes on ACI The virtual node is deployed via Helm. The Microsoft GitHub repo is itself a Helm repository, so a single helm install is all you strictly need. Cloning first, shown here, just makes it easier to customize values. Running kubectl get nodes afterward confirms the node registered. git clone https://github.com/microsoft/virtualnodesOnAzureContainerInstances.git helm install <yourReleaseName> ./virtualnodesOnAzureContainerInstances/Helm/virtualnode kubectl get nodes The virtual node appears alongside any existing capacity, ready to accept work. A virtual node is a Kubernetes node You target it the same way you would target any node. These few lines in a manifest say "run this on the virtual node": nodeSelector: virtualization: virtualnode2 kubernetes.io/os: linux tolerations: - key: virtual-kubelet.io/provider operator: Exists effect: NoSchedule That is the entire integration surface. No new API to learn, no separate deployment pipeline, no application changes. kubectl describe, kubectl logs, and kubectl exec, the standard commands for inspecting and troubleshooting, all work as they would anywhere else, including opening a shell inside a container running in a Hyper-V isolated boundary. Scaling stays trivial. kubectl scale deployment demo-deployment --replicas=10 lands every replica on the same virtual node, with no VMSS scale event, no provisioning latency, no climbing node-count chart. The same flow scales just as cleanly to hundreds. Cost follows the same shape. Each pod is billed per second against the cores and memory it requests, at ACI rates, and billing stops when the pod stops. Logs and metrics flow through the same path you already use, so existing dashboards and alerts keep working. One annotation makes a pod confidential Turning a regular container into a confidential one takes a single addition to its manifest: a policy that pins exactly which images, commands, environment variables, mounts, and capabilities are permitted inside the Trusted Execution Environment. The format is a base64 encoded Rego document, called a CCE (Container Confidential Enforcement) policy. You do not write that policy by hand. A tool generates it from the manifest you already have: az extension add -n confcom az confcom acipolicygen --virtual-node-yaml ./hello-world-deployment.yaml The tool pulls each image, hashes its layers, builds the allow-list, and injects the annotation back into the manifest. kubectl apply, and you're done. (acipolicygen has prerequisites of its own, including a working Docker installation; see the confcom documentation.) Here is why this is a genuinely new isolation primitive rather than a stronger version of an existing one. Most container security policy is enforced by software in the cluster, which means an attacker who compromises the host can potentially bypass it. This policy is enforced by the guest operating system inside the TEE instead. The underlying hardware, AMD SEV-SNP, also produces an attestation report, retrievable from inside the container, which is a cryptographic proof that the workload running is the workload you specified and nothing tampered with it. That is the guarantee regulated industries have been asking for, and increasingly the one AI workloads running untrusted code need too. The same per pod boundary is also what makes multi-tenancy on a single cluster realistic, though multi-tenancy in production still depends on your network and identity boundaries, which sit outside what the isolation layer itself provides. Background: Microsoft Learn: confidential containers on ACI. Wrapping up Virtual nodes on ACI give containers on Azure two things that were previously hard to deliver cleanly on Kubernetes: Effortless burst capacity on Azure's serverless container platform, billed per second for the cores and memory used, with no capacity planning and no waiting for machines. Confidential containers with hardware attested, per container isolation inside a Trusted Execution Environment. Virtual nodes are additive, not a replacement. Traditional node pools remain the right home for steady state, DaemonSet, and persistent volume workloads, and AKS features such as Node Auto Provisioning and Virtual Machine Node Pools already make that baseline more flexible. Virtual nodes on ACI absorb the spikes, the short-lived jobs, and the specialized isolation work on top. Where to start New to containers on Azure? Start with a small AKS cluster and add a virtual node from day one. You get a managed Kubernetes environment without having to guess your peak capacity in advance, and the elastic layer is there the first time you need it. Already running AKS? Add a virtual node to an existing cluster and move one bursty or short lived workload to it. Nothing else changes, and the comparison is immediate. Evaluating platforms? The capability that is hard to find elsewhere is the confidential containers path: hardware attested isolation per container, reachable through a standard Kubernetes manifest. The result: virtual nodes on ACI expand what AKS can run, with more capacity and stronger isolation, without changing the Kubernetes operating model you already use. Same kubectl, same manifests, same GitOps. New ceiling. For the high-level overview, official documentation, and Helm details, the Microsoft Learn is the source of truth. The companion repo holds the demo manifests used in this post. Acknowledgements I'd like to thank Gurpreet Virdi, Partner Group Engineering Manager, whose guidance shaped this post from the first outline through to publication. Her product leadership ensured this post reflects both the technical depth and the customer value of virtual nodes on ACI. Thanks to Gabriel Fuhrman, Senior Software Engineer, for his detailed technical review. His feedback refined the technical content and significantly improved the accuracy and depth of this post. Christopher Little, Principal CSA, shaped the enterprise adoption perspective, and Adam Sharif, CSA, reviewed the post from the earliest draft. Thanks also to Kirthi Maguluri, Senior Product Manager, and Varun Shandilya, Principal Product Manager, for their review of the blog.717Views1like0CommentsAzure Copilot announces general availability of the Troubleshooting Agent
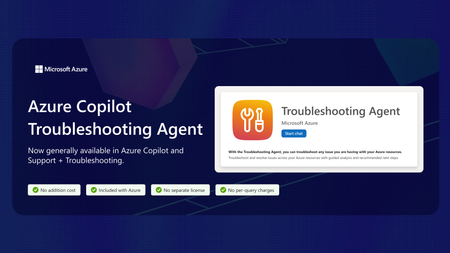
Cloud operations are most effective when teams can turn insights into understanding and understanding into action. Whether you’re deploying new services, troubleshooting an issue, assessing resource health, or managing change, you need operational intelligence that helps you make faster, more informed decisions and continuously improve your environment. This is the promise of agentic cloud operations, a new operating model that uses AI powered agents equipped with deep contextual understanding and built in governance to help you run your cloud environments with speed and confidence. Azure Copilot brings AI-powered operations directly into Azure, helping you understand your environment, identify issues, determine likely causes and take informed action using the context already available in your Azure resources and services. Today, Azure Copilot is announcing the general availability of Troubleshooting Agent, a unified, built-in Azure Copilot capability that helps customers investigate and resolve operational issues faster. Available through both Azure Copilot and Support + Troubleshooting in the Azure portal, Troubleshooting Agent enables you to move from issue detection to resolution faster by bringing together troubleshooting insights, operational context, and recommended actions in a single experience. Deep expertise across Azure services Azure services support a wide variety of architectures, operational patterns, and workload requirements. While Azure Copilot provides consistent agentic troubleshooting across Azure, deeper service integrations enable specialized expertise and investigative capabilities for specific services. At general availability, Azure Compute and Azure Kubernetes Service (AKS) are the first services to offer these enhanced troubleshooting experiences. Azure Compute: You can investigate issues such as unexpected virtual machine restarts, connectivity and boot failures, high resource utilization, deployment and allocation failures, and unhealthy scale set instances. AKS: You can investigate issues such as pod restarts, stalled deployments, scheduling constraints, cluster networking, scaling behavior, upgrade regressions, and degraded performance. “This [Troubleshooting Agent] is really helpful for the person who is debugging, and they can come to a conclusion. Instead of going through the entire documentation, it is giving us the exact information on what it needs and what to look on.” – Senior Software Engineer, Lavelle Networks As the agentic troubleshooting capabilities of Azure Copilot continue to evolve, additional service specific skills and capabilities will be added to support a broader range of operational scenarios across Azure services through the same conversational experience. Grounded in Azure context, with customers in control Azure Copilot Troubleshooting Agent uses the resource information and supported diagnostics available for the affected resource while respecting your identity and Azure role based access control (RBAC). The agent explains the information behind its findings and recommends actions for review, allowing you to remain in control of remediation actions. Diagnostic depth varies by service, resource type, and scenario, but the goal remains consistent: helping you investigate, diagnose, and resolve operational issues more effectively using the context already available within your Azure environment. When additional assistance is needed, Azure Support remains available, but you can begin those engagements with a richer understanding of the issue, its likely causes, and potential remediation options. Available at no additional cost Troubleshooting Agent in Azure Copilot is available at no additional cost. There is no separate license or per-query charge, and existing Azure Support plans remain unchanged. Standard charges for the Azure resources continue to apply. Get started Open Azure Copilot and select Troubleshooting Agent in the Azure portal or go to Support + Troubleshooting, then describe the issue you are experiencing. Include the affected resource or subscription if it is not already clear from your current context. To get started, here are some prompt suggestions: "Why did my virtual machine restart unexpectedly?", "Investigate why my AKS deployment is failing.", "Why can't I connect to this resource?", "What recent platform issues have affected this resource?", "Check whether this resource has active errors or configuration issues." Troubleshooting Agent will use the supported resource diagnostics available for the investigation, explain what it finds, and recommend next steps. Looking ahead Connected cloud environments need a more intelligent approach to operations. As part of our broader vision for agentic cloud operations, Azure Copilot is your starting point when you need to understand, troubleshoot, and take action across your Azure environment. Troubleshooting Agent is an important step in that journey. Based on available context and diagnostics, we help you move from symptoms to informed next steps faster.4.8KViews2likes1CommentHow Azure uses AI to turn feedback into improved customer experience
Authors: eshaanbhattad, jenniferjhan, lakshminarasimha, bharadwajr The Challenge: Synthesizing fragmented feedback signals, to improve Azure's experience quality at scale Customers experience products and services end to end, but product experiences are often structured around individual service. One team may only know its top issues, while another may see only its own slice of experience. That structure makes it difficult to identify cross-cutting friction across the broader product experience. The feedback signals themselves are also fragmented. Customers share feedback through in-product surveys, support cases, field conversations, and social channels. Most product teams can see only part of that picture, making it hard to distinguish isolated comments from meaningful trends, understand which issues were having the greatest impact, and avoid missing critical feedback. For the Azure team, the challenges of fragmentation were amplified by scale. The team processed roughly 10,000 to 15,000 customer feedback reports each month, and synthesizing that feedback required 80 to 100 hours of expert analysis. Additional effort was needed to translate findings into consistent engineering work items. As feedback volume grew, manual analysis became increasingly unsustainable creating delays in identifying and addressing customer priorities. Compounding the challenge was the absence of an effective feedback loop to measure the impact of quality improvements. Teams struggled to justify investments in quality over new features because the return on those investments was difficult to quantify. The absence of a closed-loop measurement system made it difficult to consistently assess the customer impact of quality improvements. The team needed a system that could operate across organizational boundaries and across the product development lifecycle: Identify the most critical customer issues across fragmented feedback channels and product areas. Convert those insights into actionable engineering work, help teams address issues effectively, and measure outcomes to close the loop. The solution needed to preserve team-specific context, maintain auditability, continuously improve through feedback, and keep human experts in control of decisions that require judgment. To address these challenges, Microsoft launched the Great Experiences Matter (GEM) initiative. GEM is designed to analyze feedback signals in aggregate, with access controls and privacy safeguards designed to limit exposure of customer-identifiable information while helping teams identify patterns across channels. The Solution: an agentic feedback-to-fix loop with humans in control GEM created an AI-enabled feedback-to-fix workflow that connects customer listening, engineering action, and impact measurement across the product development lifecycle. The workflow uses Microsoft Foundry, Azure Data Explorer, Microsoft Fabric, Azure DevOps, and a set of custom agents to transform large volumes of qualitative feedback into prioritized insights and actionable engineering work. Fig 1. GEM AI-enabled automation workflow The system closes the loop through two connected motions. Find. Agentic workflows remove noise and duplicate reports, assess relevance and actionability, classify feedback against known issues from UX research, cluster related issues, and surface likely root causes. GEM builds on years of deep end-to-end UX research that has identified systemic friction across customer journeys and product boundaries. By continuously triangulating GEM signals with ongoing research, we combine broad, scalable listening with deep human insight to inform a more cohesive Azure experience. The results are surfaced through global scorecards for cross-cutting Azure issues and vertical scorecards tailored to individual product teams. Fig 2. GEM Global scorecard of top issues with Azure, data has been fictionalized to protect intellectual property Fix. The workflow creates Azure DevOps work items with the customer context, likely reproduction steps, recommended next actions, and an auditable trace of the supporting analysis. To date, 42% of the identified issues have been addressed through engineering action. The team is also extending an AI-assisted engineering workflow, using GitHub Copilot cloud agent, that can generate proposed fixes for straightforward issues. Engineers remain responsible for reviewing, refining, approving, and shipping any changes. The architecture is designed for inspection rather than blind automation. The recommendations include an auditable evidence trail allowing reviewers to inspect the source feedback, classifications, supporting references, confidence indicators, and recommendation actions. Human expertise enters the system at several points. Researchers shape the issue taxonomies and qualitative grounding. Product teams define ownership boundaries, business priorities, domain-specific vocabulary, and trusted sources that guide agent analysis. Engineers review and act on resulting work items, while leaders use scorecards to inform investment decisions. This context is captured in configuration files that evolve alongside the products they support. Teams can add new issue categories, refine keywords, clarify ownership boundaries, or identify trusted research sources. The next analysis cycle automatically incorporates the updated context without requiring changes to the underlying agents. That design creates a "feedback loop for the feedback loop". Teams review the root-cause analyses and work-item quality, identify gaps, and refine their configurations. This enables teams to continuously embed domain expertise into the workflow, improving how feedback is interpreted and prioritized without requiring changes to the underlying infrastructure. Their input improves subsequent runs, helping the system become more precise while preserving local product knowledge. The agent also maintains access to reports from previous runs and uses tools such as Web IQ and MCP servers to assess whether previously identified issues are improving, still require attention, or can be confidently closed. Fig 3. Example of the vertical feedback agent reasoning through customer feedback to find new work items One demonstrated example surfaced customer reports that a networking tool lacked IPv6 validation and support. The workflow generated an engineering work item describing the issue, customer impact, likely reproduction path, and recommended actions. The networking team reproduced the issue, validated the finding, and added it to its backlog. The goal is not to remove people from the process. Agents assume much of the cognitive load associated with sorting, clustering, tracing, and drafting, allowing experts to focus on judgment, prioritization, and implementation. Teams remain accountable for what is fixed, what is funded, and what is allowed to ship. The Impact: measurable experience gains at Microsoft production scale GEM began with manual interventions and is now scaling through AI-enabled workflows. The combined approach has produced measurable results across the Azure Portal and individual product experiences: The workflow aggregates and analyzes approximately 10,000 to 15,000 feedback reports each month across in-product, support, and social channels. Automated analysis reduced manual synthesis time by over 95 percent, turning a process that required 110 to 160 hours each month into a workflow that runs in under 60 minutes. Between October 2025 and April 2026, Azure Portal feedback rates declined by 30%. During that same period, GEM helped teams identify and prioritize experience improvements, creating a clearer link between customer feedback, engineering action, and outcome measurement. Service-level outcomes also demonstrate how better signals can drive business impact. For example, improvements to VM Connect experiences reduced overall Core Compute support volume by 1-2% per month, resulting in proportionate cost savings. The Azure Growth team increased subscription conversion by 9.1 percent after prioritizing issues highlighted through GEM. The value goes beyond speed. Leaders gain a more consistent basis for prioritization, and engineering teams receive work that is already connected to customer evidence and impact signals. Most importantly, every completed cycle creates new learning. Teams can measure changes in customer feedback and support volumes following improvements, incorporate partner input into future analyses, and continuously refine both the system and the products it helps improve. Key learnings and transferable practices The GEM experience offers several lessons for teams building agentic systems around complex, qualitative business processes: Start with real problems, not AI - Value comes from understanding the genuine business needs and applying AI where it is demonstrably better than existing approaches. Applying AI without a clearly defined problem often adds complexity without delivering meaningful value. Design for the end-to-end workflow - Value comes from connecting insights to the broader business process, including grounding in prior knowledge, prioritization, engineering action, post-fix measurement and reporting. Standalone AI output creates limited value, while an integrated workflow drives outcomes. Design for human judgment and accountability - Agents can reduce toil and cognitive load, but researchers, product managers, engineers, and leaders remain responsible for validating insights and determining appropriate actions. Ground agents in the knowledge of the teams they serve - Shared models require local context. Editable configuration files allow teams to define ownership, business priorities, releases, examples, and trusted sources without modifying underlying agents. Build observability and feedback mechanisms into the agentic system itself - Making analysis inspectable through reasoning traces, source context, and recommendations enables experts to identify gaps, improve outputs, and build trust over time. Build feedback mechanisms directly into the flow of work, making it effortless for users to provide input on the system. Tailor outputs to the people making decisions - Executives need trends and investment signals. Researchers need evidence and themes. Engineers need reproducible, actionable work. Effective systems deliver the right information to the right audience. Start small and iterate quickly - The AI landscape continues to evolve rapidly. Begin with a well-defined problem, measure outcomes, learn from feedback, and iterate as capabilities mature. Looking forward GEM continues to scale across the Azure Portal ecosystem. In addition to the global scorecard, vertical scorecards are now live with seven teams, expanding to the top 20 portal extensions representing more than 80% of portal traffic and feedback, with longer-term plans to extend coverage across the entire ecosystem. The roadmap includes expanded feedback ingestion, streamlined work-item tracking, AI-assisted remediation workflows, stronger evaluation, and a self-improving architecture. Proposed fixes would remain subject to engineer review, approval, and standard release controls before deployment. GEM is also developing AI-assisted pre-release governance workflows for production code that help identify potential quality issues during development. We will share more about these pre-release workflows in a future post. New tools and models will continue to evolve, but the enduring principle remains the same: combine enterprise-scale automation with clear ownership, trusted grounding, and human control. For Microsoft, Customer Zero means deploying these systems in real production environments, learning from the complexities, and sharing those lessons broadly. GEM shows what becomes possible when AI does more than summarize feedback. It helps an organization listen, act, measure outcomes, and continuously learn at customer scale. Microsoft's Customer Zero blog series gives an insider view of how Microsoft builds and operates Microsoft using our trusted, enterprise-grade agentic platform. Learn best practices from our engineering teams through real-world lessons, architectural patterns, and operational strategies for building, operating, and scaling AI-powered systems across the organization.1.1KViews2likes0CommentsWiring Azure DevOps Pipeline Templates Without the Parameter Sprawl: The Manifest Facade Pattern
Where reusable pipelines start to hurt Who this is for: Platform and DevOps engineers who build shared Azure DevOps Pipeline Templates and want other teams to adopt them consistently. If you have ever built a set of shared Azure DevOps Pipeline Templates, you probably know how this goes. You write a whole library of clean, well-factored templates: provisioning infrastructure, deploying apps, scanning, promotion, and more. Each one is tidy on its own. Then the first team tries to actually use them together, and things get messy fast. That is exactly what happened to us on a customer engagement, while building a DevOps framework for their engineering teams. The templates themselves were fine. The trouble was wiring them together. Every consumer pipeline had to know how to call each template it used: the right order, which values one template fed another, and the full parameter list for every one of them. As the library grew, those consumer pipelines grew with it, long and repetitive. That friction turned into a real adoption problem. Getting started meant wading through pages of parameters, so teams put it off, copied whatever the team next door had, or quietly built their own thing instead. This post follows that story, from the tangle of parameters to the solution we landed on. Here is how it comes together. Where we started: Good templates, hard to adopt The DevOps framework we built had many templates. To keep this walkthrough concrete, we will follow just two of them: one that provisions infrastructure with Terragrunt (a wrapper around Terraform), and one that deploys an app to Kubernetes with Helm. Both are trimmed down to the essentials here so they are easy to follow. The infrastructure template, templates/infra/terragrunt-deploy.yml : parameters: - name: stack type: string - name: workingDir type: string steps: - script: | cd ${{ parameters.workingDir }} terragrunt plan -out=tfplan terragrunt apply -auto-approve tfplan displayName: "Deploy ${{ parameters.stack }}" The application template, templates/app/helm-deploy.yml : parameters: - name: releaseName type: string - name: chart type: string - name: namespace type: string - name: imageTag type: string steps: - script: | helm upgrade --install ${{ parameters.releaseName }} ${{ parameters.chart }} \ --namespace ${{ parameters.namespace }} \ --set image.tag=${{ parameters.imageTag }} displayName: "Deploy ${{ parameters.releaseName }}" There is nothing wrong with either file. The pain showed up in the pipeline that had to use them, where a team had to stitch the templates together by hand, remember the order, and repeat that boilerplate for every environment. Do that across a dozen services and you get long, copy-pasted pipelines that teams struggle to adopt. And because the wiring is done by hand, it leaves loopholes: a team can skip a step or override a parameter and slip past the guardrails you thought were in place. Challenge 1: Wiring the templates together The obvious move was to hide the wiring behind a single template that owned the order and the plumbing. We called it the orchestrator template: a consumer pipeline called that one template, and it wired up the rest. # templates/deployment-orchestrator.yml (the single orchestrator) parameters: - name: infraStack type: string - name: infraWorkingDir type: string - name: releaseName type: string - name: chart type: string - name: namespace type: string - name: imageTag type: string # ...and this list just kept growing stages: - stage: Infra jobs: - job: infra steps: - template: infra/terragrunt-deploy.yml parameters: stack: ${{ parameters.infraStack }} workingDir: ${{ parameters.infraWorkingDir }} - stage: App dependsOn: Infra jobs: - job: app steps: - template: app/helm-deploy.yml parameters: releaseName: ${{ parameters.releaseName }} chart: ${{ parameters.chart }} namespace: ${{ parameters.namespace }} imageTag: ${{ parameters.imageTag }} A team used it by calling that one template and passing a value for every parameter it exposed: # azure-pipelines.yml (a team's pipeline) parameters: - name: imageTag type: string extends: template: templates/deployment-orchestrator.yml parameters: infraStack: network infraWorkingDir: infra/network releaseName: orders-api chart: charts/orders-api namespace: orders imageTag: ${{ parameters.imageTag }} # ...and a value for every other parameter, too This solved the ordering and the copy-paste, but it handed us a new headache. This one template now had to expose every parameter of every template underneath it, and the list grew each time we added a capability. Worse, a real service usually needed more than one infrastructure stack and more than one Helm release. A flat list of parameters cannot express “two infrastructure stacks and three Helm releases” without silly names like infraStack1 , infraStack2 , and so on. Nobody could learn the thing. We had solved the wiring, only to trade it for a parameter problem. Challenge 2: The orchestrator’s parameter list explodes So how do you shrink that list? Step back and ask what you are really describing: a set of things to deploy. So the input should describe that set, not a long flat list of loose values. That is where the deployment manifest came in: one small config that lists the infrastructure to create and the apps to deploy. It reads about how you would expect: infrastructure: - stack: network workingDir: infra/network applications: - releaseName: orders-api chart: charts/orders-api namespace: orders Now the orchestrator can take that single manifest and loop over it, instead of exposing dozens of separate parameters. Its parameter list collapses to one, and a ${{ each }} loop turns each entry into a stage or job: # templates/deployment-orchestrator.yml (the orchestrator, now manifest-driven) parameters: - name: manifest type: object - name: imageTag type: string stages: - stage: Infra jobs: - ${{ each stack in parameters.manifest.infrastructure }}: - job: infra_${{ stack.stack }} steps: - template: infra/terragrunt-deploy.yml parameters: stack: ${{ stack.stack }} workingDir: ${{ stack.workingDir }} # ...an App stage loops over parameters.manifest.applications the same way And a consumer passes that manifest straight to the orchestrator: # azure-pipelines.yml (a team's pipeline) parameters: - name: imageTag type: string extends: template: templates/deployment-orchestrator.yml parameters: imageTag: ${{ parameters.imageTag }} manifest: infrastructure: - stack: network workingDir: infra/network applications: - releaseName: orders-api chart: charts/orders-api namespace: orders The parameter problem is solved. But hand-writing that whole manifest inside every pipeline is a lot to repeat, so the natural instinct is to pull it out into its own file. That is where things get tricky. Challenge 3: The manifest is read too late to shape the pipeline So we tried exactly that: we moved the manifest into a deployment-manifest.yml file and had the orchestrator read it back and expand it into stages and jobs. It sounded reasonable, but it did not work. To see why, you need to know how Azure DevOps builds a pipeline before it runs anything. An Azure DevOps pipeline actually happens in two phases, and they are further apart than people expect. First comes the build phase, before anything runs. Azure DevOps reads your YAML, pulls in every template, evaluates every ${{ }} expression, and unrolls every ${{ each }} loop. Out of this it produces one final, fully assembled pipeline. At this point no agent has started and no repo has been checked out. Only parameters and template expressions exist yet. Then comes the run phase. The assembled pipeline runs. An agent starts, checks out your code, and only now can a script open a file on disk. Here is the problem. Your deployment-manifest.yml does not exist as far as the pipeline is concerned until an agent checks out the repo, and that checkout happens during the run phase. So if the manifest is supposed to decide how many stages there are, or how many apps each get their own job, that decision has to be made earlier, while the pipeline is still being built. Important: The shape of the pipeline, its stages, jobs, and loops, is locked in while the pipeline is being built. A file you read during the run comes too late to change any of it. That was the wall we hit. The manifest was the right idea, but reading it from a file happened too late for the orchestrator to turn it into stages and jobs. So the manifest could not come from a file read during the run phase. It had to already exist, as an object, before the pipeline was assembled. The Manifest Facade pattern: Build the config while the pipeline is assembled The solution is to stop thinking of the manifest as a file to read, and start thinking of it as an object you build while the pipeline is being assembled. Parameters are available then. Template expressions can build a whole object then. So we added a small template, kept in the team’s own repo, with one job: take a couple of simple inputs, build the full manifest from them, and pass it to the shared orchestrator. We called it the builder, since assembling the manifest is its only job. It stays thin and lives next to the team’s pipeline, while the orchestrator stays in the shared platform repo. This is not a brand-new invention so much as a few familiar ideas working together, applied at pipeline build time. The manifest is a Parameter Object (Martin Fowler’s refactoring for collapsing a long parameter list into one structured value). The orchestrator is a Facade (the Gang of Four pattern for putting one simple, unified interface over a subsystem, here the underlying leaf templates). And the small template in the team’s repo is the piece that assembles that Parameter Object from a couple of inputs. What makes it an Azure DevOps pattern is the timing: the manifest is built as an object while the pipeline is assembled, so it can drive template expansion instead of sitting in a file that only gets read during the run. That is the twist we did not see written down anywhere, so we gave it a name: the Manifest Facade pattern. In practice it comes together in three small pieces: the consumer pipeline references the builder, the builder assembles the manifest and hands it to the shared orchestrator, and the orchestrator expands that manifest into stages and jobs. Here is how the files extend into one another: Here is each piece in turn. Step 1: The consumer references the builder The consumer pipeline extends the builder that lives in its own repo. It also declares the shared platform repo as a resource, so the orchestrator the builder calls is available while the pipeline is built. # azure-pipelines.yml (the team's pipeline) parameters: - name: imageTag displayName: Image tag type: string resources: repositories: - repository: platform type: git name: platform/pipeline-templates ref: refs/tags/v1.0.0 trigger: - main extends: template: config/deployment.yml@self parameters: environment: dev service: orders imageTag: ${{ parameters.imageTag }} Because the image tag is a runtime parameter, it is declared here in the consumer pipeline, which is what makes it appear in the Run pipeline panel for someone to fill in. Beyond that, the team passes only an environment and a service name, and the builder works out the rest. Step 2: The builder assembles the manifest The builder takes those inputs and assembles the whole manifest from them, then hands it to the orchestrator. Every structural value here is a parameter or a template expression, so all of it is ready while the pipeline is being assembled. # config/deployment.yml (builder, in the team's repo) parameters: - name: environment type: string - name: service type: string - name: imageTag type: string extends: template: deployment-orchestrator.yml@platform parameters: imageTag: ${{ parameters.imageTag }} manifest: schemaVersion: v1 infrastructure: - stack: network workingDir: infra/${{ parameters.environment }}/network applications: - releaseName: ${{ parameters.service }} chart: charts/${{ parameters.service }} namespace: ${{ parameters.service }} The builder assembles the manifest inline from the environment and service, then passes it straight to the orchestrator. The image tag is different: it is a runtime parameter the user supplies at queue time, so it is passed through to the orchestrator template and never becomes part of the manifest. The team gets a tiny interface, and the orchestrator still gets the full structure it needs. Step 3: The orchestrator turns the config into stages and jobs The orchestrator takes a single object and loops over it with ${{ each }} . Each stage and job gets generated while the pipeline is assembled. # deployment-orchestrator.yml (shared platform repo) parameters: - name: manifest type: object - name: imageTag type: string stages: # a ValidateManifest stage runs first (covered in the next section) - stage: Infra jobs: - ${{ each stack in parameters.manifest.infrastructure }}: - job: infra_${{ stack.stack }} steps: - template: infra/terragrunt-deploy.yml parameters: stack: ${{ stack.stack }} workingDir: ${{ stack.workingDir }} - stage: App dependsOn: Infra jobs: - ${{ each app in parameters.manifest.applications }}: - job: app_${{ app.releaseName }} steps: - template: app/helm-deploy.yml parameters: releaseName: ${{ app.releaseName }} chart: ${{ app.chart }} namespace: ${{ app.namespace }} imageTag: ${{ parameters.imageTag }} Because the manifest is a real object by the time the loops run, ${{ each }} unrolls it into actual jobs. List two stacks and you get two jobs. List two apps and you get two deploy jobs. And because the team only describes what to deploy, the sensitive wiring like service connections stays inside the platform templates, out of reach. The loophole is gone because the parameter is gone. Why the order of things matters The whole pattern comes down to who does what, and when. The builder turns a simple intent (“deploy orders to dev”) into a full manifest, while the pipeline is being assembled. The orchestrator turns that manifest into real stages and jobs, still while the pipeline is being assembled. Only the leaf templates do the real deployment work during the run: checkout, terragrunt apply , helm upgrade . Nothing about the shape of the pipeline waits for the run, so nothing about it depends on a file that only shows up after checkout. That is the whole trick. If you do have values you genuinely cannot know until the run, like a secret fetched from a vault or an artifact version an earlier stage writes to a variable, those still belong in runtime variables and variable groups. The manifest is for the structure and config you already know when you queue the build, which is almost always the part that was causing the pain. Validating the manifest against a schema Once the manifest became the one interface every team fills in, it needed a contract. We wrote that contract as a JSON Schema and kept it in the shared platform repo under schema/v1/ . The folder name is the version: backward-compatible additions go straight into v1 , and the day we need a breaking change we add a schema/v2/ alongside it, so existing consumers keep working while the schema evolves. Each manifest carries a schemaVersion so the orchestrator knows which contract to hold it to. On top of that, we validate in three layers, each catching a different class of mistake. Layer 1 is build time, for free. Because the orchestrator’s parameters are typed, with manifest declared as an object , Azure DevOps catches a range of structural problems while it expands the templates, before anything runs. For example, if a manifest left out infrastructure or misspelled it, the orchestrator’s ${{ each stack in parameters.manifest.infrastructure }} loop would have nothing valid to iterate over, and the failure would surface during template expansion rather than halfway through a deployment. Layer 2 is a version check that runs at build time. Both the ${{ if }} and parameters.manifest.schemaVersion are resolved while the pipeline is being assembled, so the orchestrator decides right then whether it understands the manifest’s version. If it does not, the only thing it generates is a single failing stage, and the real deployment stages are never built, so nothing runs against a contract the orchestrator does not know: # deployment-orchestrator.yml (shared platform repo) parameters: - name: manifest type: object stages: # Layer 2: reject schema versions this orchestrator does not understand - ${{ if not(containsValue(split('v1', ','), parameters.manifest.schemaVersion)) }}: - stage: UnsupportedSchemaVersion jobs: - job: fail steps: - script: | echo "##vso[task.logissue type=error]Unsupported manifest schemaVersion '${{ parameters.manifest.schemaVersion }}'" exit 1 # the ValidateManifest, Infra, and App stages below are generated only when the version is supported Layer 3 is a run-time check against the full schema. The first stage the orchestrator generates is ValidateManifest . Because the schema lives in the platform repo, the job checks that repo out first. Then it serializes the manifest object to JSON with the convertToJson expression, writes that JSON out to a file, and runs a JSON Schema checker to compare the file against the schema. If the manifest breaks the contract, the pipeline stops here, before any infrastructure or app stage runs: # Layer 3: validate the real manifest object against the JSON Schema - stage: ValidateManifest jobs: - job: validate steps: # the schema lives in the platform repo, so check it out first - checkout: platform - script: | echo '${{ convertToJson(parameters.manifest) }}' > manifest.json pip install check-jsonschema check-jsonschema --schemafile schema/${{ parameters.manifest.schemaVersion }}/deployment.schema.json manifest.json displayName: "Validate manifest against schema" Layer 1 is automatic, Layer 2 rejects an unknown contract at build time so the deployment stages are never generated, and Layer 3 confirms the actual values match the schema before any real work begins. Together they turn “the manifest looked right” into “the manifest is provably valid.” A few trade-offs to keep in mind No pattern comes without trade-offs. A few things worth weighing: The manifest has to be something template expressions can build. You can compose objects, loop, and branch with ${{ if }} , but there is no running arbitrary code while the pipeline is assembled. Anything fancier may need a prep step or a file generated upstream. Every team carries a small builder template. We think that is a fair trade, since it keeps their intent local and readable, but it is one more file per repo. Keep it thin and let the orchestrator hold the real logic. Treat the schema as living documentation. Because the manifest’s JSON Schema spells out every field and what it means, teams can read it to build their own manifest with confidence, instead of reverse-engineering the orchestrator. Pin the shared repo to a tag, like the v1.0.0 above, so a change to the orchestrator does not silently change everyone’s pipeline on the next run. Debugging takes a small shift in habit. When something looks off, use the pipeline’s preview to see the fully assembled YAML before it runs. It shows you exactly what the loops produced. Tip: Use the Azure DevOps pipeline preview to see the fully assembled YAML without running anything. It is the fastest way to confirm your manifest unrolled into the stages and jobs you expected. Wrapping up It is a journey a lot of platform teams will recognize. Clean templates, messy wiring, one orchestrator that fixes the order but drowns in parameters, a config file that brings back sanity, and then the surprise that reading it at the wrong moment means it can never shape the pipeline. The solution is small and it sticks. Put a thin builder template next to each team, let it assemble the manifest from a couple of simple inputs, and let a shared orchestrator turn that manifest into stages and jobs. Teams get an interface they can easily understand and adopt. The platform team keeps the wiring and the guardrails in one place. And the timing gap that trips up so many “just read the config file” attempts stops being a problem, because you are working with it instead of against it. Key takeaways Shared Pipeline Templates stall on adoption when every team has to wire them together by hand. A single orchestrator template fixes the ordering, but a flat parameter list does not scale to real adoption. A config file read during the pipeline run cannot shape the pipeline, because stages and jobs are decided earlier, while the pipeline is assembled. The Manifest Facade pattern builds the config as an object at assembly time, so one small input drives many templates, consistently and with the guardrails baked in. Give the manifest a versioned JSON Schema and validate it in layers, so a broken contract fails fast instead of halfway through a deployment. How are you handling template sprawl in your own pipelines? We would love to hear what has worked for your teams in the comments.690Views1like0Comments
How Microsoft 365 built a platform engineering layer on AKS to ship faster at global scale
This Customer Zero story explains how Microsoft 365 built COSMIC, a platform engineering layer on top of Azure Kubernetes Service (AKS), to standardize how cloud services are deployed and operated at global scale. The goal was to eliminate repetitive infrastructure work for service teams, embed security and compliance by default, and enable developers to focus on delivering customer value instead of managing platform complexity.4.9KViews4likes0CommentsIPv6 Dual-Stack Endpoints for Azure Container Registry (Public Preview)
By Johnson Shi, Aviral Takkar, Bin Du Introduction Two of the most common networking questions we hear from teams running Azure Container Registry (ACR) are: "Can my registry serve clients on IPv6 networks?" — Teams operating IPv6-only or dual-stack networks need their container registry reachable over IPv6. "How do we start moving registry traffic toward IPv6 without breaking anything?" — Organizations guarding against IPv4 address exhaustion, or operating under IPv6 transition mandates, want a migration path that doesn't disrupt existing IPv4 clients. Today, we're announcing the public preview of IPv6 dual-stack endpoints for Azure Container Registry for public endpoints and firewall rules, with IPv6 over private endpoints planned for GA. Set your registry's endpoint protocol to IPv4AndIPv6 , and its endpoints become reachable over both IPv4 and IPv6 — so IPv4-only, dual-stack, and IPv6-capable clients all connect to the same registry, each over whichever protocol their network stack selects. Key Takeaways ACR registries now support an endpointProtocol setting with two values: IPv4 (default) and IPv4AndIPv6 (dual stack, preview). Dual stack is additive — your registry continues serving IPv4 clients exactly as before. There is no IPv6-only mode. Dual stack requires dedicated data endpoints to be enabled ( --data-endpoint-enabled true ), and dedicated data endpoints require the Premium SKU. The service enforces this requirement. You can enable it today with Azure CLI 2.87.0 via az acr update --endpoint-protocol IPv4AndIPv6 . FQDN-based client firewall rules keep working unchanged; IP-based allowlists need to account for IPv6 traffic. Limitation: This public preview covers IPv6 for the registry's public endpoints and firewall rules only. IPv6 over private endpoints is planned for a future release. Limitation: ACR Tasks isn't supported on a registry that has IPv6 dual-stack enabled. Tasks does not work when the endpoint protocol isIPv6 dual-stack, including quick builds (with az acr build) and quick task runs (with az acr run). Support is planned for a future release. How to enable it On an existing registry (Azure CLI 2.87.0 or later) Dual stack requires dedicated data endpoints, so enable both in a single update: az acr update --name <your-registry> --data-endpoint-enabled true --endpoint-protocol IPv4AndIPv6 If dedicated data endpoints are already enabled, set the endpoint protocol on its own: az acr update --name <your-registry> --endpoint-protocol IPv4AndIPv6 Verify the configuration: az acr show --name <your-registry> --query "{endpointProtocol:endpointProtocol, dataEndpointEnabled:dataEndpointEnabled}" { "dataEndpointEnabled": true, "endpointProtocol": "IPv4AndIPv6" } Note: If your clients sit behind a firewall and you're enabling dedicated data endpoints for the first time, add firewall rules for <your-registry>.<region>.data.azurecr.io before enabling — switching from *.blob.core.windows.net to dedicated data endpoints changes where layer blobs are downloaded from. See Dedicated data endpoints for details. Reverting to IPv4 Dual stack is reversible at any time: az acr update --name <your-registry> --endpoint-protocol IPv4 Reverting the endpoint protocol leaves dedicated data endpoints enabled; disable them separately if desired. Scope of this preview This public preview enables IPv6 for the registry's public endpoints — the login server, dedicated data endpoints, and regional endpoints (if enabled). IPv6 over private endpoints isn't part of this preview. Support is planned for a future release. Until then, registries reached through a private endpoint continue to use IPv4. Additionally, IPv6 dual-stack support for ACR Tasks, including support for `az acr build` and `az acr run`, are not supported in the public preview. Support is planned for a future release. Requirements and how features compose Requirement Why Premium SKU Dedicated data endpoints are a Premium feature. Dedicated data endpoints enabled IPv4AndIPv6 requires dataEndpointEnabled: true ; the service rejects the setting otherwise. Azure CLI 2.87.0+ Adds --endpoint-protocol to az acr update . For geo-replicated registries, the endpoint protocol is a registry-level setting, and dedicated data endpoints exist in every replica region. Firewall guidance: rules based on registry FQDNs — the login server, dedicated data endpoints, and regional endpoints (if enabled) — continue to work unchanged for dual-stack registries; only IP-address-based allowlists need updating for IPv6. To learn more, see IPv6 dual-stack endpoints in Azure Container Registry (preview) and the ACR endpoint reference. If you have further questions about IPv6 dual-stack endpoints or dedicated data endpoints, reach out to us on the Azure Container Registry GitHub repository or file feedback through the Azure portal.342Views1like0CommentsHow Many Copies of Each Layer Does Your Container Registry Actually Need?
Authors: Payal Mahesh and Vicky Lin Azure Container Registry team: Jeanine Burke and Johnson Shi Introduction It's Monday morning. You spin up a fresh 1,000-node AKS cluster for a big training run or a fleet-wide rollout. Every node reaches for the same large container image at the same instant. What actually happens in the next ten minutes - and whether your pods reach Ready in 9 minutes or 14 - turns out to depend on a single number you've probably never thought about: how many copies of each image layer exist behind your registry. At the surface, you see a single capacity number for your registry size - but behind that abstraction, Azure Container Registry maintains copies of your layer data to optimize pull performance. That number of copies directly determines the read throughput available per layer. Each copy can serve requests independently, so distributing the layer across storage allows it to be read in parallel. More copies mean more independent readers - and higher aggregate throughput when thousands of nodes pull at once. The intuitive answer is that more is better: add copies, get faster pulls. When we actually tested it at 1,000-node scale, the truth turned out to be more interesting: A few extra copies helped a little. A moderate number helped a lot, and eliminated storage throttling entirely. A large number helped no more than the moderate one. A huge number actually made pulls slower again. Think of it like opening checkout lanes at a grocery store. Opening a few more lanes when the store is slammed cuts the line dramatically. Past a certain point, though, extra lanes barely help, because by then it's the customers, not the cashiers, who are the bottleneck. And open too many? Now the staff is spread thin and tripping over each other, and the line moves worse than it did at the sweet spot. This post walks through what we measured, why the curve bends where it does, and what we're building next so finding that sweet spot isn't something anyone has to do by hand. Key Takeaways There's a sweet spot, not a slope. Adding copies per layer cut pod-startup P99 by 27% and raised P50 per-node egress throughput by 244%, but only up to a point. Past that, the returns vanish, and far past it, latency actually regresses. Storage throttling is the real enemy. The win comes from spreading load across enough storage backends that no single backend gets pinned at its egress ceiling. Once throttling is gone, more copies stop helping. Storage scale alone has a ceiling. Even at the sweet spot, the per-backend egress limit caps total throughput. The next jump in performance has to come from somewhere else, which is exactly what we're building (see What's Next). This isn't something customers should need to manage. We're building a proactive, on-demand storage scaling capability that automatically grows the footprint before throttling happens and shrinks it back when the burst is over. A quick bit of background Within a region, the layer data behind your container images is backed by Azure storage. The number of copies ACR maintains per layer determines how many independent storage backends a concurrent-pull workload can spread its reads across. That's what matters, because each backend has a finite egress ceiling. Once concurrent reads against one backend get close to that ceiling, requests start getting throttled, and your pulls slow down in proportion. The principle is simple: more copies per layer means more backends serving the same data, which means more total egress headroom and fewer throttled requests. What we wanted data on was how many, and where it stops helping. How we tested We ran a controlled series of large-scale pull tests against ACR Premium on a roughly 1,000-node cluster, with every node pulling the same large image cold at the same time (no local cache on any node). The only thing we changed between runs was the number of per-layer copies behind a single registry endpoint. Everything else, including rate limits, the image, node count, and concurrency, stayed constant. For each run we measured pod-startup latency (P50/P90/P99), end-to-end storage read latency, egress throughput distributions (P50-P99.9), and storage throttling events. Pod-startup latency is our headline metric, because it's the one number that reflects the actual customer experience no matter where the bottleneck happens to be. Per-node egress throughput matters too, though. It tells you directly how much pull bandwidth ACR delivers to your fleet, and it's usually what customers have in mind when they ask how much faster extra copies will make their pulls. We report egress as a distribution rather than a single average, since per-request and per-time-window views can tell very different stories about the same set of pulls. These are observations from a single controlled environment, not a service guarantee. Absolute numbers will move with image size, node count, layer composition, network topology, and concurrency. What we found We tested five configurations, sweeping from a low baseline number of per-layer copies up to a very high one. We name them by relative copy count rather than exact instance counts: Baseline: the lowest level, our reference point. Low: a modest step up from Baseline. Mid: a meaningful step up from Low. Higher: a further step up from Mid. Very high: the largest configuration we tested, well above Higher. Here are the numbers. All percent changes are relative to Baseline. Configuration Pod startup P50 Pod startup P90 Pod startup P99 Storage throttling events Peak per-backend egress Baseline (fewest copies) 9m 36s 11m 0s 14m 16s Many; all top backends above the egress ceiling Highest Low 9m 27s (−2%) 10m 14s (−7%) 12m 59s (−9%) Some; one backend still above the ceiling High Mid 9m 25s (−2%) 9m 45s (−11%) 10m 22s (−27%) Zero Below the ceiling Higher 9m 20s (−3%) 9m 37s (−13%) 10m 22s (−27%) Zero Well below the ceiling Very high 9m 28s (−1%) 10m 31s (−4%) 13m 48s (−3%) Zero Lowest Look at the P99 pod-startup column from top to bottom: 14m 16s, 12m 59s, 10m 22s, 10m 22s, 13m 48s. It improves, flattens out, then climbs back up. Three things explain that shape: 1. The win: Throttling falls off a cliff at the Mid configuration As we added copies per layer, per-backend egress fell and storage-side throttling decreased. At the Mid configuration, throttling errors hit zero, and they stayed at zero for every configuration above it. The upside isn't just that the errors went away, though. It's raw pull bandwidth. At the Mid sweet spot, the typical node saw its P50 egress throughput jump 244% over Baseline. With load spread across enough copies, each node pulled its layers off storage much faster, not just without stalling. For a workload owner, that's the difference between watching pods come up in a steady stream and watching them stall for tens of seconds at a time while throttling clears. Same image, same node count, same registry, very different experience. To put it in concrete terms: if your team runs a daily AI training kickoff that needs all 1,000 nodes pulling before the job can start, this is the difference between starting on time and starting four minutes late every day. Over a quarter of training runs, that adds up. 2. The surprise: more copies made pulls slower This is the finding that genuinely surprised us. Going from Higher to Very high, the largest configuration we tested, cost us 3 minutes and 26 seconds at P99: 10m 22s climbing back up to 13m 48s. That gave back almost the entire benefit we'd built up over the previous four configurations. Tail storage-read latency at Very high actually came out worse than Baseline. The Very high run is where the wheels came off, and the reason is the trade-off underneath. Once storage throttling is gone, more copies stop buying you anything, and the cost of fanning reads across that many backends starts to take over. The throughput distribution shows it clearly. P50 and P75 throughput had been climbing steadily and getting smoother through Mid and Higher, then dropped sharply at Very high while the peak P99/P99.9 spikes came back. Spread the same load across too many backends and it fragments into smaller, less consistent bursts. The takeaway is that "more is better" stops being true past the sweet spot, and the failure mode is quiet. You won't see throttling errors. You'll just see your pulls get slower. 3. What we didn't expect: at few copies, the hottest backend is what hurts you At the lowest copy counts, pull traffic wasn't spread evenly across the underlying storage footprint. Some backends absorbed far more traffic than others. As we added copies, that distribution evened out and the hottest backends cooled down. The implication is sharp. You can saturate the busiest backend, and trigger throttling, even when the total headroom across all your backends is large in aggregate. What matters is the load on the hottest backend, not the average. That's exactly the failure mode that demand-driven, proactive scaling (described below) is meant to head off before it happens. So how should you think about this? You don't size copies yourself; ACR manages the storage footprint behind your registry. Still, it helps to understand what moves the sweet spot, because the shape of your own workload is what decides where it lands. The bigger your worst-case concurrent burst (more nodes, larger images, higher concurrency), the more copies per layer it takes to keep pulls off the throttling ceiling, and the further out the sweet spot sits. Smaller workloads may already be sitting on the flat part of the curve. One thing is worth saying plainly. The storage footprint underneath is managed by ACR and shared across many registries, so there's no fixed, private storage budget that maps one-to-one to your workload. The sweet spot isn't a number you compute and provision; it's a behavior the platform has to land on for you, which is exactly why we're moving toward demand-driven scaling that handles it automatically. That's what brings us to what we're building next. What's next: proactive, on-demand storage scaling and a caching layer The fixed-copy tests above answer the question "how many should the ACR system provision?" but they assume a single, static answer. Real workloads aren't static. A 1,000-node burst happens at deploy time, not at 3 a.m. on a Tuesday. And no matter how many copies are provisioned, the per-backend storage ceiling still bounds peak deliverable throughput. So we're investing along two complementary directions. 1. Proactive, demand-driven storage scaling We're building a capability that adjusts the number of per-layer copies automatically based on real-time pull demand: Proactive, not reactive. The system scales the storage footprint before concurrent pull pressure pushes any single backend near the throttling threshold, so throttling is prevented before it forms rather than cleaned up after the fact. On-demand scale-out. The footprint expands automatically as sustained pull demand grows. Scale-in when demand subsides. The footprint contracts so you're not paying for steady-state capacity you only needed during a burst. Tiering for cold content. Long-tail, rarely-pulled content can sit on colder storage, so the redundant footprint of frequently-pulled content doesn't pay full hot-storage cost everywhere. The benefit to customers is straightforward: smoother pulls under burst, higher delivered throughput on average, no permanent over-provisioning, and no manual re-tuning as workloads grow. 2. A caching layer to absorb burst beyond the storage ceiling Even a perfectly scaled storage footprint runs into the per-backend egress ceiling at extreme scale. To push past it, we're investing in a caching layer in the registry service that absorbs burst traffic before it ever reaches storage. A pull surge that hits the same set of layers, which is the common case for fleet-wide deployments, can be served largely from cache. That takes a lot of load off any single storage backend and complements the storage scaling above. We'll share results from this work in follow-up posts. If you have questions about scaling ACR for your workload, or about how we measure storage performance, reach out on the Azure Container Registry GitHub repository. Note: All results in this post are based on controlled internal testing configurations and are intended to illustrate general scaling behavior rather than prescribe exact configurations.375Views0likes0CommentsDesigning for High Availability: The Operational Reference for Running a Geo-Replicated ACR
By Johnson Shi, Zoey (Zhuyu) Li, Huangli Wu Introduction Three of the most common questions we hear from enterprise teams running geo-replicated Azure Container Registries (ACR) are: "How do I control which region serves my traffic?" — When my AKS clusters are spread across regions, can I pin each one to its co-located replica, or am I stuck with however the global endpoint routes? "What happens during a regional incident — is failover automatic or do I have to act?" — If the registry in one region degrades, does the global endpoint reroute on its own, or do I need to manually disable the affected replica? "What happens after the region recovers — does traffic return on its own?" — Is there a cooldown, a quarantine, or any manual step before failback? We answer those head-on, then go deeper on the operational details that come up when you actually run a geo-replicated registry: authentication across endpoint switches, throttling under load concentration, eventual-consistency failure modes, home region outage scope, webhooks, and private endpoint interaction. We draw on the official geo-replication docs, the global endpoint health-aware failover blog, the regional endpoints engineering design implementation, the regional endpoints public preview and private preview announcements, and the ACR reference for various registry endpoints, . This post also draws notes from the ACR product team on roadmap items that aren't yet documented elsewhere. Key Takeaways Health-aware failover is automatic. When the registry in a region degrades, the global endpoint reroutes away from it on the order of minutes, evaluated per-registry. No customer action required. Failback is automatic too. Once health-aware failover marks a region healthy again, the global endpoint resumes routing to it. There is no cooldown period. Health-aware failover applies only to global endpoint operations. It does not apply to regional endpoints (you're talking to one replica, period) or to dedicated data endpoints (the redirect is per-region). Health-aware failover is not triggered by throttling. It responds to regional ACR service health and Azure infrastructure health, not HTTP 429 responses. Use regional endpoints to manage per-replica throttling. Regional endpoints (Step 2a) give you explicit per-region URLs for workloads that need affinity, capacity planning, push/pull consistency, troubleshooting, or client-side failover. Use myregistry.<region>.geo.azurecr.io . Regional endpoints are available on Premium SKU registries. For workloads that don't need pinning, do nothing (Step 2b). The global endpoint plus health-aware failover handles routing automatically. Re-authenticate when switching endpoints. Each global or regional endpoint is its own authenticated surface; re-auth via az acr login , SDK auth, or the Kubernetes ACR credential provider on endpoint change. Don't run a long-lived DNS cache for the global endpoint. ACR purges DNS server-side on disable and during failover; a long-lived client cache works against that. For production workloads, enable dedicated data endpoints for security and DNS predictability on layer downloads. ACR is working on bounded staleness consistency for cross-replica eventual-consistency failure modes; see the FAQ. Background What is ACR geo-replication? Geo-replication is a Premium SKU feature that turns a single ACR registry into a multi-region, multi-write service. Every geo-replica in every region is writable — you can push, pull, and delete from any of them — and content syncs asynchronously between replicas under an eventual consistency model. Per-push replication time scales with the size and number of images being pushed. Similarly, when creating a new geo-replica, the time to populate the new geo-replica scales with the total size of the registry. A geo-replicated registry exposes a global endpoint at myregistry.azurecr.io . Behind that endpoint, ACR uses an internal traffic manager to direct each request to the replica with the best network performance profile for the caller — usually the closest replica, but not always. When clients are equidistant from multiple replicas, or when the closest replica is experiencing Azure infrastructure degradation, requests may be routed elsewhere. A geo-replicated registry also exposes a regional endpoint at myregistry.<region>.geo.azurecr.io , which allows clients to pin API requests to a specific geo-replica in lieu of global endpoints, which has Azure-managed routing among geo-replicas. Zone redundancy is always enabled for geo-replicas in regions where Azure has multiple availability zones — in those regions, ACR automatically spreads replica data across multiple availability zones within each region to protect against zonal outages. Endpoints and data endpoints: what goes where A common point of confusion: when you push or pull, not every request goes to the same place. The registry endpoints (global endpoint and regional endpoints), as well as the data endpoint, do different jobs. Your choice of data endpoint configuration has real consequences for security and resilience. Two kinds of traffic flow during a typical pull: Registry API traffic — authentication, manifest reads/writes, tag resolution, referrers, repository operations, blob location lookups, listing, metadata. This is everything except the actual layer (blob) bytes. All these API requests go to the global endpoint ( myregistry.azurecr.io ) or, if you've pinned your clients to call these APIs to a specific geo-replica, a geo-replica's regional endpoint ( myregistry.<region>.geo.azurecr.io ). Behind the scenes, the global endpoint internally proxies these requests to a specific geo-replica. Layer (blob) downloads — when the client asks for a blob, the registry doesn't serve the bytes itself. It returns an HTTP 307 redirect to a regional data endpoint (separate endpoint from the global endpoint or regional endpoints), and the client follows the redirect to download the layer from that region. Where that 307 sends you depends on whether you've enabled the registry's dedicated data endpoints feature: Configuration Layer downloads redirect to Default (no dedicated data endpoints) *.blob.core.windows.net (the underlying Azure storage account) Dedicated data endpoints enabled myregistry.<region>.data.azurecr.io for the region you were routed to Private endpoints enabled myregistry.<region>.data.azurecr.io for the region you were routed to Regional by design. Dedicated data endpoints always land you on a specific geo-replica's data endpoint — there is no "global data endpoint." With the global endpoint as your registry endpoint, the 307 redirect picks the data endpoint for whichever region the global endpoint chose to serve you. With a regional endpoint pinned to a specific region, the 307 always redirects you to that same region's data endpoint — never cross-region. Why dedicated data endpoints matter. Dedicated data endpoints are a Premium SKU feature that exists primarily to address security and firewall scoping. By default, layer downloads redirect to *.blob.core.windows.net — a wildcard storage FQDN. Firewall rules to allow that wildcard either let all Azure storage accounts through or none of them, which raises data exfiltration concerns and isn't tightly scoped to your registry. Dedicated data endpoints replace the wildcard with a fully qualified domain in your registry's own domain — myregistry.<region>.data.azurecr.io — so firewall rules can be scoped tightly to your specific registry, in your specific regions. That same design choice can also make layer downloads more predictable during routing changes. With dedicated data endpoints, the data endpoint FQDN is known ahead of time and lives in the registry's domain — one predictable hostname per region, configured once. Without them, the layer download has to resolve a wildcard storage FQDN that points to whichever storage account the registry happens to have provisioned, which is a separate DNS resolution path with its own routing behavior and its own caching profile. Dedicated data endpoints simplify the DNS picture by aligning the data path with the registry path and keeping the entire pull experience inside one set of predictable, scoped FQDNs. For any geo-replicated registry where security and high availability matter, enable dedicated data endpoints. Note: Health-aware failover applies only to operations against the global endpoint, not to regional endpoints or dedicated data endpoints. Take note that health-aware failover only kicks in and directs traffic away from a geo-replica when an Azure region is experiencing significant infrastructure degradation. At this stage, it does not kick in to redirect traffic to another geo-replica if a client's data plane API requests are throttled. See the relevant section below for the full scope when health-aware auto failover kicks in or not. The three traffic control tools ACR geo-replication gives you three complementary tools for controlling where traffic lands. Each one solves a different class of problem, and customers most often run into trouble when they reach for the wrong one. We name them up front and use these names throughout the post: Tool Who controls it What it does Use cases Health-aware failover Platform (automatic) Reroutes the global endpoint away from a region whose registry can't reliably serve requests Regional incidents, automatic recovery Replica enable/disable for global routing Customer (manual) Excludes a specific replica from global endpoint routing without deleting it; data continues syncing DR rehearsals, planned maintenance, quarantining a replica without losing it Regional endpoints Customer (per request) Dedicated per-region URLs ( myregistry.<region>.geo.azurecr.io ) that bypass the internal traffic manager entirely Pinning AKS clusters to co-located replicas, push/pull consistency, capacity planning, troubleshooting, client-side failover Health-aware failover and replica enable/disable both act on the global endpoint. Regional endpoints are a separate URL surface that coexists with the global endpoint — enabling them does not disable the global endpoint myregistry.azurecr.io . You can use both simultaneously and choose per workload. The behavior in question When the registry in one region experiences a real degradation, there are three possible answers to "what happens?": (A) Nothing automatic. The customer must manually disable the affected region's endpoint to stop traffic from being routed there. (B) The system detects the regional front-door failure and reroutes within seconds. (C) A per-registry health evaluation detects the degradation and reroutes the global endpoint within minutes, with no customer action. After the region recovers, routing resumes automatically. The answer today is (C). Before health-aware failover, customers were stuck closer to (A) — the system could see whether the regional reverse proxy responded, but not whether the registry could actually serve real pull and push traffic end to end. Health-aware failover closes that gap. We walk through all three tools in the next section, in order: setting up geo-replication, using regional endpoints to pin specific workloads, keeping the global endpoint for everything else, the manual replica disable mechanism, re-enabling participation in global routing, and what to expect when health-aware failover triggers. Walkthrough The following steps assume an existing Premium SKU registry and the Azure CLI logged in. We use myregistry as the registry name, myrg as the resource group, and eastus as the home region. Substitute <your-registry> , <your-rg> , and <your-region> for your environment. Prerequisites A Premium SKU ACR registry (geo-replication requires Premium) Azure CLI ( az ) installed and logged in For regional endpoints (Step 2a): Azure CLI 2.86.0 or later. All regional endpoints commands ( --regional-endpoints , az acr show-endpoints , az acr login --endpoint ) are available natively in Azure CLI 2.86.0+. If you previously installed the acrregionalendpoint private preview CLI extension, uninstall it with az extension remove --name acrregionalendpoint to prevent conflicts with the built-in CLI commands. Step 1: Add a West US replica to a registry that lives in East US Geo-replication requires the Premium SKU. The create call below fails on Basic or Standard. # Confirm the registry is Premium az acr show --name myregistry --resource-group myrg \ --query sku.name --output tsv # Premium # Create a West US geo-replica az acr replication create --registry myregistry --location westus # Confirm both replicas are present az acr replication list --registry myregistry --output table NAME LOCATION PROVISIONING STATE STATUS REGION ENDPOINT ENABLED ------ ---------- -------------------- -------- ----------------------- eastus eastus Succeeded online True westus westus Succeeded online True Pushes and pulls continue working through the existing replica throughout initial sync. Because the registry is multi-region, multi-write, the existing replica keeps serving traffic while the new replica catches up in the background. Initial replica seeding time is a function of registry size — the total number and cumulative size of images already in the registry that need to be replicated to the new replica — not the size of any single image. Step 2a: Pin workloads to specific regions using regional endpoints Use regional endpoints when a workload needs explicit per-region control. The five common cases: Regional affinity — an AKS cluster in East US should pull from the East US replica, every time, without ever hopping to a more distant replica because of a network performance fluctuation. Predictable routing — workloads that need to know exactly which replica will serve them, for benchmarking, capacity planning, or in-region traffic SLAs. Push/pull consistency — pinning both ends of a publish-then-deploy flow to the same replica eliminates eventual-consistency races. Troubleshooting — reproducing an issue on a specific replica requires sending traffic to that specific replica. Client-side failover — customers with their own health checks and business rules want to implement failover on their own terms, on signals only they can see. Enable regional endpoints on the registry: az acr update -n myregistry -g myrg --regional-endpoints enabled When enabled, ACR automatically creates per-region login server URLs for every existing geo-replica. No per-region configuration is needed. Note: Regional endpoints can be enabled on any Premium SKU registry, even without geo-replication. A registry without geo-replication has a single geo-replica in the home region, which gets one regional endpoint URL. However, the feature is most useful when your registry has at least two geo-replicas, where you can pin different workloads to different replicas for routing control and capacity distribution. Push to a specific region using its regional endpoint: # Log in to the West US regional endpoint az acr login --name myregistry --endpoint westus # Tag and push using the regional endpoint URL docker tag myapp:v1 myregistry.westus.geo.azurecr.io/myapp:v1 docker push myregistry.westus.geo.azurecr.io/myapp:v1 Pin AKS deployments to their co-located replica by using regional endpoint URLs in the deployment manifest. The example below shows two clusters in different regions; each cluster references the regional endpoint for its own region's replica (assuming replicas exist in both eastus and westeurope ): # East US-based AKS cluster pulls from the East US replica apiVersion: apps/v1 kind: Deployment metadata: name: myapp-eastus spec: template: spec: containers: - name: myapp image: myregistry.eastus.geo.azurecr.io/myapp:v1 --- # West Europe-based AKS cluster pulls from the West Europe replica apiVersion: apps/v1 kind: Deployment metadata: name: myapp-westeurope spec: template: spec: containers: - name: myapp image: myregistry.westeurope.geo.azurecr.io/myapp:v1 This eliminates cross-region pulls when global routing would otherwise prefer a different replica for a given client, and it gives you a per-region traffic profile you can plan capacity against. Regional endpoint operational tips View all endpoints. Use az acr show-endpoints to see all endpoint URLs for your registry — global, regional (if enabled), and dedicated data endpoints (if enabled): az acr show-endpoints --name myregistry --resource-group myrg Import from a specific geo-replica. When importing images between registries, you can use a regional endpoint to import from a specific geo-replica of the source registry. This is useful when you want predictable network paths or need to import from a replica in a specific region: az acr import \ --name mydownstreamregistry \ --source myupstreamregistry.westeurope.geo.azurecr.io/myapp:v1 \ --image myapp:v1 Firewall rules for regional endpoints. If you use firewall rules, allow access to the following endpoints for each geo-replica that clients connect to: Endpoint Purpose myregistry.<region>.geo.azurecr.io Regional endpoint for registry operations myregistry.azurecr.io Global endpoint (if also used) myregistry.<region>.data.azurecr.io Layer downloads (if using private endpoints or dedicated data endpoints) *.blob.core.windows.net Layer downloads (if not using private endpoints or dedicated data endpoints) For the full list of endpoint types and FQDN patterns, see the ACR reference for various registry endpoints. DNS-based routing without changing manifests. If you don't want to maintain different deployment manifests per region, you can keep all manifests pointing to the global endpoint ( myregistry.azurecr.io ) and use software-defined networking or a regional traffic manager to resolve the global endpoint to the appropriate regional endpoint based on the originating region's traffic. This achieves the same co-location goals as regional endpoints — predictable routing and reduced latency — without embedding region-specific URLs in your deployment manifests. Step 2b: Keep using the global endpoint for everything else For workloads that don't need explicit pinning, do nothing. The global endpoint at myregistry.azurecr.io continues to work exactly as before, and the global endpoint plus health-aware failover gives you intelligent routing across replicas without configuration. ACR picks the best replica for each client based on network performance and reroutes during regional incidents. Regional endpoints coexist with the global endpoint — enabling them does not disable myregistry.azurecr.io . You can use both simultaneously and choose per workload, mixing pinned workloads (Step 2a) with workloads that ride the global endpoint (Step 2b) in the same registry. Step 3: Take a replica out of global endpoint routing Use this when you need to keep a replica alive but stop it from serving global-endpoint traffic — for DR rehearsals, planned maintenance, or troubleshooting an isolated replica. # Exclude the West US replica from global endpoint routing az acr replication update --registry myregistry --name westus \ --global-endpoint-routing false Confirm the change: az acr replication list --registry myregistry --output table NAME LOCATION PROVISIONING STATE STATUS REGION ENDPOINT ENABLED ------ ---------- -------------------- -------- ----------------------- eastus eastus Succeeded online True westus westus Succeeded online False Requests to myregistry.azurecr.io no longer route to West US. The replica still receives replicated content — and continues to replicate its own content out to other replicas — and storage quota and per-replica costs continue to accrue. If regional endpoints are enabled, the West US regional endpoint URL also continues to work; --global-endpoint-routing controls only the replica's participation in global endpoint routing. A note on naming. The CLI flag --global-endpoint-routing (on az acr replication update ) and the regional endpoints feature (enabled via az acr update --regional-endpoints enabled ) are two different things despite the similar names. --global-endpoint-routing controls whether a replica participates in global endpoint routing. The regional endpoints feature creates per-region URLs ( myregistry.<region>.geo.azurecr.io ) that bypass the global endpoint entirely. They are independent controls. In Azure CLI 2.86.0 and later, the old --region-endpoint-enabled flag has been renamed to --global-endpoint-routing . The old flag name is deprecated and will be removed in Azure CLI 2.87.0 (June 2026). If you have existing scripts or automation that use --region-endpoint-enabled , update them to use --global-endpoint-routing . CLI flags quick reference: Flag Scope Purpose --regional-endpoints Registry-level ( az acr create or az acr update ) Enables dedicated regional endpoint URLs ( myregistry.<region>.geo.azurecr.io ) for all geo-replicas. --global-endpoint-routing Per-geo-replica ( az acr replication create or az acr replication update ) Controls whether the global endpoint routes traffic to a specific geo-replica. Set to false to temporarily exclude a geo-replica from global routing. --data-endpoint-enabled Registry-level ( az acr create or az acr update ) Enables dedicated data endpoints ( myregistry.<region>.data.azurecr.io ) for layer blob downloads. Auto-enabled when at least one private endpoint is configured. This bidirectional sync during disable is intentional. When you re-enable the replica, every image pushed to the registry while the replica was disabled — from any region — is already present, so the replica can serve traffic immediately with no catch-up window. If we stopped syncing on disable, re-enabling would leave the replica with stale data and force a long catch-up before it could safely serve pulls. Step 4: Re-enable the replica to participate in global endpoint routing Re-enable the replica: az acr replication update --registry myregistry --name westus \ --global-endpoint-routing true NAME LOCATION PROVISIONING STATE STATUS REGION ENDPOINT ENABLED ------ ---------- -------------------- -------- ----------------------- eastus eastus Succeeded online True westus westus Succeeded online True There is no cooldown. The global endpoint resumes routing requests to the West US replica as soon as the change takes effect on ACR's side. Because data continued syncing while the replica was disabled (Step 3), the replica is immediately ready to serve pulls — no catch-up window. Note on DNS during disable/enable. When you take a replica out of global routing, ACR purges its own DNS records for that replica from the global endpoint on a fast path — there is no waiting on a published TTL on ACR's side. If clients run their own DNS cache for the global endpoint, however, those clients will keep resolving to the disabled replica until the client cache expires. We can't control client-side caches. The recommendation: do not run a long-lived DNS cache for the global endpoint. A short-lived DNS pin for the duration of a single push (covered in the DNS and Client-Side Considerations section) is fine and even helpful — but a long-lived DNS cache will make --global-endpoint-routing false look broken from the client's perspective. Step 5: What to expect when health-aware failover triggers Health-aware failover is automatic. ACR evaluates registry health on a per-registry basis, and when a registry in a region can't reliably serve requests, the global endpoint reroutes that registry's traffic to a healthy replica. There is no customer-invocable trigger — that's the point. End-to-end timing is on the order of minutes — fast enough to catch real regional degradation, slow enough to ride out transient errors that resolve on their own. DNS TTL may add additional propagation delay before all clients switch to the new region. Scope of health-aware failover. Health-aware failover applies only to operations against the global endpoint — the registry API calls (auth, get manifest, get tag, get referrers, get blob location). It evaluates health when those API calls come in; it does not trigger mid-operation. Two important consequences: Regional endpoints are not in scope. When you talk to a regional endpoint like myregistry.westus.geo.azurecr.io , you're talking to that one replica. There is no automatic reroute. If you've pinned a workload to a regional endpoint and that region degrades, you implement client-side failover by switching the workload to a different regional endpoint. Dedicated data endpoints are not in scope. Once a registry endpoint has redirected you to a dedicated data endpoint, you stay on that region's data endpoint for the duration of the layer download. There is no automatic reroute of an in-flight blob download. The region targeted by the redirect is decided up front by whichever registry endpoint served the blob-location call: the global endpoint chooses based on its per-registry health evaluation, and a regional endpoint always targets its own region. The signals you can use to confirm a failover is in progress: # Check replication status az acr replication list --registry myregistry --output table You can also check Resource Health for the registry in the Azure portal — navigate to your registry and select Resource health under the Help section to see platform-side degradation signals. You'll typically see: Increased pull latency as traffic shifts to a more distant replica Resource Health flagging known issues in the affected region Replication status indicating which replicas are online After the region recovers, the per-registry health evaluation marks it healthy again and the global endpoint resumes routing — automatic, no cooldown, no customer action. Note that health is evaluated per registry, not per region: if a degradation affects only a subset of registries in a region, only those registries are rerouted, and other registries in the same region continue to be served locally with no unnecessary latency penalty. Not triggered by throttling. Health-aware failover is DNS-based and responds to regional ACR service health and Azure infrastructure health. It does not reroute traffic based on HTTP 429 (throttling) responses. If a geo-replica is throttling your requests but the region's infrastructure is healthy, the global endpoint continues routing you to that geo-replica. To manage throttling, use regional endpoints to spread workloads across multiple geo-replicas for better capacity distribution. Note on long-running pushes during a failover. A multi-layer push that spans a failover boundary can land layers and the manifest on different replicas — exactly the failure mode that DNS bouncing produces during a single push. ACR is actively tightening health-aware failover behavior to minimize cross-replica scatter during these scenarios, and the recommendation today remains: pin pushes to a single replica via a regional endpoint when push/pull consistency matters. Common Questions Q1. Performance impact during initial replica creation on a live registry Because ACR is multi-region, multi-write, the existing replica continues serving pull and push traffic throughout the period when a new replica is being seeded. Replication is asynchronous and content propagates in the background; the time to populate a new geo-replica scales with the size of the registry — the cumulative number and total size of images already in the registry — not with any single image. The docs do not publish a quantified degradation percentage or a throttling window for this period, and they do not promise zero performance impact — the safe operating assumption for a live production registry is that existing replicas continue serving traffic normally, with the new replica catching up in the background. Q2. Restricted/updating state during initial sync There is no "restricted" state for the registry during normal replica creation. Writes, control-plane operations, and pushes/pulls against existing replicas continue normally. The only time configuration changes are unavailable is during a home region outage — see the relevant FAQ item later on for the full data-plane-versus-control-plane breakdown. Q3. Cooldown periods and non-straightforward failback scenarios There is no cooldown before failback, manual or automatic. Re-enabling a replica's participation in global endpoint routing takes effect immediately on ACR's side. Health-aware failover returns traffic to a region as soon as its per-registry health evaluation passes again. The failback case that is not seamless: if a recently pushed image has not yet replicated to the failover region, a pull from that region may not find the image until replication catches up. This is a function of eventual consistency, not failback timing — and it's part of a broader class of issues we cover in Q4. Q4. Common pull and push failure modes during the eventual-consistency window DNS bouncing during a single push is one well-known problem, but it isn't the only one. The eventual-consistency window between geo-replicas surfaces in several recurring failure modes worth knowing about: Push-then-immediate-pull-cross-region. Pushing myapp:v1 to one region and immediately pulling it from a different region can fail with manifest unknown until replication catches up. This shows up most painfully in CI/CD pipelines where one CI runner pushes an image and thousands of pods across other regions all try to pull from their local geo-replicas at the same time. Today, customers work around this with indeterminate sleeps before scheduling expensive compute, or with retry logic, or by waiting on a replication-complete signal — none of which is a clean planning story. Tag overwrite races. Pushing myapp:v1 , then re-pushing myapp:v1 shortly after with a fix (same tag, different digest), can leave different replicas resolving the same tag to different digests during the eventual-consistency window. Delete propagation. Deleting a tag or repository in one region takes some time to propagate to other replicas. Pulls from regions where the delete hasn't yet propagated can return the supposedly-deleted content. Mid-push failover scatter. A multi-layer push that spans a health-aware failover boundary or a DNS bouncing event can land layers on one replica and the manifest on another, surfacing as manifest validation errors or blob unknown on subsequent pulls. What ACR is doing about this. We're working on bounded staleness consistency for pushed images across all geo-replicas worldwide, which addresses these four failure modes directly. This will be covered in an upcoming blog post. If you're hitting eventual-consistency brittleness today and want to talk through your scenario, reach out to us on the Azure Container Registry GitHub repository — we want the customer signal to land in the design. Mitigations available today: Pin pushes to a single replica via a regional endpoint. Every sub-request in the push — login, blob uploads, manifest upload — goes to the same replica, eliminating the DNS bouncing and mid-push scatter classes entirely. Use a short-lived client-side DNS cache like dnsmasq scoped to the duration of a single push, only when you're not using regional endpoints. Do not run a long-lived DNS cache for the global endpoint — it interferes with --global-endpoint-routing false and with health-aware failover routing. Build retry logic into pulls that immediately follow a cross-region push. Either retry with backoff or check replication status with ACR webhooks before pulling. ACR can detect and notify you when an image or tag is available for pull in a geo-replica (say geo-replica B), after it has been pushed to another geo-replica (geo-replica A) and background replication has succeeded to geo-replica B. Design publish steps to be idempotent so retries triggered by mid-push failover are safe. Q5. Auth behavior across endpoint switches For safety, treat each global endpoint and each regional endpoint as its own authenticated surface. All registry APIs except the actual blob downloads (auth, manifests, tag resolution, referrers) flow through whichever endpoint you've chosen. If you switch from the global endpoint to a regional endpoint, or from one regional endpoint to another, re-authenticate. That means az acr login , fresh SDK auth, or — for AKS — letting the Kubernetes ACR credential provider handle re-auth, which it does automatically when the endpoint changes. Q6. Throttling under failover and pinning Throttling limits on registry API operations are per-replica, not per-registry. This has two operational implications: During health-aware failover, traffic that was spread across replicas can shift heavily onto whichever replicas remain in the global endpoint's routing pool. Capacity plan to spread traffic across two or three healthy replicas during a failover scenario rather than concentrating onto one — the global endpoint's routing already does this for you when multiple healthy replicas exist, but registries with only two regions configured can hit per-replica limits more easily during a failover. To mitigate, use regional endpoints to spread workloads across multiple geo-replicas and plan per-replica capacity. When pinning via regional endpoints (Step 2a), you concentrate traffic on whichever replica you've pinned to. If you've pinned all your AKS clusters to a single regional endpoint, you may hit that replica's per-region throttling limits at peak. Mitigations: pin different workloads to different regional endpoints across multiple regions for better topology mapping and capacity distribution, or use the global endpoint (Step 2b) for workloads where you don't need explicit pinning so ACR's routing can spread load. We're also working on improving the throttling metrics surfaced during health-aware failover events. Note: Health-aware failover does not reroute traffic based on HTTP 429 (throttling). If you're experiencing throttling but the region's infrastructure is healthy, the global endpoint continues routing you there. Use regional endpoints to explicitly spread load across replicas for capacity planning. Q7. Home region outage scope Geo-replication provides high availability for the data plane. During a home region outage, the control plane is unavailable, which means you can't create or delete replicas, modify network rules, or change replication settings until the home region recovers. ACR Tasks are also bound to the home region and don't run while it's unavailable. The data plane keeps working: Global endpoint continues routing pulls and pushes to healthy replicas. Regional endpoints continue working — you talk directly to specific replicas, and your client-side logic decides which region to use. Authentication, manifests, blob downloads, webhooks continue functioning through any healthy replica. The home region of a registry is fixed at creation and cannot be changed afterward. Microsoft's registry relocation guidance describes a redeployment procedure — creating a new registry in a different region — not an in-place change to an existing registry's home region. Note: If your registry uses a customer-managed key, review the key vault failover and redundancy guidance for maximum resilience. Key vault availability directly affects the registry's ability to encrypt and decrypt data. Q8. Webhooks during failover Webhooks fire from the replica that received the push. Because ACR also replicates content to other geo-replicas, webhooks fire from each geo-replica as the image syncs to it — so a single push results in webhook events from the receiving replica plus an event from each replica as replication completes. During a failover where pushes are routed to a different region, webhooks from those pushes fire from the new region; once the original region recovers and replication catches up, webhook events fire from there too. Webhook consumers should be designed to handle multiple events per pushed image and deduplicate as needed. Q9. Private endpoints with regional endpoints and dedicated data endpoints When a private endpoint is created against a registry, the private endpoint covers all of the registry's endpoint surfaces — the global endpoint, every regional endpoint (if regional endpoints are enabled), and every regional dedicated data endpoint. A single private endpoint in one VNet can reach the global endpoint (which routes you to a suitable replica), any regional endpoint in the same or a different region, and any region's dedicated data endpoint for blob downloads. The trade-off is private IP allocation: each endpoint surface consumes IPs in the VNet. With many replicas plus regional endpoints plus dedicated data endpoints all enabled, private endpoint creation can fail if the VNet runs out of available private IPs. IP address consumption per feature: Configuration IPs consumed per VNet Initial private endpoint (global endpoint + home region dedicated data endpoint) 2 Each geo-replication region added +1 (regional dedicated data endpoint) Regional endpoints enabled +1 per geo-replica Example: A registry with 3 geo-replicas and regional endpoints enabled consumes 7 private IPs per VNet: 1 (global) + 3 (data) + 3 (regional). Without regional endpoints, the same registry requires 4 private IPs: 1 (global) + 3 (data). Subnet sizing: Use at minimum a /27 (32 addresses) subnet for PE subnets on geo-replicated registries, and /24 where possible. To check how many private IPs are already consumed on a subnet: az network vnet subnet show \ --name <subnet-name> \ --vnet-name <vnet-name> \ --resource-group <resource-group> \ --query "{addressPrefix:addressPrefix, usedIPs:length(ipConfigurations || \`[]\`)}" \ --output table See the ACR private endpoints documentation for the full IP-allocation math and sizing guidance. Q10. Geo-replica creation stuck for private endpoint-enabled registries When creating a geo-replica for a registry that has private endpoints configured, the replica provisioning can get stuck in a Creating state if the identity performing the operation doesn't have sufficient permissions to create private endpoint networking resources. Solution: Manually delete the geo-replica that got stuck in the provisioning state. Ensure the identity has the permission Microsoft.Network/privateEndpoints/privateLinkServiceProxies/write before creating the geo-replica again. Also verify that every PE subnet connected to the registry has free IP capacity — if any PE subnet across any connected VNet does not have enough free IPs, the replication provisioning fails and rolls back. The replica appears briefly in a Creating state and then is removed. The resulting error does not identify which subnet or VNet is exhausted. Q11. Metrics, logs, and alerts for the three phases We map each phase to the signals available in the Monitoring Guidance section below. The headline: Resource Health (in the Azure portal) and az acr replication list give you the platform-side signals; Azure Monitor platform metrics are collected automatically, and resource logs require Diagnostic Settings to be enabled on the customer side. Behavior summary Scenario Automatic? Customer Action Required Notes Registry in a region degrades Yes None Health-aware failover; per-registry; minutes-scale; global endpoint operations only Region recovers after a degradation event Yes None No cooldown Pin AKS clusters to co-located replicas No Use regional endpoint URLs in deployment manifests (Step 2a) Coexists with global endpoint No pinning needed for most workloads Yes None — keep using myregistry.azurecr.io (Step 2b) Global endpoint plus health-aware failover Push/pull from the same replica (consistency) No Use a regional endpoint for both push and pull Eliminates DNS bouncing and mid-push scatter Capacity planning per region No Spread workloads across multiple regional endpoints Per-replica throttling; avoid concentrating on one replica DR rehearsal: take a replica out of global routing No az acr replication update --global-endpoint-routing false Data continues syncing both directions; costs continue accruing Re-enable replica participation in global routing No az acr replication update --global-endpoint-routing true No cooldown; replica is immediately ready Switch a workload between endpoints No Re-auth ( az acr login , SDK auth, or Kubernetes ACR credential provider) Each endpoint is its own authenticated surface Initial replica seeding on a live registry N/A None Existing replica continues serving traffic; seeding time scales with registry size Long-running push during a failover No Retry; design publishes to be idempotent Pin via regional endpoint to avoid mid-push scatter; ACR is tightening this behavior Pull of a recently pushed image from a different region No Wait for replication, retry with backoff, or check replication status Eventual consistency; bounded staleness consistency in development Home region outage Data plane: yes; control plane: no Use global or regional endpoints for data plane operations Control plane (replica config, network rules) requires home region DNS and Client-Side Considerations DNS bouncing during a single push is the most common geo-replication push problem in customer threads, and it warrants a section of its own. The failure mode. A docker push is a sequence of HTTP requests: blob uploads for each layer, then a manifest upload that references those layers by digest. If the Linux DNS resolver on the client doesn't cache myregistry.azurecr.io consistently for the duration of the push, individual sub-requests can resolve to different replicas. Because replication is eventually consistent, the manifest can land on a replica that doesn't yet have the layers it references, and the manifest validation fails. The two mitigations: Regional endpoints pin the push to a single replica end-to-end. Every sub-request — login, blob uploads, manifest upload — goes to the same replica. This is the cleanest fix and the one we recommend for any pipeline where push/pull consistency matters. A short-lived client-side DNS cache like dnsmasq scoped to the duration of a single push. For Linux VMs in Azure, follow the DNS name resolution options guidance. The pin should last the push and no longer. For other clients performing pushes, you can customize your stack's DNS resolver to have a similar short-lived DNS cache to pin the global endpoint's resolved DNS for only the duration of an image push operation. A note on long-lived DNS caching for the global endpoint. Don't run a long-lived DNS cache for myregistry.azurecr.io . ACR purges its own DNS records on the server side when a replica is taken out of global routing (Step 3) and during health-aware failover; a long-lived client-side cache will keep clients pointed at the old region after our purge, which makes both the manual disable mechanism and health-aware failover look broken from the client's perspective. Retry behavior: In-flight pushes during a failover may fail. Design publish steps to be idempotent so retries are safe. Pipelines that push in one region and immediately pull from a different region should retry with backoff or check replication status — eventual consistency means the pull may race ahead of replication. ACR is working on bounded staleness consistency that addresses this directly by enabling proxying (on ACR infrastructure) an image pull request from one geo-replica (if it does not have the image) to another geo-replica that has the image; see the relevant FAQ item. Note: Specific retry counts, back-off intervals, and push timeout values are application-layer decisions. The platform behavior is documented; the retry policy belongs to your client. Monitoring Guidance We map the three phases to the signals available from each source. Where a signal requires customer-side configuration, we flag it. Phase A: Initial replication (after creating a new replica) az acr replication list and az acr replication show — confirm the new replica reaches provisioningState: Succeeded and status: online , and view per-replica status. Azure Monitor platform metrics — push count, pull count, and other registry metrics are collected automatically and visible in the Azure portal under Metrics. No customer configuration is needed to view platform metrics. To export metrics or enable resource logs (detailed operation logs), configure Diagnostic Settings on the registry. Phase B: Failover (planned via replica disable, or automatic via health-aware failover) Per-replica regionEndpointEnabled state via az acr replication list — confirms whether a manual disable took effect, i.e. which replicas are currently eligible for global endpoint routing. Note: this flag reflects the manual configuration for configuring a geo-replica's global endpoint routing eligibility; it does not indicate whether health-aware failover has actively rerouted traffic away from a replica. Resource Health for the registry (in the Azure portal under Help > Resource health) — surfaces platform-side degradation signals during incidents. ACR does not yet expose a definitive "this region is currently serving your traffic" signal; Resource Health and client-side latency changes are the best available indicators. Pull latency from clients — increased latency from a more distant replica is the client-observable signal that traffic has rerouted. Azure Monitor platform metrics — visible per-region in the Azure portal Metrics blade. To export metrics or query them programmatically, enable Diagnostic Settings. Phase C: Failback (replica returns to global routing) az acr replication list — confirms regionEndpointEnabled: True (manual) or online status across all replicas (automatic). Pull latency normalizing as clients reach the recovered replica again. Resource Health clearing for the registry (visible in the Azure portal). Note: The health-aware failover blog calls out ongoing work to surface richer signals — including notifications for when routing changes and which region is currently serving your traffic. The signals listed above are what's available today. Pricing Considerations Storage billing vs. storage quota: Storage is billed per geo-replica — a 1 GiB image replicated to 5 geo-replicas is charged as 5 GiB of storage (1 GiB × 5 geo-replicas). However, storage quota (the tier's maximum storage limit) counts the image only once — the same 1 GiB image counts as 1 GiB toward your tier's maximum, not 5 GiB. Data transfer: Geo-replication can reduce costs by enabling in-region image pushes and pulls, which avoids cross-region data transfer charges during these push or pull operations. However, cross-region data transfer charges still apply when ACR replicates pushed content to other geo-replicas as part of eventual consistency. Disabled replicas still cost: When you take a replica out of global routing with --global-endpoint-routing false , storage and per-replica costs continue accruing because data continues syncing bidirectionally. For more information, see ACR pricing. Cleanup Run these commands to undo the walkthrough setup. Order matters: disable regional endpoints before deleting replicas, since regional endpoint URLs depend on which replicas exist. # Disable regional endpoints if you enabled them in Step 2a az acr update -n myregistry -g myrg --regional-endpoints disabled # Re-enable any replicas you disabled in Step 3 (no-op if already enabled) az acr replication update --registry myregistry --name westus \ --global-endpoint-routing true # Delete the West US replica created in Step 1 az acr replication delete --registry myregistry --name westus # Confirm only the home region replica remains az acr replication list --registry myregistry --output table Note: Replica deletion is a control-plane operation that requires the home region to be available. During a home region outage, replica configuration cannot be modified. Summary Table Question Answer When should I use regional endpoints vs the global endpoint? Use regional endpoints (Step 2a) for workloads that need affinity, predictable routing, push/pull consistency, troubleshooting, or client-side failover. Use the global endpoint (Step 2b) for everything else and let health-aware failover handle routing. What should I enable for secure, resilient layer downloads? Enable dedicated data endpoints. They scope firewall rules tightly to your registry and replace wildcard storage DNS with predictable per-region FQDNs. How do I avoid DNS-bouncing manifest validation failures on push? Pin pushes to a single replica via a regional endpoint. A short-lived client-side dnsmasq for the push duration is also fine if you're not using regional endpoints. Should I run a long-lived DNS cache for the global endpoint? No. ACR purges DNS server-side on disable and during failover; client-side caching works against that. Do I need to re-auth when switching endpoints? Yes. Each global or regional endpoint is its own authenticated surface. az acr login , SDK auth, or the Kubernetes ACR credential provider handles the re-auth. What happens during a home region outage? Data plane keeps working through any replica via the global endpoint or regional endpoints. Control plane operations (replica configuration, network rules) are unavailable until the home region recovers. The home region is fixed at registry creation. What's ACR doing about eventual-consistency pain? Bounded staleness consistency for cross-replica pushed images is in development and will be covered in an upcoming blog post. Reach out via GitHub if you want to share your scenario. For the full automation matrix — what's automatic, what requires customer action, and what to expect for each scenario — see the behavior summary above. If you have further questions about ACR geo-replication routing, pinning, capacity planning, eventual consistency, or failover behavior, reach out to us on the Azure Container Registry GitHub repository or file feedback through the Azure portal.404Views0likes0Comments