apps & devops
67 TopicsSkill or Sub-Agent. Choosing AI Capabilities You Will Actually Reuse
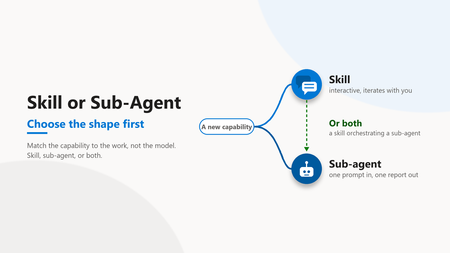
Audience: Cloud architects, platform engineers, engineering leaders The wrong first question Most teams building AI capabilities start with the wrong question. They ask which model to use. The model matters less than the shape of the capability around it. The first real fork is this. Are you building a skill or a sub-agent? Get that wrong and no model choice will save you. A skill and a sub-agent are two different delivery shapes, and each one fails at the other one's job. The insight The choice between a skill and a sub-agent is not about model power. It comes down to four checks. How the work iterates, whether the output carries a voice, how far an early wrong turn spreads, and how often it recurs. Score each, count which way they lean, and the shape falls out. An even split means build both, and let the skill drive the sub-agent. The three sections below take the checks worth a pause. Frequency is the plain one: a one-off craft piece leans to a skill, a repeatable batch job to a sub-agent. A skill lives inside the conversation. It reads files, asks a question, refines with the author, and keeps a human in the loop mid-flight. A sub-agent takes one prompt, runs to completion, and returns one report. Both are useful, for different work. Dimension Skill Sub-agent Iteration Conversation, many turns One hand-off, one pass Voice Holds a style profile and applies it Drifts toward generic by design Human gate Every turn Once, at the end Best for Craft, subjective output Bounded, structured output Table 1. The same three dimensions decide the shape every time. 1. Decide the iteration model first Before anything else, architects should ask how the work actually happens. Is it a conversation or a hand-off? That single answer removes most of the ambiguity. Craft work needs back and forth Batch work needs one clean pass Conversations need memory of the thread Hand-offs need a bounded input and a clear output A skill is right when the value comes from iteration. A blog post, a design review, a tricky refactor. A sub-agent is right when the work is well defined and the output is the deliverable. In practice The pattern that works: use a skill when the team expects three or four rounds of "close, but change this". The trade-off: a skill costs more attention per run because a human stays involved. The trap to avoid: forcing iterative craft into a one-shot agent and then editing the output by hand every time. 2. Voice fidelity decides craft work Some outputs have a voice. An article, a customer email, an architecture narrative. Others do not. A query result, a data export, a status summary. The line between them is not cosmetic. It decides which shape survives review. Voice-heavy work favours a skill Voice-neutral work favours a sub-agent Skills can hold a style profile and apply it Sub-agents drift toward generic by design When the output carries a name, fidelity is the whole game. A capable model with no voice anchor produces text that reads like it came from a committee. In practice The pattern that works: give a skill an explicit voice profile with banned phrases and cadence rules. Let it self-check before it shows anyone anything. The trade-off: the profile takes real effort to write once. The trap to avoid: expecting a stateless agent to match a personal style from a single prompt. Implementation note A voice profile is not documentation. It lives in the skill definition, an executable contract the skill checks itself against before a draft is ever shown. A small profile goes a long way. # voice-profile (excerpt) banned_phrases: [seamless, robust, game-changing, leverage the power] forbid: [em-dash, semicolon, exclamation in body] max_avg_sentence_words: 20 require: - one "In practice" block per section - a closing discussion question self_check: run before any draft is shown to a human 3. Put the human gate where the risk is Every AI capability needs a human review gate. The design question is where that gate sits. Placement is the difference between catching a problem early and unpicking it later. Skills gate continuously, turn by turn Sub-agents gate once, at the end Continuous gates catch drift early End gates are cheaper but riskier for craft If a wrong turn early corrupts everything after it, the team wants a skill. If the work is bounded and a bad output is easy to spot and discard, an end gate is fine. In practice The pattern that works: match the gate to the blast radius. High blast radius and subjective quality point to a skill. Low blast radius and objective output point to a sub-agent. The trap to avoid: a one-shot agent doing forty minutes of unattended work that a human then has to unpick. 4. The pattern that scales is both The mature answer is not one or the other. It is a skill on top of a sub-agent. The two shapes compose cleanly when each one keeps to its own job. The skill orchestrates and holds the voice The sub-agent executes bounded sub-tasks The human reviews at the skill layer Each layer does what it is good at Figure 1. In the combined pattern the human reviews at the skill layer, and the sub-agent only touches the bounded task. The skill runs the conversation and keeps quality. When it needs a bounded, repeatable job done, it delegates to a sub-agent. The result is iteration where craft lives and automation where the work is mechanical. In practice The pattern that works: a skill drafts and refines an article with the author, and calls a sub-agent to fetch and summarise reference material. The trade-off: two layers are more to build than one. The trap to avoid: collapsing both into a single agent and losing either the voice or the automation. The operational trade-offs Shape is not only a design choice. It shows up in cost, latency, and how you debug a bad run. Architects should price these in before committing to a pattern. A skill spends more tokens and more human minutes per run A sub-agent spends compute once and returns fast A skill fails in small, visible steps you can correct A sub-agent fails as one block you inspect after the fact The cost of a skill is attention. Someone stays in the loop and that time is real. The cost of a sub-agent is rework. When a one-shot run goes wrong, the whole output is suspect and someone redoes it. Observability follows the same split. A skill leaves a turn-by-turn trail you can read. A sub-agent leaves one input and one output. You instrument the boundary and log the prompt and the result. Pick the shape whose failure mode your team can afford. The wrong shape does not announce itself. It shows up later as a cost line or a rewrite. Two capabilities, one team Consider a team standardising its engineering work with AI. Two capabilities land on the backlog in the same week. The first is recurring status queries. Well defined input, structured output, no voice. A stateless sub-agent fits. One prompt in, one report out, gate at the end. It works on day one and keeps working. The second is authored technical content. Subjective, voice-heavy, many rounds of refinement. The reflex is to reuse the sub-agent that just shipped. That reflex is the mistake. The queries stay clean. The content reads flat and generic, and every draft needs a heavy human rewrite. Rebuilt as a skill with a voice profile and a turn-by-turn gate, the same work compounds instead of fighting back. Same team, same models, two different shapes of work, and only one right tool for each. What teams get wrong The common pattern is defaulting to whichever shape the team built first. A team ships one sub-agent, likes it, and forces every new problem into a sub-agent. Or it builds one skill and runs everything as a conversation, including batch work that should be automated. It looks like consistency. It feels like reuse. But it leads to craft work that reads generic and batch work that needs babysitting. The fix is not a better model. It is naming the shape of the work before picking the tool. The three shapes to watch for in your own stack: A voiced deliverable coming out of a one-shot agent, rewritten by hand every run. A skill wearing a sub-agent costume. A batch job run as a conversation and babysat turn by turn. A sub-agent wearing a skill costume. A large workflow forced into one agent that holds neither the voice nor the automation. Two shapes collapsed into one. Name which one you are looking at, and the fix picks itself. A quick way to decide When a new capability lands on the backlog, run four checks before picking a tool. Iteration: conversation or one hand-off Output: subjective and voiced, or structured and neutral Blast radius: does an early wrong turn corrupt the rest Frequency: a one-off craft piece, or a repeatable batch job Three or more answers leaning subjective and iterative point to a skill. Three or more leaning structured and repeatable point to a sub-agent. A split answer usually means a skill orchestrating a sub-agent underneath. Figure 2. Score the four checks and count the leanings. Three or four one way pick the shape. An even split means a skill orchestrating a sub-agent. Where to start depends on what you have already built The framework is the destination. Where you start depends on what your team has shipped so far. Find your stage and take the one first move for it this week. Stage First move, this week Watch out for Just starting, nothing built yet Pick the single task you repeat most and write a one-paragraph capability brief for it, iteration, output, blast radius, and frequency, before you build. The brief names the shape, and the shape names the tool. Building a general assistant before you have named one concrete job. One capability, reused for everything List every job you push through the one tool, find the one whose shape does not match, and rebuild just that one in the right shape. You do not need to replace what works. Forcing new work into the tool you already have. A small fleet, a handful of capabilities Take your largest layered workflow and split it, a skill that holds the voice and the human gate on top, a sub-agent that does the bounded work underneath. Capabilities that duplicate each other with no composition between them. Table 2. Same framework, different first move. What you have already built decides where the leverage is this week. Your setup also shapes the answer. A solo builder should optimise for their own voice and iteration speed, where one strong skill beats three thin ones. A platform team should standardise the capability brief and a shared voice profile, so the fleet stays consistent as more people add to it, and a new capability inherits the house style instead of drifting from it. Figure 3. Whatever you have built so far, the first move has the same shape. Name the work before the tool, then match the shape to the tool. The shift The shift is from "what can the model do" to "what shape is the work". Model capability is table stakes now. The advantage is in matching the capability to the work. Our own capability fleet is built this way, interactive skills and autonomous sub-agents in separate places with an orchestrator on top, and that split is what keeps it maintainable as it grows. Iterative and voice-heavy points to a skill. Bounded and mechanical points to a sub-agent. Large and layered points to a skill orchestrating sub-agents. Decide that first, and the model becomes a detail the team can change later without rebuilding anything. Most teams collapse both ideas into "automation" and end up with neither. The teams that separate them build capabilities they actually reuse. Want to discuss? Drop a comment with patterns you have seen in your environment. I read every reply.1.2KViews0likes4Comments
Revolutionizing Document Intelligence: Scaling Construction Industries with AI-Driven Extraction
Introduction Generative AI (GenAI) is poised to transform the construction industry by addressing chronic challenges such as low productivity, cost overruns, schedule delays, and labor shortages. By automating the analysis of drawings, specifications, contracts, and project documentation, GenAI can reduce manual effort, accelerate decision-making, and improve coordination across architects, engineers, contractors, and suppliers. Industry studies indicate that AI-powered workflows can increase productivity by 20–40% in planning, engineering, and administrative functions while reducing costly rework and errors. The result is faster project delivery, improved resource utilization, lower costs, and more predictable project outcomes. A major opportunity for GenAI in construction lies in its ability to unlock the vast amount of information trapped within AutoCAD drawings, architectural plans, BIM models, specifications, and engineering documents. Today, project teams spend countless hours manually reviewing drawings, performing quantity takeoffs, identifying dependencies, and translating design intent into actionable work packages for downstream trades. GenAI can automate this process by extracting and interpreting dimensions, materials, quantities, assemblies, and building components directly from design artifacts, then intelligently distributing that information to foundation, framing, roofing, insulation, MEP, and finish teams. This creates a digital thread from design through execution, eliminating manual handoffs, reducing human error, and ensuring every stakeholder works from a single source of truth. The impact extends beyond productivity gains—GenAI enables more accurate material forecasting, streamlined procurement, reduced waste, faster response to design changes, fewer change orders, and greater confidence that the architect's vision is executed precisely in the field. In an industry where margins are tight and inefficiencies are costly, GenAI has the potential to fundamentally redefine how construction projects are planned, coordinated, and delivered. This article specifically demonstrates how organizations can leverage Azure AI services—including Azure Content Understanding, Azure foundry, Azure Blob Storage, Azure Open AI—to extract, understand, and operationalize information from construction drawings and project documentation. The solution illustrates how Azure's AI platform can transform unstructured design artifacts into actionable intelligence that improves productivity, reduces risk, accelerates procurement, and enables more efficient execution across the entire construction lifecycle. This transformation is now achievable through a hybrid AI architecture. By combining structured layout understanding models with Generative AI reasoning capabilities, organizations can build highly scalable, intelligent extraction systems that meet the rigorous safety and compliance standards of the construction sector. The Evolution from GenAI Approach to Deterministic Precision Starting with a Generative AI–driven approach to extract structured fields from documents is a fundamentally more effective initial strategy. It accelerates early-stage extraction without requiring large, labeled datasets, while simultaneously enabling structured data collection needed to train deterministic models—which typically require thousands of annotated samples. This approach delivers immediate value by rapidly identifying relevant data patterns in documents and uncovering key factors that influence extraction accuracy, such as document quality, layout complexity, and multi-section ambiguity. At the same time, it naturally builds the dataset necessary to transition toward a more scalable and repeatable solution. However, while powerful for contextual reasoning across document sections, Generative AI is inherently probabilistic and sensitive to input variability. For enterprise-grade reliability, precision, and repeatable structured document extraction, a complementary approach is required. The optimal solution is a hybrid model that combines the strengths of both: Azure Content Understanding provides precise, consistent field extraction with per-field confidence scores at scale. Azure OpenAI GPT-5.2 (generative) adds contextual reasoning, validates ambiguous fields, fills extraction gaps, and interprets complex multi-section relationships. AI Agent (bounded triage) handles exception cases with structured CORRECT/ACCEPT/ESCALATE decisions before human escalation. Together, they form a superior system—delivering higher accuracy, reduced ambiguity, bounded AI cost, and stronger auditability in complex real-world conditions. Note : AI cannot compensate for inconsistent input data. Standardized document schemas and operational discipline remain prerequisites for reliable automation. Solution Components and Architecture The solution follows a modular, event-driven architecture that combines deterministic document understanding and Generative AI to enable scalable, intelligent extraction workflows. At a high level, documents are ingested, deduplicated, processed through Azure Content Understanding for primary extraction, enhanced with GPT-5.2 for gap-fill verification, validated against business rules, and routed through a confidence-based decision system before persistence. The code repository for the solution can be found here Conceptual Architecture Azure Architecture: - The pipeline execution follows this flow: a document is uploaded to Azure Blob Storage, triggering the orchestrator. The pipeline checks for duplicates via SHA-256 hash against Cosmos DB. New documents are submitted to Azure Content Understanding, which returns structured fields with per-field confidence scores. The AI Schema Mapper then identifies gaps—fields that are missing or have confidence below 0.70—and sends only those to GPT-4.1 for verification. Results are normalized, validated against cross-field business rules, and routed based on aggregate confidence. Throughout the pipeline, built-in feedback loops—quality filtering, validation checks, and confidence gates—ensure that only high-confidence results are persisted automatically, enabling a reliable and production-ready extraction system. Azure Blob Storage — Primary storage for source PDFs and extraction artifacts. Standard_LRS, Hot tier, HTTPS-only with SAS-secured access for Content Understanding. Azure Content Understanding — Primary deterministic extractor with custom analyzer supporting 100+ configurable fields. Returns per-field confidence scores (0.0–1.0) plus raw markdown text. Non-LLM, repeatable, and auditable. Azure AI Foundry / OpenAI (GPT-5.2) — Bounded gap-fill verifier invoked only for missing or low-confidence fields (typically 10–20% of total). Temperature 0.0, JSON response format enforced, schema-aware prompting with domain rules. Azure Cosmos DB (Serverless)— Document persistence with SHA-256 deduplication, version increment on re-processing, and partition-by-document-type for efficient querying. Pay-per-request scales from zero. Azure Service Bus (Basic) — Event-driven queue integration with `document-processing` and `human-review` queues for processing triggers and escalation routing. Application Insights + OpenTelemetry — End-to-end observability with per-stage telemetry events, custom metrics (fill_rate, record_confidence, extraction_duration_ms), and distributed tracing Cost Impact of Hybrid Approach Metric CU-Only GPT-Only Hybrid (This Architecture) Cost per document ~$0.01 $0.15–0.30 $0.03–0.05 Determinism 100% Variable 95%+ Accuracy 75-80% 80–90% 90-95% Auditability Full Limited Per-field source attribution Cost savings: 60–80% reduction compared to GPT-only by limiting LLM to gap fields. Security and Enterprise Considerations Azure Blob Storage: Storage accounts can be secured by minimizing public exposure, enforcing strong identity‑based access, protecting data, and continuously monitoring for threats. Organizations should use Private Endpoints and disable public network access wherever possible, authenticate users and applications with Microsoft Entra ID instead of shared keys, and apply least‑privilege Azure RBAC with managed identities. Data should be encrypted in transit (TLS 1.2+) and at rest using Microsoft‑managed or customer‑managed keys stored in Azure Key Vault, while Microsoft Defender for Storage, logging, soft delete, backups, and Azure Policy should be enabled to detect threats, support recovery, and enforce compliance at scale. Content Safety can be called from the application layer to block uploads based on image content. Staging containers can be used to isolate untrusted uploads. Content Safety provides signals; your app enforces policy. Azure Content Understanding / AI Vision: Azure AI services support enterprise-grade security through Microsoft Entra ID–based authentication and Azure RBAC, ensuring only authorized applications can access extraction models. Network isolation can be enforced using Virtual Network (VNet) integration and Private Link to restrict public internet exposure. All data transmitted is encrypted in transit and at rest. Microsoft Defender for Cloud provides continuous security posture visibility across these AI workloads. Azure OpenAI Govern which models are approved for use and protect model artifacts and training data from unauthorized access through strong identity, network, encryption, and logging controls. AI applications should be designed with layered defenses, including multi‑stage content filtering, safety meta‑prompts, and least‑privilege permissions for agents and plugins to reduce the risk of prompt injection, data leakage, and unintended actions. High‑risk AI operations should include human‑in‑the‑loop review to prevent autonomous execution of harmful or incorrect outcomes. Organizations must continuously monitor AI systems for misuse, anomalous behavior, and data exfiltration, and they should perform ongoing AI red teaming to identify vulnerabilities such as jailbreaking, adversarial inputs, and model manipulation before they can be exploited. Azure Cosmos DB Azure Cosmos enhances network security by supporting access restrictions via Virtual Network (VNet) integrationand secure access through Private Link. Data protection is reinforced by integration with Microsoft Purview, which helps classify and label sensitive data, and Defender for Cosmos DBto detect threats and exfiltration attempts. Cosmos DB ensures all data is encrypted in transit using TLS 1.2+ (mandatory) and at rest using Microsoft-managed or customer-managed keys (CMKs). Azure Functions / Compute Secured with Entra ID authentication and managed identities, least-privilege RBAC, HTTPS-only access, private endpoints, VNet integration, and Key Vault for secrets. Hardened with Azure Policy, Defender for Cloud, and centralized logging. Microsoft Foundry Microsoft Foundry supports robust identity management using Azure Role-Based Access Control (RBAC) to assign roles within Microsoft Entra ID, and it supports Managed Identities for secure resource access. Conditional Access policies allow organizations to enforce access based on location, device, and risk level. For network security, Azure AI Foundry supports Private Link, Managed Network Isolation, and Network Security Groups (NSGs) to restrict resource access. Data is encrypted in transit and at rest using Microsoft-managed keys or optional Customer-Managed Keys (CMKs). Azure Policy enables auditing and enforcing configurations for all resources deployed in the environment. Additionally, Microsoft Entra Agent ID, which extends identity management and access capabilities to AI agents. AI agents created within Microsoft Foundry are automatically assigned identities in a Microsoft Entra directory centralizing agent and user management in one solution. AI Security Posture Management can be used to assess the security posture of AI workloads. Defender for AI Services provides threat protection and insights for you AI resources. Purview APIs enable Azure AI Foundry and developers to integrate data security and compliance controls into custom AI apps and agents. This includes enforcing policies based on how users interact with sensitive information in AI applications. Purview Sensitive Information Types can be used to detect sensitive data in user prompts and responses when interacting with AI applications. DevOps Security Security is further “shifted left” by integrating automated controls directly into CI/CD pipelines. GitHub Advanced Security for Azure DevOps, which provides dependency scanning, CodeQL-based static application security testing (SAST), and secret scanning to identify vulnerabilities and exposed credentials in code and third-party libraries. Infrastructure-as-code templates can be validated with Azure Policy and Microsoft Defender for Cloud, while pipeline protections such as protected branches and approvals reduce the risk of unauthorized changes. DevOps environments can be hardened using Azure Key Vault for secrets management, Managed Identities and Microsoft Entra ID for least-privilege access, and monitoring through Azure Monitor . Microsoft Defender for Cloud DevOps Security provides centralized code‑to‑cloud visibility across Azure DevOps, GitHub, and GitLab, identifying risks in code, secrets, dependencies, and IaC and helping teams prioritize fixes early in CI/CD pipelines Related and Future Scenarios Although document extraction serves as the initial use case, this architecture establishes a scalable pattern for many applications: Insurance Claims Processing: Swap schema to claim fields; update CU analyzer for claim forms Legal Contract Analysis: Schema for clauses, parties, dates; add NER in normalization Healthcare Medical Records: HIPAA-compliant Cosmos; schema for diagnoses, medications, vitals Financial Document Processing: Schema for transactions, accounts; add currency normalization Engineering/Construction Plans: Schema for dimensions, materials, specifications Digital Twin Integration: Feed extracted data into asset models for real-time facility visualization Predictive Analytics: Track extracted values over time for trend detection and forecasting Conclusion Modernizing document extraction is not simply about applying AI—it requires aligning technology, operational discipline, and data quality. Early exploration using Generative AI enabled rapid learning and feasibility validation. However, a production-grade solution must be built on structured layout understanding models supported by standardized schema definitions and operational controls. By combining primary structured extraction with Generative AI reasoning for bounded gap-fill verification, organizations can achieve scalable, repeatable, and auditable extraction processes. This hybrid approach enables reduced manual effort, lower error rates, and the transition from batch manual processing to intelligent, automated workflows. The result is not just an automated extraction tool, but a scalable AI architecture for modern document intelligence—adaptable to any industry, any document type, and any structured data need. Contributors: This article is maintained by Microsoft. It was originally written by the following contributors. Gaurav Bhardwaj | Senior Cloud Solution Architect – US Customer Success Manasa Ramalinga | Senior Principal Cloud Solution Architect – US Customer Success Abed Sau | Principal Cloud Solution Architect – US Customer Success627Views0likes0CommentsCloud Native Platforms: Build
Audience: Cloud architects, platform engineers, engineering leaders making design decisions Reading time: 8 minutes Series: Cloud Native Platforms. Build, Run, Evolve. This is Part 1 of 3. Most engineering teams can build systems. Few can scale them without rebuilding them. As platforms grow, complexity does not increase linearly. It multiplies across users, services, tenants, regions, and integrations. The systems that struggle and the systems that scale are rarely separated by which cloud they run on. They are separated by a handful of design choices made early and applied consistently. This post is about those choices. The differentiator is not the cloud Scalable platforms are not built with the right tools. They are built with the right design choices. Cloud services have closed the gap on infrastructure. The differentiator is no longer which managed service a team picks. It is whether the platform is designed to absorb change, tolerate failure, and support visibility from day one. Five engineering disciplines determine whether a platform scales gracefully or collects technical debt while it grows. Figure 1. The five disciplines compound into platform scale. Any one neglected becomes the constraint that forces a rewrite later. 1. Flexibility is the foundation of scale Hard-coded systems work until they do not. The first request to add a tenant, a region, a SKU (a sellable product variant), or a regulatory variant is the moment a rigid design starts to bend. Each subsequent request adds weight. Scalable platforms move behavior out of code: Configuration replaces conditional logic Feature flags enable safer, tenant-scoped rollouts APIs evolve through versioning, not breaking changes Schemas evolve additively. Breaking changes go through versioned contracts with a deprecation window long enough that consumers can migrate without downtime. In practice The pattern that works: configuration in a managed store, feature flags with tenant scope, and APIs versioned per consumer contract. Cost is the discipline of treating configuration as code (versioned, reviewed, audited). The return is that releases stop being events and start being routine. A change that previously needed a coordinated deployment can be executed in minutes, gated to a single tenant for verification, and rolled out broadly only after the signal is clean. Most platforms reach this state by retrofit, not by design. Doing it earlier costs less than waiting. If a change requires a redeploy, it should require a very good reason. 2. Failures are normal. Resilience is a choice. Distributed systems will fail in unpredictable ways. The real question is not how to prevent failure. It is how the system responds when failure happens. Resilience is engineered, not inherited from the platform. The patterns that move the needle are well known and consistently applied: Idempotent operations (safe to call multiple times with the same result) that make retries safe Reliable messaging patterns such as the transaction outbox (writing the message to the same database transaction as the business change, then publishing asynchronously) to avoid lost or duplicated events Decoupled services that contain blast radius (the scope of damage when one component fails) Timeouts, retries, and circuit breakers (a wrapper around a dependency that stops calling it for a cool-off window after repeated failures) tuned per dependency Bulkheads (isolation pools, often a separate compute or queue lane per workload class) that keep noisy neighbours from starving critical paths of resources In practice The pattern that works: every write that can be retried carries an idempotency key, every queue consumer is safe to replay, every event published goes through an outbox in the same transactional unit as the business change. When peak load triggers retries, duplicates collapse cleanly instead of producing duplicate orders, double-charged customers, or split-brain state. The contract changes outwards: callers can retry without thinking, queues can be at-least-once instead of exactly-once, and recovery moves from a manual cleanup task to a property of the system. Most teams that adopt this pattern stop seeing certain classes of incident entirely. Implementation note An idempotent API is not just a design preference. It changes how the rest of the system can be built. Once writes are safe to repeat, retries become cheap, queues become trustworthy, and recovery becomes automatic. The naive implementation (read the key, if absent process and save) has a race. Two concurrent requests with the same key both miss the lookup, both call the processor, and both attempt to save. That is the failure mode idempotency exists to prevent. The pattern that survives production is an atomic reserve-then-execute: insert a row keyed by the idempotency key with a unique constraint before doing any work. The first writer wins. Concurrent callers either wait for the original to complete and read its result, or they receive a conflict response. // Contract for the idempotency store. The two key methods are TryReserveAsync // (atomic insert with unique-key constraint) and CompleteAsync (record the // result of the first writer). GetCompletedResultAsync polls until the first // writer commits or returns 409 Conflict if the in-flight window exceeds the // configured deadline. public interface IIdempotencyStore { Task<Reservation> TryReserveAsync( string idempotencyKey, string requestHash, CancellationToken ct); Task CompleteAsync( string idempotencyKey, OrderResult result, CancellationToken ct); Task<OrderResult> GetCompletedResultAsync( string idempotencyKey, CancellationToken ct, TimeSpan? maxWait = null); } public readonly record struct Reservation( bool IsFirstWriter, string RequestHash); // Idempotency via atomic reserve-then-execute. // First writer wins; replays return the original result; concurrent // duplicates lose the race and read the winner's outcome (or get 409). public async Task<OrderResult> CreateOrderAsync( Order order, string idempotencyKey, CancellationToken ct) { var requestHash = StableHash(order); // canonical content hash // Atomic insert: succeeds for the first caller, fails for the rest. var reserved = await _store.TryReserveAsync( idempotencyKey, requestHash, ct); if (!reserved.IsFirstWriter) { if (reserved.RequestHash != requestHash) throw new IdempotencyKeyReusedException(); // A previous run committed (return its result) or is in-flight // (poll with a bounded deadline; 409 if exceeded). return await _store.GetCompletedResultAsync( idempotencyKey, ct, maxWait: TimeSpan.FromSeconds(5)); } // We are the first writer. Execute, persist, mark complete. var result = await _processor.ProcessAsync(order, ct); await _store.CompleteAsync(idempotencyKey, result, ct); return result; } Three production details matter: TTL or compaction on the idempotency record. Without it, the store grows forever. Most teams retain records for the request retry window plus a safety margin (commonly 24 to 72 hours). Stable content hash, not the default object hash code. The request hash detects key reuse with a different body, so a client that reuses an idempotency key with a different payload receives IdempotencyKeyReusedException rather than silently getting the wrong result. Canonicalise field ordering, locale, and null handling before hashing. Bound the in-flight window explicitly. The genuinely hard case is when the processor succeeded but the store write failed. Production-grade implementations either run the side-effect and the store write in the same transaction (when the processor and store share a database) or use the transaction outbox pattern to bridge them. The poll-with-deadline in GetCompletedResultAsync handles the duplicate-arrives-mid-flight case; the transactional boundary handles everything else. 3. Observability is not optional Without observability, teams operate blind. As systems grow, the price of guessing rises faster than the price of seeing. At build time, observability is a design property. The decisions made before the system reaches production are what determine whether it can be operated at all. The dashboards, alerts, and incident practices covered in Part 2 of this series rely on instrumentation choices made here. The build-time work that pays off in production: Request identifiers propagated through every service hop, every queue, every async boundary, so a single user action can be traced end to end Structured logging with a consistent schema (event name, correlation id, tenant, severity) rather than free-form strings Metrics emitted at the boundaries that matter (every external call, every queue read or write, every database operation), not only at the entry point Tracing libraries integrated at the framework or middleware layer so coverage is automatic, not opt-in Schemas designed so business signals (orders, sessions, transactions) and system signals (CPU, latency, errors) share the same identifiers and can be correlated later In practice The pattern that works: a single request id flowing through every service hop, every queue, every async boundary, propagated automatically at the framework layer rather than per-call. Add one structured logging schema across services (event name, correlation id, tenant, severity), so that a single query joins business events with system events. The investment is hours of upfront framework wiring. The return is that production diagnosis stops being archaeology. Cross-service questions become single dashboards; postmortems shrink from days to hours; and the dashboards in Part 2 actually work because the data underneath is shaped to support them. 4. Delivery practices set the ceiling Scaling teams requires scaling delivery. Small inefficiencies in pipelines, environments, and release coordination compound into measurable drag. Delivery maturity that pays off at scale: Pipelines as code, reviewed and versioned like application code Parallel deployments across services and regions where dependencies allow Infrastructure as code with shared modules, not hand-managed environments Automated quality gates: tests, security scans, dependency checks Trunk-based development (developers commit to a single shared branch many times a day) with short-lived feature branches and progressive delivery. Important caveat: trunk-based works only when test automation and feature flags are already in place. Adopting it before those foundations exist tends to amplify production incidents rather than reduce them. In practice The pattern that works: pipelines run in parallel where dependencies allow, infrastructure provisioning is templated rather than per-environment, and quality gates run automatically rather than as discretionary steps. Sequential deployment of a multi-service platform across three environments takes hours; parallelised deployment of the same change takes minutes. The payback is not only release speed. It is the compounding cost reduction of every wait state for every engineer on every release. Teams that treat pipelines as a product feature, not an afterthought, ship more confidently and recover from bad changes faster because the rollback path was exercised, not invented during an incident. Slow pipelines are not a tooling problem. They are a design problem. 5. Cost discipline is engineering work Cloud platforms can become expensive quickly when cost is treated as someone else's problem. Cost is a property of the design, not a quarterly review. The teams that get this right treat cost the same way they treat performance: Elastic compute and storage tiers chosen per workload pattern Non-production environments with automated scale-down windows (the easiest savings to leave on the table) Tagging discipline so cost can be attributed to a service, a feature, a tenant Egress and data-tier choices, not compute, dominate cloud bills past a certain scale. Right-size storage tiers (hot vs cool vs archive), eliminate cross-region chatter, and watch egress on the data plane more closely than compute on the request path. Budgets and usage alerts wired into the same channels as reliability alerts Cost reviews built into design discussions, not deferred to FinOps (Financial Operations: the practice of managing cloud spend as an engineering concern) In practice The pattern that works: non-production environments scale down automatically outside business hours, storage tiers match access patterns (hot, cool, archive), and tagging is enforced so every dollar can be attributed to a service or feature. Cost reviews happen at design time, not after the bill arrives. The biggest savings come from data plane decisions, not compute: cross-region egress, oversized storage tiers, and forgotten test environments dominate cloud bills past a certain scale. Treat cost as a first-class non-functional requirement, alongside latency and availability, and the discipline compounds in every design discussion that follows. A scenario that ties it together Figure 2. A reference architecture that puts the disciplines into one shape. The request path is decoupled, the data layer is purpose-fit, identity is brokered by managed identity throughout, private endpoints isolate the data tier from public networks, and observability runs as a first-class lane. Picture a multi-tenant platform at a growth inflection. Onboarding a new tenant takes weeks because tenant-specific behaviour is hard-coded across services. Every release carries risk because there is no way to roll out a change to one tenant without affecting the rest. Incidents linger because logs and metrics live in different tools and nobody can correlate them in production. Do not start with a rewrite. Start with the smallest set of changes that unlocks the next year of growth: extract configuration out of code, introduce tenant-aware feature flags, wire a unified observability view into the existing services, and parallelise the pipelines. None of these are architectural revolutions. They are design choices applied with discipline, in the order the disciplines compound. Eighteen months in, onboarding a tenant takes hours instead of weeks. Releases move from monthly events to weekly increments. Incidents are caught earlier and resolved faster. The platform did not get bigger. It got more capable. The five disciplines did the work; the team made the choice to apply them. What teams get wrong The common pattern is architecting for the system you have, not the system you are growing into. It looks like progress because the current sprint ships. Pillars get postponed because they feel like overhead. The cost surfaces later. Each shortcut becomes a constraint. The constraints compound, and three releases later the team is debating a rewrite. The fix is not premature abstraction. It is small, deliberate investments in flexibility, resilience, observability, delivery, and cost from day one. The discipline is to make these investments before they are urgent. Where to start when you cannot do everything at once Five disciplines is a wall, and real teams cannot fund all five at once. The right order depends on whether the platform is being built fresh or already running. For a system already in production and already in pain, the SRE community's hierarchy of reliability needs gives the most defensible starting order: monitoring and observability first (you cannot fix what you cannot see), then incident response (close the bleeding cleanly), then resilience patterns (idempotency, retries, decoupling) so the bleeding has fewer reasons to start, then flexibility and delivery so safe change can travel at speed. Cost discipline runs alongside throughout, never as the headline. For a system being built fresh, the order in this post (flexibility, resilience, observability, delivery, cost) reflects the Azure Well-Architected Framework's emphasis on designing for change, failure, and visibility before scaling teams or workloads. Both orders are defensible. What is not defensible is leaving any of the five for later. The most concrete starter from this post: request id propagation. A single correlation identifier travelling through every service hop, every queue, every async boundary, costs hours up front and pays back every time someone has to debug production for the rest of the platform's life. It is the smallest unit of the observability discipline and the foundation that the dashboards, traces, and incident response in Part 2 all depend on. The shift The most important transformation in scaling a platform is not technical. It is mindset. The shift is from project thinking to platform thinking: Build reusable capabilities, not one-off solutions Design systems for long-term evolution, not the next release Enable other teams, not just deliver for one team Tools change. Cloud services evolve. The architectural fashions of this year will not be the architectural fashions of the next. What persists is the discipline behind the choices. Scalable systems are not built by tools. They are built by teams that treat design as continuous work. The same discipline shows up again in Part 2 (operating these systems) and Part 3 (using AI to augment that work). The tools change. The disciplines do not. Want to discuss? What single design choice has paid the most dividends in the platforms you run? Drop a comment with patterns you have seen in your environment. Every reply gets read. Next in this series: Running Cloud Native Platforms: Why Day 2 Decides Everything. Building is half the journey. The next post looks at what it takes to operate these platforms once they are in production.808Views2likes1CommentCloud Native Platforms: Run
Audience: SREs (Site Reliability Engineers), platform engineers, engineering managers running production systems Reading time: 8 minutes Series: Cloud Native Platforms. Build, Run, Evolve. This is Part 2 of 3. Most systems are designed thoughtfully. Most operations are inherited reactively. The systems that survive are not the ones built with the most care. They are the ones operated with the most discipline. Production has a way of revealing every shortcut taken during design and every assumption left unverified. This post is about what it takes to operate a platform once the build is done. How they are run, not how they are built Systems are not defined by how they are built. They are defined by how they are run. A well-designed system that is operated reactively will fail in production. A modestly designed system that is operated with discipline will outperform it. Five operational disciplines decide which side of that line a platform lives on. Each one is engineering work, not a checklist for someone else to handle. Figure 1. The incident lifecycle as a state machine. The states are not optional steps. They are the contract between the team and the system. 1. Observability is the backbone of reliability Without observability, every operation becomes a guess. As systems grow, the cost of guessing rises faster than the cost of seeing. Part 1 of this series argued that observability is a design property: instrumentation contracts, request id propagation, structured logging schemas. Production is where those design choices either pay off or do not. Strong observability in production is a contract that lets any engineer answer three questions in minutes: what failed, why it failed, and what the impact was. The shape of that contract matters more than the tool that implements it. (This three-question framing is community-popularised through the SRE community and writers such as Charity Majors. See Honeycomb's What is Observability for the canonical articulation of the three-pillars and question framing; the substance is older than the framing.) Dashboards organised around user journeys, not infrastructure components Service level indicators (SLIs: the specific measurements you care about, e.g., success rate, p99 latency) chosen from the user's perspective, not the database's Alerts that page only on burn-rate against an SLO (Service Level Objective: the target value of an SLI, e.g., 99.9% of requests complete in under 800ms over a rolling month) using a multi-window strategy. A short window catches fast burns; a long window catches slow drifts. This is what makes SLOs operational rather than decorative. Sampling and retention tuned for cost, but never for blind spots The distinction between MTTA (mean time to acknowledge: how fast someone notices) and MTTR (mean time to restore: how fast service returns) tracked separately. Conflating them hides whether the team's bottleneck is detection, response, or fix. In practice The pattern that works: rebuild the operational view around two or three user journeys (sign-in, place order, view history) rather than per-component charts. Tie alerts to error budget burn rather than raw threshold crossings. Track MTTA and MTTR separately so the team's actual bottleneck (detection, response, or fix) is visible. The investment is rethinking what to measure, not buying a new tool. The return is that incidents stop being discovered by customer complaints first. Teams that make this shift typically find their existing telemetry was sufficient; only the questions being asked of it were wrong. If a dashboard cannot answer "what is the user experiencing right now", it is not an observability dashboard. It is decoration. 2. Alerts are signals, not notifications More alerts do not mean better monitoring. In practice, the opposite is true. Once alerts outpace the team's ability to act, important signals start getting missed. Effective alerting works to a small set of rules: Severity that maps to action, not to technical category Ownership baked in, never inferred at runtime Thresholds tied to user impact, not raw metric values Noise treated as a defect, with a regular review cadence Suppression and grouping for known multi-alert patterns In practice The pattern that works: audit every alert against one test, "what action would I take in the next five minutes if this fires now?" Demote alerts with no answer to dashboards. Remove alerts where the answer is the same as another alert's. Group related alerts so one incident produces one page, not twelve. Most teams discover their alert volume drops by an order of magnitude after a thorough audit, and the alerts that remain start getting trusted again. Trust is the precondition for every other operational practice. Without it, on-call rotations decay into noise filtering and the real signals get missed. Figure 2. From raw events to pages, in approximate orders of magnitude. The numbers vary by team and workload; what does not vary is that each stage needs to remove one to two orders of magnitude of noise. Teams that page on raw events end up with on-call rotations nobody trusts. 3. Incident response is a practiced muscle Failures are inevitable. Unstructured response is not. The teams that recover quickly do not improvise during incidents. They follow a structure that has been practiced when nothing was on fire. The structure is intentionally simple, because incident time is the worst time to negotiate roles. Clear roles: incident lead, communications lead, scribe, subject matter expert (the RACI model, Responsible-Accountable-Consulted-Informed, adapted for incident response) Defined escalation paths with clear handoff criteria. Escalation means re-paging to a higher tier or specialist, not returning to detection. The lifecycle diagram in Figure 1 makes the distinction explicit. Runbooks for the top failure modes, kept short enough to actually be read Status communication on a fixed cadence, even when there is nothing new to say. Customer comms and internal comms are tracked separately. Blameless postmortems (focus on the system that allowed the failure, not the person who pushed the button) that produce action items the team actually completes Game days: scheduled exercises that simulate failure modes (region outage, dependency unavailability, traffic spike) under controlled conditions, so gaps in runbooks are found before incidents do In practice The pattern that works: name the incident lead and the comms lead before the first message goes out. Write runbooks short enough to be scannable at 3 AM. Run blameless postmortems with action items that actually get tracked to completion. Schedule game days quarterly so the runbooks are exercised before real incidents. Teams that operate with this structure do not have more engineers; they have engineers who are not single points of failure during recovery. The deepest experts stay the deepest experts, but the platform stops depending on whether they happen to be online. Implementation note A short, well-structured runbook outperforms a long, exhaustive one. The goal during an incident is not to think. It is to act on a procedure that has been thought through in calmer times. # Runbook header pattern (keep it scannable in incident time) title: High latency on order API slo_protected: # this runbook protects two SLOs - order-completion-success - order-completion-latency severity: # derived from burn rate, not declared fast_burn: P1 # 14.4x budget burn over 1 hour => page now slow_burn: P2 # 6x budget burn over 6 hours => investigate owner: payments-team indicators: # triggers for evaluation, not severity - p99 (99th-percentile) latency exceeds the SLO target for 5 min - error rate exceeds the SLO target for 3 min on order-completion first_actions: - Open the order-journey dashboard. Confirm impact in business terms. - Check Service Bus queue depth and dead-letter rate (the most common cause of API latency under load is downstream backpressure) - Verify Cosmos DB RU/s saturation and partition hotspots - Inspect the most recent deployment for behavioural changes escalate_if: - Latency does not recover in 15 min - Error rate exceeds 5% (fast burn against the SLO) - Customer reports arrive before our own signals do rollback_path: - Feature flag "new-order-pipeline" can be disabled per-tenant - Last known good deployment id is in the release tracker note_on_scaling: # CPU is rarely the cause of latency in this service. Scale only after # confirming the bottleneck is compute, not a downstream dependency or # queue depth. Adding capacity to a saturated downstream amplifies the # incident; it does not resolve it. The general principle behind that last note travels beyond this runbook: scale-out is the right remediation for compute saturation, not for downstream saturation. When latency rises because a database, queue, or external dependency is saturated, adding capacity in front of the bottleneck moves more requests into the bottleneck and makes the incident worse. This is one of the most common operational mistakes when the dashboard shows red and the on-call instinct says "add more". 4. Release confidence is engineered Releases get harder as systems grow. The platforms that ship confidently at scale have engineered the path, not learned to fear it. The patterns that change the math: Feature flags that allow change without deploy Canary deployments (releasing the new version to a small slice of traffic first, watching error budget burn before continuing) that surface problems on a small slice Gradual rollouts with automated rollback triggers Database migrations split from application releases Release coordination that scales with services, not with team size In practice The pattern that works: every change ships behind a feature flag, canary deployments take a small slice of traffic first, and rollback is a one-click step in the pipeline rather than a procedure to be invented during an incident. The cost is the discipline of building rollback paths and exercising them. The return is releases that stop being events. Issues that previously triggered full rollbacks get isolated to a slice and rolled back automatically before they reach most users. The willingness to ship smaller, more frequent changes follows directly from the confidence that bad changes can be undone fast. Big releases feel safe because they are rare. They are actually risky because every change rides together. 5. Reliability is continuous, not a milestone Reliability is not achieved through tools alone. It requires continuous refinement, feedback-driven improvement, and a budget that the team can spend on operational work without negotiating each time. The disciplines that keep systems reliable over years are codified well in the SRE-book framing of service level objectives and error budgets (the canonical reference is the Google SRE Book chapter on Service Level Objectives, with the operational follow-up in the SRE Workbook chapter on alerting on SLOs). The names matter less than the practice they enable. SLOs chosen from the user's perspective, with two or three per service rather than ten. More SLOs means none of them shape behaviour. Error budgets: the inverse of the SLO, expressing how much unreliability the team is willing to spend in a window. Used up early in the month means slow down on releases. Healthy means feature work keeps moving. Multi-window burn-rate alerting turns SLOs from dashboards into pages: short window catches catastrophic failures, long window catches slow drift. Without burn-rate alerting, SLOs are observation, not operation. (The pattern is documented in the SRE Workbook.) Reliability work has its own backlog, prioritised against features. Not a wishlist after every incident. Regular game days that exercise failure modes (region failover, dependency outage, traffic spike) before they happen for real Capacity planning informed by data, not by anxiety In practice The pattern that works: define two or three SLOs per service, expressed from the user's perspective. Compute the error budget weekly. When the budget is healthy, ship feature work. When the budget is burning fast, slow down and fix the cause. The conversation about which incidents matter and which can wait becomes possible because there is a shared number to point at. Reliability becomes a quantified property of the platform, not an opinion debated at every retrospective. Teams that adopt this discipline stop having the recurring "how reliable do we need to be?" argument and start having data-grounded trade-off discussions instead. A scenario that ties it together A platform was launching a new region. The build had gone well. Day 1 was clean. Two weeks in, latency started creeping up during peak hours. Alerts fired on raw thresholds, but no one could tell which ones to trust. Incident calls turned into long debugging sessions because three different teams owned overlapping pieces of the request path. The team did not start by buying a new tool. They started by treating operations as engineering work. The dashboard was redesigned around the user journey. Alerts were audited and most were demoted or removed. Roles for incident response were written down. A short runbook covered the top failure modes. Releases were broken into canary slices behind feature flags. None of this was new. It was discipline applied consistently to work that was previously assumed to be someone else's. The next region launch took half the effort, and the team's mean time to restore on the failures that did happen was measurably lower. What teams get wrong The common pattern is treating Day 2 as the cost of Day 1. Teams design beautifully, ship fast, then quietly absorb the operational debt. Dashboards proliferate. Alerts grow louder. Postmortems pile up. The fix is not more dashboards. It is treating operations as engineering work with the same rigour as feature delivery. Operability is a property the system either has or does not. It is not earned by adding monitoring. It is earned by designing for visibility and operating with discipline. Where to start The most concrete starter from this post: an alert audit. List every alert that fires in the next week and apply a single test to each one: "what action would I take in the next five minutes?" Demote the alerts that have no answer. Remove the alerts where the answer is the same as another alert's. The audit takes a morning. The result usually halves alert volume and lifts trust on what remains, which is the precondition for every other operational practice in this post. The shift The most important shift in maturity is not technical. It is in stance. The shift is from shipping software to operating systems: Operations is not a phase that follows engineering. It is engineering. Reliability is not a milestone reached. It is a discipline practiced. Incidents are not interruptions to the work. They are the work. The teams that internalise this shift run platforms that are smaller, calmer, and more trusted. They do not have fewer incidents because their systems are more advanced. They have fewer incidents because their operational discipline is more consistent. Part 3 of this series argues that the same discipline applies again, in a different domain: the practices that make platforms operable are the practices that make AI useful in delivery. Want to discuss? What is the one operational practice your team adopted that changed how you sleep at night? Drop a comment with patterns you have seen in your environment. Every reply gets read. Previously in this series: Building Cloud Native Platforms That Scale: Patterns That Actually Work. The first post covered the design choices that make scale possible. Next in this series: AI-First Platform Engineering: From Copilot to Agentic Delivery. Cloud helped us scale infrastructure. The next post looks at how AI is now changing how we build and run platforms.Cloud Native Platforms: Evolve
Audience: Engineering leaders, platform architects, senior developers exploring how to operationalise AI in their teams Reading time: 8 minutes Series: Cloud Native Platforms. Build, Run, Evolve. This is Part 3 of 3. Cloud helped us scale infrastructure. AI is starting to do the same thing for the work around the code: the planning, the testing, the release communication, the incident triage, the writing that surrounds writing software. The conversation about AI in software has narrowed too quickly to "Copilot in the editor". The bigger story is happening across the lifecycle. Planning, design, development, testing, release, and operations are all being augmented at once. The platforms that adopt AI well are not the ones with the most usage. They are the ones with the clearest discipline around how it is used. This post is about that discipline. AI is changing how we engineer, not how we type AI is not changing how we write code. It is changing how we engineer software. Code generation is the surface. Underneath it, AI is reshaping the unit of leverage. The question is no longer how fast a developer can type. It is how well a workflow can be expressed as a reusable engineering asset. Six disciplines determine whether AI moves the needle on outcomes or just adds another tool to the stack. Figure 1. AI across the SDLC. Each phase has clear AI assist points and clear human-owned validations. The boundary is not negotiable. It is the design. 1. From assistance to augmentation Early AI tools focused on assisting individual developers. Code suggestions. Autocomplete. Quick refactors. The value was real but bounded by the editor. The shift now is into structured workflows that span the lifecycle. The unit of leverage is no longer a single suggestion. It is a sequence of actions executed reliably across phases. ("Agentic" later in this post means a system that makes its own next-step decisions inside guardrails. A workflow follows a fixed sequence; an agent chooses the path.) Code generation has become baseline, not differentiator Workflow generation is where the largest gains live Multi-step assistance with explicit human checkpoints Context that travels across tools, not just within one In practice The pattern that works: start with the single highest-volume writing task on the team (commit messages, code review comments, release notes, postmortem first drafts) and turn the AI assist for that task into a shared workflow rather than each individual's private trick. The cost is one engineer's afternoon documenting the workflow and the eval set. The return is that every engineer on the team inherits the work, and the task that used to consume an engineer's morning every two weeks becomes a background step in the release process. Workflow generation, not faster typing, is where the gains compound across a team. Code suggestions help one developer. Reusable workflows help the next ten. 2. AI across the SDLC, with guardrails AI now has a useful role at every phase of delivery. The role is different at each phase, and the guardrails are different too. Phase What AI helps with What humans must validate Plan Breaking down requirements, drafting acceptance criteria Domain context, business priorities, customer impact Build Code generation, refactoring, scaffolding Architectural fit, security boundaries, performance Test Test case generation, edge case discovery Coverage of business-critical paths, regulatory cases Release Release notes, changelog summaries, communication drafts Accuracy, tone, customer-facing claims Operate Log triage, incident summaries, runbook drafts Root cause attribution, action item ownership The guardrails are not optional decoration. They are the design. In practice The pattern that works: stage AI assists for release communication (changelog drafting, customer-facing release notes, internal release announcements) and require a human review before anything goes out. The draft arrives consistently, faster than a human could produce, and easier to compare across releases. The reviewer is not eliminated; the reviewer is moved from author to editor, which is where their judgment actually matters. Teams that adopt this pattern stop missing release-note deadlines and stop publishing inconsistent communication across products. 3. From prompts to reusable assets Many teams begin with prompt experimentation. Individuals find techniques that work for their tasks. The result is a patchwork of personal practices that do not survive a team change. The compounding value comes when prompts mature into reusable engineering assets. Figure 2. The maturity model from prompts to agents. The value compounds at the workflow stage and accelerates at the agent stage. The disciplines that make agents safe are the same ones that made workflows reliable. The maturity stages, in order of leverage: Prompts: ad-hoc, individual, hard to share Templates: parameterised prompts versioned with the project Workflows: multi-step sequences with clear inputs, outputs, checkpoints Agents: autonomous task chains operating within explicit guardrails The diagram is a maturity ladder, not a graduation. In practice teams operate at all four stages simultaneously for different tasks. A senior engineer may use a one-off prompt to explore a refactor, run a versioned template for commit messages, hand off to a workflow for release notes, and trigger an agent for routine PR triage, all in the same hour. The point of the ladder is not to leave earlier stages behind. It is to know which stage a given task belongs to and to invest accordingly. In practice The pattern that works: pick the three prompts your team uses every week, codify them as parameterised templates in the same repository as the application code, and treat them as engineering artefacts (reviewed, versioned, owned). New engineers inherit the team's accumulated practice instead of building their own from scratch. Quality becomes consistent because the variance between individuals shrinks. Investment pays back in weeks, not quarters, and the maturity ladder keeps producing returns as the team moves from templates to workflows to agents. 4. Agentic delivery, with guardrails that survive a security review The next stage is agentic. AI executes sequences of tasks within a defined scope. The risk is not that the agent will fail. It is that the system around the agent will not catch the failure, and that the failure modes are different in kind from traditional automation. Agents are non-deterministic, they can be manipulated through their inputs, and their actions can have side effects in systems the team does not own. Five guardrails make agentic delivery safe. The first four are necessary. The fifth is what carries the agent through a security review at a regulated enterprise. Identity and scope: the agent runs as a managed identity (or scoped service principal) with the smallest set of permissions that lets it do its job. Permissions are expressed as allowlists, not denylists. Tools fetched at runtime are subject to the same identity boundary as the agent itself. Input quarantine: anything the agent reads from a user-controlled source (work item bodies, PR descriptions, customer tickets) is treated as untrusted text. The agent does not execute instructions found in fetched content, and tool calls are validated against an output schema before execution. This is the prompt-injection mitigation, and it is the most common gap in agentic systems shipped today. Cost and blast-radius caps: every run has a maximum token budget, a maximum number of tool calls, and a maximum spend. Exceeding any cap aborts the run cleanly. Without caps, scoped credentials are not enough to bound the damage. Evaluations and traceability: agents are evaluated against a fixed test set before deployment, and on every prompt or model change. Every action is logged with inputs, outputs, the model and prompt versions used, and the reasoning trace where the model exposes one. Logs are redacted for secrets and personally identifiable information at write time. Reversibility taxonomy: actions are categorised by reversibility, not asserted to be reversible in general. A draft write to a private store is reversible. A post to a customer-facing channel is not reversible (deletion does not unsend). A database update may be reversible by a compensating transaction or not at all. Irreversible actions require human approval at the boundary, before they happen, not after. The agent is allowed to draft and stage. The human is the only one who is allowed to make the move that cannot be undone. In practice The pattern that works: start with one low-risk agent (release-notes drafter, PR triage assistant) running on read-only inputs, write-only-to-drafts permissions, and a hard cost cap per run. Require explicit human approval at the irreversible step. Wire up an evaluation set on day one, and rerun it on every prompt or model change. Treat regressions as failures, not warnings. The first agent the team ships is rarely the most valuable; it is the rehearsal that establishes the controls every later agent inherits. Teams that skip this rehearsal end up with an agent in production that no one feels safe extending. Implementation note An agent without a reversibility taxonomy and a regression eval set is a liability. The discipline is the same one that made workflows reliable: scoped identity, idempotency, traceability, and a clear boundary between machine action and human decision. The YAML below is illustrative, not a runtime contract; it is meant to show the shape of the controls a real agent definition would carry, not the syntax of any specific platform. # Agent run definition (illustrative; not a specific platform's syntax) name: release-notes-drafter trigger: pre-release identity: type: managed-identity scope: tenant=<tenant-id> resource=release-tools/<app-id> permissions: allow: - read: work-items in milestone (filter: state=Done) - read: pull-requests in milestone (filter: merged) - write: drafts/release-notes/${run-id} # Production channels are NOT in the allowlist. The agent cannot post. limits: max_tokens_per_run: 80000 max_tool_calls_per_run: 20 max_runtime_seconds: 300 max_cost_usd: 0.40 on_exceeded: abort_with_partial_artifact input_handling: treat_fetched_content_as: untrusted # Indirect prompt injection is mitigated by the layered discipline below, # not by a single feature flag. Each item is a separate control. enforce_instruction_hierarchy: true validate_tool_args_against_schema: true validate_outputs_against_schema: true steps: - fetch: completed work items in milestone - draft: release notes from items - validate: required fields present - request-review: from: release-manager idempotency_key: ${milestone-id}-${draft-hash} - on-approval: action: post-to-internal-channel reversibility: not-reversible requires: explicit-human-click # the agent does NOT click this audit: log_inputs: true log_outputs: true redact: - secrets # Pattern-based: handles structured PII like emails, phones, IDs. - pii_patterns: [email, phone, national-id, payment-card, ip-address] # Entity-based: required for unstructured PII like names. Pattern alone # cannot redact a customer name without an entity-recognition step. - pii_entities: ner-based # names, locations, organisations retain: 365_days # tune to your audit policy, not to the demo evaluation: test_set: tests/release-notes/eval-v3.jsonl on_prompt_change: rerun on_model_change: rerun fail_threshold: 5_percent_regression 5. Where AI still needs human judgment AI has clear boundaries. The boundaries are not embarrassing. They are the design. What must stay human-owned: Architectural trade-offs and design decisions Security validation and threat modelling Correctness for business-critical and regulatory paths Domain context that has not been written down Accountability for outcomes, not just outputs The goal is collaboration, not replacement. The teams that get the most value from AI are not the ones with the most automation. They are the ones with the clearest sense of where automation ends and judgment begins. In practice The pattern that works: name the human-owned items explicitly in the team's working agreement (architecture, security, regulatory correctness, accountability) and audit every AI workflow against that list. When a workflow asks the AI to make a decision in any of those categories, redesign it so the AI prepares the analysis and a human makes the call. Most teams over-trust AI for one of these areas in their first six months and learn the hard way. Naming the boundary up front prevents the lesson from being paid in production. The clarity is the value; the model behind the workflow is interchangeable. 6. Responsible AI is engineering work The first five disciplines decide whether AI moves the needle. The sixth decides whether the platform can defend the choices it makes with AI. Responsible AI is the engineering practice of building systems whose AI behaviour is fair, transparent, accountable, and safe by design, not by audit after the fact. Treating it as a compliance checkbox at the end of the project is how teams end up shipping AI workflows that fail security review, embarrass the company, or harm users. Six controls turn responsible AI from a policy into engineering work. These map directly onto the practices Microsoft and the broader industry have converged on, but the names matter less than the practice they enable. Fairness in inputs and outputs. The training data, eval set, and prompts are reviewed for systematic bias against any group the system serves. The eval set covers under-represented cases by design, not by accident, and regressions on those cases fail the build. Transparency to end users. When a user sees AI-generated content, they are told. When a decision is AI-assisted, the path from input to output is explainable in plain language, not just in a model card buried in documentation. Content safety filters. Inputs and outputs pass through safety classifiers (prompt injection, prohibited content, jailbreak patterns) before reaching the model and before reaching the user. Filtering decisions are logged and reviewable. Accountability ownership. Every AI workflow has a named owner who is accountable for its outcomes, not just its uptime. The owner has the authority to pause or roll back the workflow when harm is detected. Data minimisation and residency. The AI sees only the data it needs to do the task. Personally identifiable information and customer data are scoped, redacted, and kept inside the boundary the customer agreed to. Cross-tenant leakage is treated as a P1 incident, not a feature request. Harm evaluation alongside quality evaluation. The eval set measures harm potential (toxicity, hallucination on factual queries, leakage of confidential context) with the same rigour as it measures correctness. Both must pass for a release to ship. Figure 3. Responsible AI as a set of engineering controls around the AI workflow. The six controls fall into four categories: data discipline (fairness, data minimisation), model discipline (content safety, harm evaluation), deployment discipline (transparency to users), and governance (accountability ownership). All six are necessary; none is sufficient on its own. In practice The pattern that works: write the responsible AI plan before the first agent ships, not after the first incident. Pick one workflow that touches user data or generates customer-facing content, and use it as the reference implementation: fairness review on the eval set, content safety filters wrapping the model call, transparency annotation in the UI, redaction of identifying details in logs, harm evals running alongside quality evals on every change, and a named owner with explicit pause authority. The first such workflow takes longer to ship than the unconstrained version. Every workflow after it inherits the controls and ships faster than it would have without them. Teams that defer responsible AI to a future quarter end up retrofitting it under pressure, which is the most expensive way to do it. A scenario that ties it together Picture a platform team several months into using Copilot. Adoption is high. Productivity dashboards show gains. But defect rates are not improving and lead time is flat. Leadership asks the obvious question: is AI actually helping, or just feeling like help? The answer is not to stop using AI. It is to change how AI is measured. Move adoption metrics to the background. Move outcome metrics to the front: defect escape rate, lead time for change, change failure rate, mean time to recovery. In parallel, promote the individual prompts that have proved themselves to shared templates, and the templates to versioned workflows. Retrofit responsible AI controls onto the workflows that shipped first: content safety filters, harm evaluations alongside quality evaluations, transparency annotations on customer-facing output, and a named owner for each workflow. Six months later, the picture is different. Defect rate improves on the parts of the codebase where reusable workflows were introduced. Onboarding for new engineers is visibly faster. Release notes are consistent across teams. The shift is from celebrating use to tracking outcomes, and once the team measures what matters, the tooling decisions start making themselves. What teams get wrong The common pattern is measuring AI by usage, not by outcome. Adoption metrics tell you who tried Copilot. They do not tell you whether defects dropped, lead time improved, or release notes got better. The fix is not less AI. It is better measurement. The four metrics named in the scenario above (defect escape rate, lead time for change, change failure rate, mean time to recovery) come from the DORA research on software delivery performance and have become a useful default. Two warnings travel with them. First, attribution is hard: an AI workflow rolled out alongside a test refactor and a CI pipeline change cannot claim credit cleanly. Second, baselines matter more than headlines: a single quarter's improvement is not a trend, and a single team's gain is not the platform's gain. Outcome measurement done well needs a baseline window, an attribution discipline, and a kill criterion for workflows that are not paying back. Done poorly, it is just adoption metrics with better names. There is also the question of cost. AI usage carries a per-run token bill, an evaluation bill on every change, and (for agents) a cost cap that limits damage when something goes wrong. None of these are large compared to the engineering time saved when the workflow works. All of them are visible enough that a finance-aware reader will ask. Track them. Where to start The most concrete starter from this post: promote one personal prompt to a shared template. Pick the prompt that gets used most often (commit messages, code reviews, release notes, debugging assist), move it from someone's notes into the repository where the team versions everything else, and watch what changes when the next person on the team runs it. That is the smallest unit of the workflow shift this post argues for, and it is the step where prompts stop being individual practice and start becoming engineering assets. The shift The shift is from building systems to building smarter systems: AI does not replace engineers. It changes what an engineer's leverage looks like. The unit of value is the workflow, not the suggestion. The discipline that made platforms operable is the same discipline that makes AI useful. Responsible AI is not a compliance step. It is the sixth engineering discipline that lets the other five compound safely. The series ends here, but the arc is consistent across all three posts. The disciplines that make platforms scale are the same disciplines that make AI useful. Build with discipline. Run with discipline. Evolve with discipline. The tools change. The disciplines do not. Want to discuss? Where has AI moved the needle most in your delivery, and where has it disappointed you? Drop a comment with patterns you have seen in your environment. Every reply gets read. Previously in this series: Building Cloud Native Platforms That Scale: Patterns That Actually Work. Part 1 covered the design choices that make scale possible. Running Cloud Native Platforms: Why Day 2 Decides Everything. Part 2 covered the operational disciplines that decide production outcomes. This is the third and final post in the series.
Centralizing Enterprise API Access for Agent-Based Architectures
Problem Statement When building AI agents or automation solutions, calling enterprise APIs directly often means configuring individual HTTP actions within each agent for every API. While this works for simple scenarios, it quickly becomes repetitive and difficult to manage as complexity grows. The challenge becomes more pronounced when a single business domain exposes multiple APIs, or when the same APIs are consumed by multiple agents. This leads to duplicated configurations, higher maintenance effort, inconsistent behavior, and increased governance and security risks. A more scalable approach is to centralize and reuse API access. By grouping APIs by business domain using an API management layer, shaping those APIs through a Model Context Protocol (MCP) server, and exposing the MCP server as a standardized tool or connector, agents can consume business capabilities in a consistent, reusable, and governable manner. This pattern not only reduces duplication and configuration overhead but also enables stronger versioning, security controls, observability, and domain‑driven ownership—making agent-based systems easier to scale and operate in enterprise environments. Designing Agent‑Ready APIs with Azure API Management, an MCP Server, and Copilot Studio As enterprises increasingly adopt AI‑powered assistants and Copilots, API design must evolve to meet the needs of intelligent agents. Traditional APIs—often designed for user interfaces or backend integrations—can expose excessive data, lack intent-level abstraction, and increase security risk when consumed directly by AI systems. This document outlines a practical, enterprise-‑ready approach to organize APIs in Azure API Management (APIM), introduce a Model Context Protocol (MCP) server to shape and control context, and integrate the solution with Microsoft Copilot Studio. The goal is to make APIs truly agent-‑ready: secure, scalable, reusable, and easy to govern. Architecture at a glance Back-end services expose domain APIs. Azure API Management (APIM) groups and governs those APIs (products, policies, authentication, throttling, versions). An MCP server calls APIM, orchestrates/filters responses, and returns concise, model-friendly outputs. Copilot Studio connects to the MCP server and invokes a small set of predictable operations to satisfy user intents. Why Traditional API Designs Fall Short for AI Agents Enterprise APIs have historically been built around CRUD operations and service-‑to-‑service integration patterns. While this works well for deterministic applications, AI agents work best with intent-driven operations and context-aware responses. When agents consume traditional APIs directly, common issues include: overly verbose payloads, multiple calls to satisfy a single user intent, and insufficient guardrails for read vs. write operations. The result can be unpredictable agent behavior that is difficult to test, validate, and govern. Structuring APIs Effectively in Azure API Management Azure API Management (APIM) is the control plane between enterprise systems and AI agents. A well-‑structured APIM instance improves security, discoverability, and governance through products, policies, subscriptions, and analytics. Key design principles for agent consumption Organize APIs by business capability (for example, Customer, Orders, Billing) rather than technical layers. Expose agent-facing APIs via dedicated APIM products to enable controlled access, throttling, versioning, and independent lifecycle management. Prefer read-only operations where possible; scope write operations narrowly and protect them with explicit checks, approvals, and least-privilege identities. Read‑only APIs should be prioritized, while action‑oriented APIs must be carefully scoped and gated. The Role of the MCP Server in Agent‑Based Architectures APIM provides governance and security, but agents also need an intent-level interface and model-friendly responses. A Model Context Protocol (MCP) server fills this gap by acting as a mediator between Copilot Studio and APIM-exposed APIs. Instead of exposing many back-end endpoints directly to the agent, the MCP server can: orchestrate multiple API calls, filter irrelevant fields, enforce business rules, enrich results with additional context, and emit concise, predictable JSON outputs. This makes agent behavior more reliable and easier to validate. Instead of exposing multiple backend APIs directly to the agent, the MCP server aggregates responses, filters irrelevant data, enriches results with business context, and formats responses into LLM‑friendly schemas. By introducing this abstraction layer, Copilot interactions become simpler, safer, and more deterministic. The agent interacts with a small number of well‑defined MCP operations that encapsulate enterprise logic without exposing internal complexity. Designing an Effective MCP Server An MCP server should have a focused responsibility: shaping context for AI models. It should not replace core back-end services; it should adapt enterprise capabilities for agent consumption. What MCP should do An MCP server should be designed with a clear and focused responsibility: shaping context for AI models. Its primary role is not to replace backend services, but to adapt enterprise data for intelligent consumption. MCP does not orchestrate enterprise workflows or apply business logic. It standardizes how agents discover and invoke external tools and APIs by exposing them through a structured protocol interface. Orchestration, intent resolution, and policy-driven execution are handled by the agent runtime or host framework. It is equally important to understand what does not belong in MCP. Complex transactional workflows, long‑running processes, and UI‑specific formatting should remain in backend systems. Keeping MCP lightweight ensures scalability and easier maintenance. Call APIM-managed APIs and orchestrate multi-step retrieval when needed. Apply security checks and business rules consistently. Filter and minimize payloads (return only fields needed for the intent). Normalize and reshape responses into stable, predictable JSON schemas. Handle errors and edge cases with safe, descriptive messages. What MCP should not do Avoid implementing complex transactional workflows, long-running processes, or UI-specific formatting in MCP. Keep it lightweight so it remains scalable, testable, and easy to maintain. Step by step guide 1) Create an MCP server in Azure API Management (APIM) Open the Azure portal (portal.azure.com). Go to your API Management instance. In the left navigation, expand APIs. Create (or select) an API group for the business domain you want to expose (for example, Orders or Customers). Add the relevant APIs/operations to that API group. Create or select an APIM product dedicated for agent usage, and ensure the product requires a subscription (subscription key). Create an MCP server in APIM and map it to the API (or API group) you want to expose as MCP operations. In the MCP server settings, ensure Subscription key required is enabled. From the product’s Subscriptions page, copy the subscription key you will use in Copilot Studio. Screenshot placeholders: APIM API group, product configuration, MCP server mapping, subscription settings, subscription key location. * Note: Using an API Management subscription key to access MCP operations is one supported way to authenticate and consume enterprise APIs. However, this approach is best suited for initial setups, demos, or scenarios where key-based access is explicitly required. For production‑grade enterprise solutions, Microsoft recommends using managed identity–based access control. Managed identities for Azure resources eliminate the need to manage secrets such as subscription keys or client secrets, integrate natively with Microsoft Entra ID, and support fine‑grained role‑based access control (RBAC). This approach improves security posture while significantly reducing operational and governance overhead for agent and service‑to‑service integrations. Wherever possible, agents and MCP servers should authenticate using managed identities to ensure secure, scalable, and compliant access to enterprise APIs. 2) Create a Copilot Studio agent and connect to the APIM MCP server using a subscription key Copilot Studio natively supports Model Context Protocol (MCP) servers as tools. When an agent is connected to an MCP server, the tool metadata—including operation names, inputs, and outputs—is automatically discovered and kept in sync, reducing manual configuration and maintenance overhead. Sign in to Copilot Studio. Create a new agent and add clear instructions describing when to use the MCP tool and how to present results (for example, concise summaries plus key fields). Open Tools > Add tool > Model Context Protocol, then choose Create. Enter the MCP server details: Server endpoint URL: copy this from your MCP server in APIM. Authentication: select API Key. Header name: use the subscription key header required by your APIM configuration. Select Create new connection, paste the APIM subscription key, and save. Test the tool in the agent by prompting for a domain-specific task (for example, “Get order status for 12345”). Validate that responses are concise and that errors are handled safely. Screenshot placeholders: MCP tool creation screen, endpoint + auth configuration, connection creation, test prompt and response. Operational best practices and guardrails Least privilege by default: create separate APIM products and identities for agent scenarios; avoid broad access to internal APIs. Prefer intent-level operations: expose fewer, higher-level MCP operations instead of many low-level endpoints. Protect write operations: require explicit parameters, validation, and (when appropriate) approval flows; keep “read” and “write” tools separate. Stable schemas: return predictable JSON shapes and limit optional fields to reduce prompt brittleness. Observability: log MCP requests/responses (with sensitive fields redacted), monitor APIM analytics, and set alerts for failures and throttling. Versioning: version MCP operations and APIM APIs; deprecate safely. Security hygiene: treat subscription keys as secrets, rotate regularly, and avoid exposing them in prompts or logs. Summary As organizations scale agent‑based and Copilot‑driven solutions, directly exposing enterprise APIs to AI agents quickly becomes complex and risky. Centralizing API access through Azure API Management, shaping agent‑ready context via a Model Context Protocol (MCP) server, and consuming those capabilities through Copilot Studio establishes a clean and governable architecture. This pattern reduces duplication, enforces consistent security controls, and enables intent‑driven API consumption without exposing unnecessary backend complexity. By combining domain‑aligned API products, lightweight MCP operations, and least‑privilege identity‑based access, enterprises can confidently scale AI agents while maintaining strong governance, observability, and operational control. References Azure API Management (APIM) – Overview Azure API Management – Key Concepts Azure MCP Server Documentation (Model Context Protocol) Extend your agent with Model Context Protocol Managed identities for Azure resources – Overview797Views0likes0CommentsAdvancing to Agentic AI with Azure NetApp Files VS Code Extension v1.2.0
The Azure NetApp Files VS Code Extension v1.2.0 introduces a major leap toward agentic, AI‑informed cloud operations with the debut of the autonomous Volume Scanner. Moving beyond traditional assistive AI, this release enables intelligent infrastructure analysis that can detect configuration risks, recommend remediations, and execute approved changes under user governance. Complemented by an expanded natural language interface, developers can now manage, optimize, and troubleshoot Azure NetApp Files resources through conversational commands - from performance monitoring to cross‑region replication, backup orchestration, and ARM template generation. Version 1.2.0 establishes the foundation for a multi‑agent system built to reduce operational toil and accelerate a shift toward self-managing enterprise storage in the cloud.483Views0likes0CommentsDesigning Reliable Health Check Endpoints for IIS Behind Azure Application Gateway
Why Health Probes Matter in Azure Application Gateway Azure Application Gateway relies entirely on health probes to determine whether backend instances should receive traffic. If a probe: Receives a non‑200 response Times out Gets redirected Requires authentication …the backend is marked Unhealthy, and traffic is stopped—resulting in user-facing errors. A healthy IIS application does not automatically mean a healthy Application Gateway backend. Failure Flow: How a Misconfigured Health Probe Leads to 502 Errors One of the most confusing scenarios teams encounter is when the IIS application is running correctly, yet users intermittently receive 502 Bad Gateway errors. This typically happens when health probes fail, causing Azure Application Gateway to mark backend instances as Unhealthy and stop routing traffic to them. The following diagram illustrates this failure flow. Failure Flow Diagram (Probe Fails → Backend Unhealthy → 502) Key takeaway: Most 502 errors behind Azure Application Gateway are not application failures—they are health probe failures. What’s Happening Here? Azure Application Gateway periodically sends health probes to backend IIS instances. If the probe endpoint: o Redirects to /login o Requires authentication o Returns 401 / 403 / 302 o Times out the probe is considered failed. After consecutive failures, the backend instance is marked Unhealthy. Application Gateway stops forwarding traffic to unhealthy backends. If all backend instances are unhealthy, every client request results in a 502 Bad Gateway—even though IIS itself may still be running. This is why a dedicated, lightweight, unauthenticated health endpoint is critical for production stability. Common Health Probe Pitfalls with IIS Before designing a solution, let’s look at what commonly goes wrong. 1. Probing the Root Path (/) Many IIS applications: Redirect / → /login Require authentication Return 401 / 302 / 403 Application Gateway expects a clean 200 OK, not redirects or auth challenges. 2. Authentication-Enabled Endpoints Health probes do not support authentication headers. If your app enforces: Windows Authentication OAuth / JWT Client certificates …the probe will fail. 3. Slow or Heavy Endpoints Probing a controller that: Calls a database Performs startup checks Loads configuration can cause intermittent failures, especially under load. 4. Certificate and Host Header Mismatch TLS-enabled backends may fail probes due to: Missing Host header Incorrect SNI configuration Certificate CN mismatch Design Principles for a Reliable IIS Health Endpoint A good health check endpoint should be: Lightweight Anonymous Fast (< 100 ms) Always return HTTP 200 Independent of business logic Client Browser | | HTTPS (Public DNS) v +-------------------------------------------------+ | Azure Application Gateway (v2) | | - HTTPS Listener | | - SSL Certificate | | - Custom Health Probe (/health) | +-------------------------------------------------+ | | HTTPS (SNI + Host Header) v +-------------------------------------------------------------------+ | IIS Backend VM | | | | Site Bindings: | | - HTTPS : app.domain.com | | | | Endpoints: | | - /health (Anonymous, Static, 200 OK) | | - /login (Authenticated) | | | +-------------------------------------------------------------------+ Azure Application Gateway health probe architecture for IIS backends using a dedicated /health endpoint. Azure Application Gateway continuously probes a dedicated /health endpoint on each IIS backend instance. The health endpoint is designed to return a fast, unauthenticated 200 OK response, allowing Application Gateway to reliably determine backend health while keeping application endpoints secure. Step 1: Create a Dedicated Health Endpoint Recommended Path 1 /health This endpoint should: Bypass authentication Avoid redirects Avoid database calls Example: Simple IIS Health Page Create a static file: 1 C:\inetpub\wwwroot\website\health\index.html Static Fast Zero dependencies Step 2: Exclude the Health Endpoint from Authentication If your IIS site uses authentication, explicitly allow anonymous access to /health. web.config Example 1 <location path="health"> 2 <system.webServer> 3 <security> 4 <authentication> 5 <anonymousAuthentication enabled="true" /> 6 <windowsAuthentication enabled="false" /> 7 </authentication> 8 </security> 9 </system.webServer> 10 </location> ⚠️ This ensures probes succeed even if the rest of the site is secured. Step 3: Configure Azure Application Gateway Health Probe Recommended Probe Settings Setting Value Protocol HTTPS Path /health Interval 30 seconds Timeout 30 seconds Unhealthy threshold 3 Pick host name from backend Enabled Why “Pick host name from backend” matters This ensures: Correct Host header Proper certificate validation Avoids TLS handshake failures Step 4: Validate Health Probe Behavior From Application Gateway Navigate to Backend health Ensure status shows Healthy Confirm response code = 200 From the IIS VM 1 Invoke-WebRequest https://your-app-domain/health Expected: 1 StatusCode : 200 Troubleshooting Common Failures Probe shows Unhealthy but app works ✔ Check authentication rules ✔ Verify /health does not redirect ✔ Confirm HTTP 200 response TLS or certificate errors ✔ Ensure certificate CN matches backend domain ✔ Enable “Pick host name from backend” ✔ Validate certificate is bound in IIS Intermittent failures ✔ Reduce probe complexity ✔ Avoid DB or service calls ✔ Use static content Production Best Practices Use separate health endpoints per application Never reuse business endpoints for probes Monitor probe failures as early warning signs Test probes after every deployment Keep health endpoints simple and boring Final Thoughts A reliable health check endpoint is not optional when running IIS behind Azure Application Gateway—it is a core part of application availability. By designing a dedicated, authentication‑free, lightweight health endpoint, you can eliminate a large class of false outages and significantly improve platform stability. If you’re migrating IIS applications to Azure or troubleshooting unexplained Application Gateway failures, start with your health probe—it’s often the silent culprit.617Views0likes0Comments
Architecting an Azure AI Hub-and-Spoke Landing Zone for Multi-Tenant Enterprises
A large enterprise customer adopting AI at scale typically needs three non‑negotiables in its AI foundation: End‑to‑end tenant isolation across network, identity, compute, and data Secure, governed traffic flow from users to AI services Transparent chargeback/showback for shared AI and platform services At the same time, the platform must enable rapid onboarding of new tenants or applications and scale cleanly from proof‑of‑concept to production. This article proposes an Azure Landing Zone–aligned architecture using a Hub‑and‑Spoke model, where: The AI Hub centralizes shared services and governance AI Spokes host tenant‑dedicated AI resources Application logic and AI agents run on AKS The result is a secure, scalable, and operationally efficient enterprise AI foundation. 1. Architecture goals & design principles Goals Host application logic and AI agents on Azure Kubernetes Service (AKS) as custom deployments instead of using agents under Azure AI Foundry Enforce strong tenant isolation across all layers Support cross chargeback and cost attribution Adopt a Hub‑and‑Spoke model with clear separation of shared vs. tenant‑specific services Design principles (Azure Landing Zone aligned) Azure Landing Zone (ALZ) guidance emphasizes: Separation of platform and workload subscriptions Management groups and policy inheritance Centralized connectivity using hub‑and‑spoke networking Policy‑driven governance and automation For infrastructure as code, ALZ‑aligned deployments typically use Bicep or Terraform, increasingly leveraging Azure Verified Modules (AVM) for consistency and long‑term maintainability. 2. Subscription & management group model A practical enterprise layout looks like this: Tenant Root Management Group o Platform Management Group Connectivity subscription (Hub VNet, Firewall, DNS, ExpressRoute/VPN) Management subscription (Log Analytics, Monitor) Security subscription (Defender for Cloud, Sentinel if required) o AI Hub Management Group AI Hub subscription (shared AI and governance services) o AI Spokes Management Group One subscription per tenant, business unit, or regulated boundary This structure supports enterprise‑scale governance while allowing teams to operate independently within well‑defined guardrails. 3. Logical architecture — AI Hub vs. AI Spoke AI Hub (central/shared services) The AI Hub acts as the governed control plane for AI consumption: Ingress & edge security: Azure Application Gateway with WAF (or Front Door for global scenarios) Central egress control: Azure Firewall with forced tunneling API governance: Azure API Management (private/internal mode) Shared AI services: Azure OpenAI (shared deployments where appropriate), safety controls Monitoring & observability: Azure Monitor, Log Analytics, centralized dashboards Governance: Azure Policy, RBAC, naming and tagging standards All tenant traffic enters through the hub, ensuring consistent enforcement of security, identity, and usage policies. AI Spoke (tenant‑dedicated services) Each AI Spoke provides a tenant‑isolated data and execution plane: Tenant‑dedicated storage accounts and databases Vector stores and retrieval systems (Azure AI Search with isolated indexes or services) AKS runtime for tenant‑specific AI agents and backend services Tenant‑scoped keys, secrets, and identities 4. Logical architecture diagram (Hub vs. Spoke) 5. Network architecture — Hub and Spoke 6. Tenant onboarding & isolation strategy Tenant onboarding flow Tenant onboarding is automated using a landing zone vending model: Request new tenant or application Provision a spoke subscription and baseline policies Deploy spoke VNet and peer to hub Configure private DNS and firewall routes Deploy AKS tenancy and data services Register identities and API subscriptions Enable monitoring and cost attribution This approach enables consistent, repeatable onboarding with minimal manual effort. Isolation by design Network: Dedicated VNets, private endpoints, no public AI endpoints Identity: Microsoft Entra ID with tenant‑aware claims and conditional access Compute: AKS isolation using namespaces, node pools, or dedicated clusters Data: Per‑tenant storage, databases, and vector indexes 7. Identity & access management (Microsoft Entra ID) Key IAM practices include: Central Microsoft Entra ID tenant for authentication and authorization Application and workload identities using managed identities Tenant context enforced at API Management and propagated downstream Conditional Access and least‑privilege RBAC This ensures zero‑trust access while supporting both internal and partner scenarios. 8. Secure traffic flow (end‑to‑end) User accesses application via Application Gateway + WAF Traffic inspected and routed through Azure Firewall API Management validates identity, quotas, and tenant context AKS workloads invoke AI services over Private Link Responses return through the same governed path This pattern provides full auditability, threat protection, and policy enforcement. 9. AKS multitenancy options Model When to use Characteristics Namespace per tenant Default Cost‑efficient, logical isolation Dedicated node pools Medium isolation Reduced noisy‑neighbor risk Dedicated AKS cluster High compliance Maximum isolation, higher cost Enterprises typically adopt a tiered approach, choosing the isolation level per tenant based on regulatory and risk requirements. 10. Cost management & chargeback model Tagging strategy (mandatory) tenantId costCenter application environment owner Enforced via Azure Policy across all subscriptions. Chargeback approach Dedicated spoke resources: Direct attribution via subscription and tags Shared hub resources: Allocated using usage telemetry o API calls and token usage from API Management o CPU/memory usage from AKS namespaces Cost data is exported to Azure Cost Management and visualized using Power BI to support showback and chargeback. 11. Security controls checklist Private endpoints for AI services, storage, and search No public network access for sensitive services Azure Firewall for centralized egress and inspection WAF for OWASP protection Azure Policy for governance and compliance 12. Deployment & automation Foundation: Azure Landing Zone accelerators (Bicep or Terraform) Workloads: Modular IaC for hub and spokes AKS apps: GitOps (Flux or Argo CD) Observability: Policy‑driven diagnostics and centralized logging 13. Final thoughts This Azure AI Landing Zone design provides a repeatable, secure, and enterprise‑ready foundation for any large customer adopting AI at scale. By combining: Hub‑and‑Spoke networking AKS‑based AI agents Strong tenant isolation FinOps‑ready chargeback Azure Landing Zone best practices organizations can confidently move AI workloads from experimentation to production—without sacrificing security, governance, or cost transparency. Disclaimer: While the above article discusses hosting custom agents on AKS alongside customer-developed application logic, the following sections focus on a baseline deployment model with no customizations. This approach uses Azure AI Foundry, where models and agents are fully managed by Azure, with centrally governed LLMs(AI Hub) hosted in Azure AI Foundry and agents deployed in a spoke environment. 🚀 Get Started: Building a Secure & Scalable Azure AI Platform To help you accelerate your Azure AI journey, Microsoft and the community provide several reference architectures, solution accelerators, and best-practice guides. Together, these form a strong foundation for designing secure, governed, and cost-efficient GenAI and AI workloads at scale. Below is a recommended starting path. 1️⃣ AI Landing Zone (Foundation) Purpose: Establish a secure, enterprise-ready foundation for AI workloads. The AI Landing Zone extends the standard Azure Landing Zone with AI-specific considerations such as: Network isolation and hub-spoke design Identity and access control for AI services Secure connectivity to data sources Alignment with enterprise governance and compliance 🔗 AI Landing Zone (GitHub): https://github.com/Azure/AI-Landing-Zones?tab=readme-ov-file 👉 Start here if you want a standardized baseline before onboarding any AI workloads. 2️⃣ AI Hub Gateway – Solution Accelerator Purpose: Centralize and control access to AI services across multiple teams or customers. The AI Hub Gateway Solution Accelerator helps you: Expose AI capabilities (models, agents, APIs) via a centralized gateway Apply consistent security, routing, and traffic controls Support both Chat UI and API-based consumption Enable multi-team or multi-tenant AI usage patterns 🔗 AI Hub Gateway Solution Accelerator: https://github.com/mohamedsaif/ai-hub-gateway-landing-zone?tab=readme-ov-file 👉 Ideal when you want a shared AI platform with controlled access and visibility. 3️⃣ Citadel Governance Hub (Advanced Governance) Purpose: Enforce strong governance, compliance, and guardrails for AI usage. The Citadel Governance Hub builds on top of the AI Hub Gateway and focuses on: Policy enforcement for AI usage Centralized governance controls Secure onboarding of teams and workloads Alignment with enterprise risk and compliance requirements 🔗 Citadel Governance Hub (README): https://github.com/Azure-Samples/ai-hub-gateway-solution-accelerator/blob/citadel-v1/README.md 👉 Recommended for regulated environments or large enterprises with strict governance needs. 4️⃣ AKS Cost Analysis (Operational Excellence) Purpose: Understand and optimize the cost of running AI workloads on AKS. AI platforms often rely on AKS for agents, inference services, and gateways. This guide explains: How AKS costs are calculated How to analyze node, pod, and workload costs Techniques to optimize cluster spend 🔗 AKS Cost Analysis: https://learn.microsoft.com/en-us/azure/aks/cost-analysis 👉 Use this early to avoid unexpected cost overruns as AI usage scales. 5️⃣ AKS Multi-Tenancy & Cluster Isolation Purpose: Safely run workloads for multiple teams or customers on AKS. This guidance covers: Namespace vs cluster isolation strategies Security and blast-radius considerations When to use shared clusters vs dedicated clusters Best practices for multi-tenant AKS platforms 🔗 AKS Multi-Tenancy & Cluster Isolation: https://learn.microsoft.com/en-us/azure/aks/operator-best-practices-cluster-isolation 👉 Critical reading if your AI platform supports multiple teams, business units, or customers. 🧭 Suggested Learning Path If you’re new, follow this order: AI Landing Zone → build the foundation AI Hub Gateway → centralize AI access Citadel Governance Hub → enforce guardrails AKS Cost Analysis → control spend AKS Multi-Tenancy → scale securely5.5KViews2likes0CommentsDeploy PostgreSQL on Azure VMs with Azure NetApp Files: Production-Ready Infrastructure as Code
PostgreSQL is a popular open‑source cloud database for modern web applications and AI/ML workloads, and deploying it on Azure VMs with high‑performance storage should be simple. In practice, however, using Azure NetApp Files requires many coordinated steps—from provisioning networking and storage to configuring NFS, installing and initializing PostgreSQL, and maintaining consistent, secure, and high‑performance environments across development, test, and production. To address this complexity, we’ve built production‑ready Infrastructure as Code templates that fully automate the deployment, from infrastructure setup to database initialization, ensuring PostgreSQL runs on high‑performance Azure NetApp Files storage from day one.693Views1like0Comments