aks
99 TopicsShrinking the trusted computing base for sensitive cloud workloads
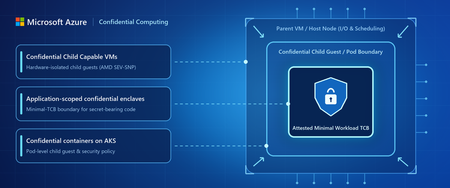
Azure confidential computing is investing across three connected layers to help shrink the workload trusted computing base (TCB): next-generation Confidential Child Capable VMs, confidential enclaves for application-scoped isolation, and support for these next-generation VMs in confidential containers on Azure Kubernetes Service (AKS).Advancing confidential computing with Intel TDX: more performance, more resiliency
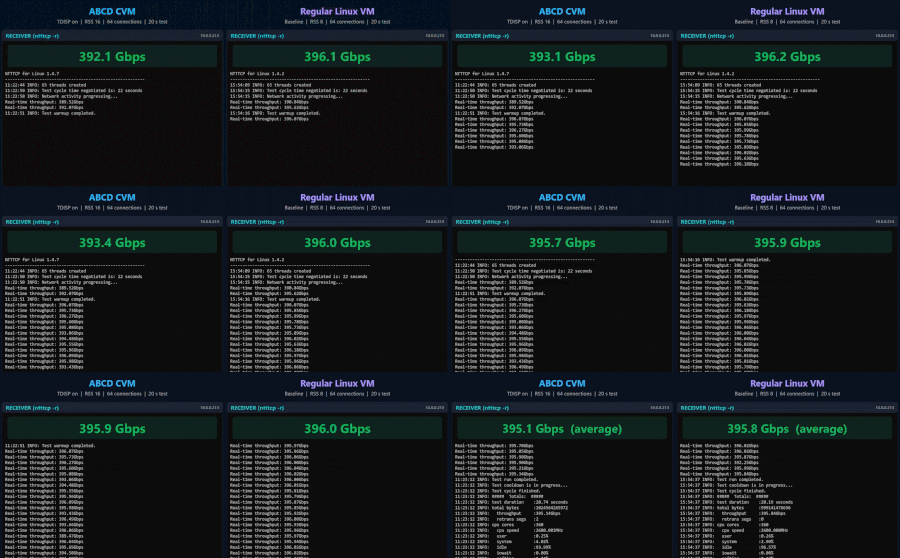
Today at Ignite, we presented an industry-first demonstration of TEE Device Interface Security Protocol (TDISP) with Azure Boost, showcasing up to 400 Gbps of network bandwidth. We also released improvements across our Intel-based portfolio to help enterprises strengthen workload resiliency and improve total cost of ownership for mission-critical workloads.
C-ACI: Security Practices for Healthcare and Financial Services
Healthcare and financial services organizations need to put sensitive data to work, whether analyzing patient records, detecting fraud, or running AI applications. Protecting that data means more than encrypting it in storage and during transmission. It also means limiting who and what can access it while an application is processing it. This post explores how confidential containers on Azure Container Instances (C-ACI) help address that challenge, using healthcare and financial services examples to explain security practices, architecture choices, and operational considerations. While this post focuses on healthcare and financial services, the same patterns extend to any industry or application that works with sensitive data or proprietary code, such as government, defense, and manufacturing. As AI companies and enterprises build agents that act autonomously and run code and workflows against sensitive data, confidential computing will be critical to keeping that data, and the code that processes it, protected and verifiable. For Linux workloads that run code they didn't write, such as AI-generated scripts, plug-ins, or third-party tools, enclaves for confidential containers on ACI (preview) let the main application hand that code to a separate confidential environment with no network access of its own. What are confidential containers on Azure Container Instances? C-ACI runs Linux and Windows (preview) containers in a hardware-protected environment without requiring customers to manage the underlying servers. This environment, called a trusted execution environment (TEE), helps protect application code and sensitive data during processing. For customers, this means reducing reliance on the underlying infrastructure and its administrators to keep that data confidential. Execution policies control permitted operations, while attestation provides verifiable evidence before granting access to sensitive information. How confidential containers achieve isolation Traditional containers rely on the host operating system and its administrators for isolation. C-ACI adds a hardware-backed boundary around the container group, reducing reliance on that infrastructure. Three capabilities work together: Hardware-backed isolation. The container group runs in a protected virtual machine using AMD SEV-SNP. This hardware technology encrypts memory and helps prevent the host and hypervisor from inspecting or changing it. Containers in the group share this security boundary. Execution-policy enforcement. A policy defines which container images, commands, and settings may run. Software inside the protected environment enforces these rules. Policies are generated with the Azure CLI confcom extension using az confcom acipolicygen and reviewed against the application’s security requirements. Permissive or debug policies weaken the protection. Attestation before access. Attestation provides hardware-signed evidence of the environment and its execution policy. Microsoft Azure Attestation (MAA) validates this evidence and issues a signed token. For Secure Key Release (SKR), Azure Key Vault Premium or Azure Key Vault Managed HSM checks the workload’s token against the key’s release rules and verifies authorization before releasing the key. Key Vault Standard does not support SKR. In short, hardware protects the environment, policy controls what may run, and attestation provides evidence of its trustworthiness. Attestation-based key release must be configured; it is not automatic in every deployment. Two ways to deploy confidential containers This security foundation supports two deployment paths: direct deployment through Azure Container Instances or integration with existing AKS workflows. For workloads already managed in AKS, virtual nodes preserve the existing orchestration workflow. For workloads that do not require Kubernetes, direct C-ACI deployment provides a simpler starting point. Direct deployment with C-ACI Direct C-ACI deployment provides serverless execution without operating a Kubernetes cluster. The following diagram shows the protected container group, execution-policy enforcement, and how attestation supports access to keys and sensitive data. Protect sensitive data during processing without managing servers or a Kubernetes cluster. AKS with confidential ACI execution For applications managed through Kubernetes, virtual nodes deploy AKS pods as confidential container groups running on ACI. AKS provides the orchestration workflow, while C-ACI provides the protected execution environment. The AKS control plane sits outside the TEE, and the enforced execution policy prevents cluster administrators from running images, commands, or settings that the policy does not allow inside the protected environment. The following diagram shows how these responsibilities fit together. C-ACI protects data during processing while AKS retains deployment and orchestration responsibilities. Applying these security practices in healthcare and financial services Secure workload design depends on which data needs protection, which software may process it, and what evidence is required before granting access. The following illustrative healthcare and financial services examples connect these choices to business value, security controls, and day-to-day operations. Each uses C-ACI directly for simplicity; the same pattern can also be deployed through AKS virtual nodes. Enclave support, mentioned in two of the examples, is currently available only with direct C-ACI deployment. Healthcare: putting sensitive data to work with controlled access The following examples show how C-ACI can support sensitive healthcare workloads. Validate clinical AI without handing over patient records or proprietary models A hospital wants to evaluate a third-party clinical AI model against its patient population while protecting patient records and the developer’s model intellectual property. The hospital and developer each retain control of their own encryption key and key-release policy, and both agree on the container image and execution policy. Their encrypted data and model are processed together in C-ACI, with each key released only when its owner’s attestation and release-policy requirements are met. Evaluation scripts and analysis tools, whether supplied by the developer or generated by AI, run in an enclave (preview), a separate confidential environment with its own execution policy and no network access. The main application keeps the data connections, and everything those tools return passes back through it. The hospital receives approved evaluation results, not unrestricted access to the model; the developer does not gain unrestricted access to patient records. This approach supports evaluation of third-party clinical AI while protecting patient records and model intellectual property. The essential controls are approved code, restricted connectivity, carefully reviewed outputs, and audit records that exclude sensitive payloads. C-ACI protects patient data from the infrastructure, and the enclave limits what third-party code can do with it. Analyze genomic data with controlled access to patient information A precision-medicine team needs to analyze genomic records alongside clinical histories without unnecessarily exposing patient information. In this C-ACI design, encrypted inputs are processed inside a confidential container group, with decryption keys released only when configured attestation requirements are met. The data provider supplies study identifiers instead of direct patient identifiers wherever possible and maintains the identity mapping under restricted access. The application controls which research results leave the environment, while access restrictions and logging practices help limit further exposure. For technology and security leaders, the value is enabling sensitive analysis with a clearer trust boundary, while recognizing that study identifiers alone do not make genomic data anonymous. Financial services: protecting transaction processing and payment data The following examples show how C-ACI can support sensitive transaction analysis and payment processing. Investigate suspicious transactions without broadening access to raw records A bank wants to investigate suspicious transactions without broadening access to raw account histories and customer information. Authorized analysts submit requests to an approved analysis container running in C-ACI, which returns a bounded set of risk indicators and supporting evidence rather than unrestricted access to the underlying records. When an AI agent writes queries or analysis code for an investigation, that code runs in an enclave (preview) with no network access, while the agent and the bank’s data connections stay in the main application. This approach expands analytical capability within a more explicit trust boundary. Engineering teams must still enforce least-privilege data access, restrict outbound connections, protect logs, and validate results. If an AI agent assists the investigation, its generated code should not automatically receive access to raw records or decryption keys. The enclave turns that principal into a boundary: generated code works on the data it is given but no network path of its own. Keep payment tokenization separate from the wider application A payment provider wants business applications and analytics to use tokens rather than raw card numbers. In this C-ACI design, a dedicated tokenization service processes encrypted payment data inside a confidential container group, with decryption keys released only when configured attestation requirements are met. The application returns tokens to downstream systems, while retrieval of original card details requires separate authorization and auditing. This approach limits how widely sensitive payment data flows. The operational priorities are least-privilege access, protected token mappings, restricted connectivity, and logs that exclude card details. Confidential processing does not by itself remove systems from Payment Card Industry Data Security Standard (PCI DSS) scope or replace its requirements; any scope reduction depends on the tokenization design and validated controls. See the PCI SSC tokenization guidance. Production readiness also requires testing end-to-end latency and sustained throughput under expected payment volumes, and validating high availability and failover across the tokenization service, token mappings, and key-release dependencies. To summarize all four scenarios follow the same pattern: encrypted data enters a protected environment, keys are released only when the environment and execution policy meet configured verification requirements, and only application-approved results leave it. The data and authorized recipients vary by workload. Workloads with these requirements are candidates for confidential containers. When part of a workload runs code you don't fully trust, such as AI-generated code, plug-ins, or analyst scripts, consider enclaves (preview) to give that code its own confidential execution boundary. Get started A practical starting point is a single sensitive workload, with clear requirements for permitted code, data access, and key release. Direct C-ACI deployment offers serverless execution, while AKS virtual nodes retain existing Kubernetes orchestration. The documentation for confidential containers on Azure Container Instances and Virtual Nodes v2 (preview), delivered as an AKS cluster extension, provides guidance for planning an initial deployment.
What’s new in AKS networking: Connectivity, performance, and observability
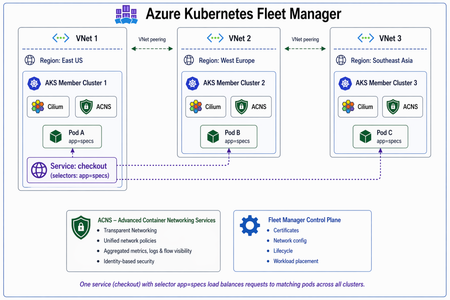
As organizations scale their cloud-native applications, networking requirements continue to evolve. AI and high-performance computing workloads demand high-throughput, low-latency connectivity, applications increasingly span multiple Kubernetes clusters and enterprises need greater control over how workload traffic is routed and isolated. At the same time, platform teams need deeper network visibility that is customizable without the complexity and cost of collecting unnecessary data. At Microsoft, our focus is to simplify these AKS networking challenges, enabling customers to build and scale AI applications without having to manage increasingly complex networking infrastructure. This November, container networking in Azure is introducing four capabilities designed to help customers build, scale, and operate the next generation of applications on AKS. These advancements address three key customer scenarios: · Connect distributed applications: Simplify connectivity and service discovery across Kubernetes clusters, making it easier to build and manage distributed applications. · Enable AI and specialized workloads: Support high-performance networking for distributed AI training and HPC, along with flexible network configurations for data-intensive and specialized applications. · Operate with customizable visibility and control: Gain deeper insights into application networking, troubleshoot issues faster, and manage observability costs through targeted telemetry collection. Together, these capabilities expand what customers can run on AKS while reducing the complexity of the underlying networking infrastructure. Connect distributed applications Cross-cluster networking for Azure Kubernetes Fleet Manager | Generally Available As enterprises scale their applications across multiple Kubernetes clusters, connecting services across cluster boundaries often requires additional networking infrastructure, complex configurations, and operational overhead. With the general availability of cross-cluster networking for Azure Kubernetes Fleet Manager, part of Advanced Container Networking Services, customers can connect workloads across AKS clusters without deploying and managing gateways or proxies. For example, an enterprise running applications across multiple AKS clusters can enable services to discover and communicate with each other as though they were running within a single cluster. Built on Cilium, this capability also extends network policy enforcement and observability across cluster boundaries. The result is simpler multi-cluster application architectures, reduced operational complexity, and greater visibility into application connectivity as environments scale. Learn more about cross-cluster networking at: https://learn.microsoft.com/en-us/azure/kubernetes-fleet/concepts-cross-cluster-networking Enable AI and specialized workloads Multi-NIC pods for AKS | Public Preview Traditional Kubernetes networking provides a single primary network interface for application traffic. However, enterprises running specialized workloads often need to separate different types of network traffic to meet their performance, connectivity, and isolation requirements. With Multi-NIC pods support in AKS, customers can attach multiple network interfaces to Kubernetes nodes and workloads, enabling greater control over how traffic is routed. For example, an enterprise running data-intensive applications can use separate network interfaces for application communication and storage traffic, helping isolate workloads and optimize network resource utilization. Multi-NIC pods give customers greater flexibility to design Kubernetes networking architectures around their application requirements, without having to manage additional networking components themselves. Learn more about Multi-NIC pods at: https://learn.microsoft.com/en-us/azure/aks/multiple-network-interfaces-for-pods-overview Managed support for DRANET for RDMA | Generally Available AI training, machine learning, and high-performance computing workloads require fast, efficient communication between GPUs and compute resources. Configuring and managing the specialized networking infrastructure needed for these workloads can introduce significant operational complexity. With Managed support for DRANET for RDMA NICs in AKS, we're simplifying access to high-throughput, low-latency networking through a managed experience that supports topology-aware resource allocation. For example, organizations running distributed AI training workloads can more easily provision RDMA networking resources to support accelerated communication between compute nodes, without taking on the complexity of managing the underlying networking configuration. This enables customers to focus on scaling their AI and HPC workloads while taking advantage of the performance capabilities of RDMA-enabled Azure infrastructure. Learn more about managed support for DRANET for RDMA at: https://learn.microsoft.com/en-gb/azure/aks/managed-support-for-dranet?tabs=add-ubuntu-rdma-node-pool Operate with customizable visibility and control Configurable dimensions in Advanced Container Networking Services observability | Generally Available Performance and connectivity are only part of operating cloud-native applications at scale. Platform, security, and SRE teams also need the right level of network visibility to troubleshoot applications, investigate threats, and meet compliance requirements. With configurable dimensions for container network observability in Advanced Container Networking Services, customers can now scope the traffic they care about and choose the level of detail to retain. For example, a security team investigating suspicious outbound traffic can retain the DNS query, source pod IP, and destination IP for the affected workload. A security engineer can collect detailed records for a failing namespace, while a compliance team can retain FQDN information for selected egress-facing applications. Customers can now also select network observations by Cilium security identity to deeply investigate unexpected outbound activity and filter logs with external destination IPs and destination port-distribution metrics. These capabilities help platform engineers understand outbound communication patterns and give application teams more context when investigating changes in how a service communicates. The result is persistent, actionable network visibility for security, troubleshooting, and compliance, with control over the scope and cost of the data collected. Learn more about configuring Container Network Logs at: https://learn.microsoft.com/en-us/azure/aks/container-network-observability-logs These announcements reflect our continued investment in making Azure Kubernetes networking simpler to consume while supporting an increasingly diverse set of workloads. Whether customers are connecting applications across clusters, isolating network traffic for specialized workloads, accelerating communication for AI and HPC applications, or building deeper observability, our focus remains the same: deliver the networking capabilities customers need, with less infrastructure to manage and greater flexibility to scale. We're excited to bring these capabilities to our customers and look forward to connecting with the cloud-native community at KubeCon and Ignite.655Views1like1CommentAKS Pod Scheduling Demystified
1. The scheduling question Picture four Azure Kubernetes Service (AKS) worker nodes with the same hardware. One keeps receiving new batch Jobs even as its CPU usage climbs. The natural question is: why does Kubernetes send another pod to a node that already looks busy? The answer is that the scheduler does not work like a live CPU load balancer. Its normal resource checks rely on the requests declared by pods. The process has two decisions: Filtering: Which nodes can run the incoming pod? Scoring: Which of those eligible nodes is the best match according to scheduling rules? Binding and runtime come next. The example below follows the same pod through all five stages. 2. Capacity, allocatable, requests, and usage Term What it means Capacity The CPU and memory a node has. Allocatable The portion Kubernetes makes available to pods, after reservations for system services. Requests The CPU and memory a pod asks Kubernetes to reserve for scheduling. Actual usage The CPU and memory containers are using right now. Suppose a node has 16 allocatable CPU cores. Its running pods request 11 cores but are currently consuming 14 cores. Kubernetes counts 5 unrequested cores when deciding whether another pod fits, not 2 idle cores. A CPU limit is different from a request. A request influences placement; a limit can restrict how much CPU a container uses. 3. One pod from arrival to completion We'll follow one batch pod, batch-worker-01, across workers A, B, C, and D. Each worker has 16 allocatable CPU cores and 64 GiB allocatable memory. Figure 1. The entire scheduling journey, with decisions at filtering, scoring, runtime, and Job completion. Follow the same pod from top to bottom. Stage 1: Filtering. Can each node run the pod? A new pod arrives and asks for 0.25 CPU cores (250m) and 0.5 GiB memory (512Mi). The scheduler checks each worker. For CPU and memory, the fit rule uses the formular: Existing requests + Incoming pod request <= Node allocatable The rule is checked separately for CPU and memory. Required placement rules, including taints and affinity, must also pass. Worker Unrequested CPU before pod Unrequested memory before pod Can the 0.25 CPU / 0.5 GiB pod fit? A 4.80 cores 29 GiB Yes B 4.20 cores 32 GiB Yes C 4.40 cores 43 GiB Yes D 4.60 cores 34 GiB Yes Result: All four workers pass filtering. None has won yet. Their actual CPU usage has not entered this calculation. Stage 2: Scoring. Which eligible node ranks highest? For this walkthrough, look at the default NodeResourcesFit LeastAllocated resource-scoring calculation. It favors a node with more capacity not already requested by pods. We use equal CPU and memory weights of 1 each and MaxNodeScore = 100. The Kubernetes source implements the weighted calculation as: LeastAllocated score: Here A is node allocatable capacity, R is requested capacity including the incoming pod, and w is the resource weight. See the official Kubernetes LeastAllocated implementation and scheduler configuration reference. The denominator is 2 here because CPU and memory each have weight 1. The scheduler considers the incoming pod's request, so subtract 0.25 CPU and 0.5 GiB before scoring each candidate: Worker CPU left after pod Memory left after pod Formula using 16 CPU and 64 GiB allocatable Score / 100 A 4.55 28.5 GiB [(4.55/16 × 100) + (28.5/64 × 100)] / 2 36.5 B 3.95 31.5 GiB [(3.95/16 × 100) + (31.5/64 × 100)] / 2 37.0 C 4.15 42.5 GiB [(4.15/16 × 100) + (42.5/64 × 100)] / 2 46.2 D 4.35 33.5 GiB [(4.35/16 × 100) + (33.5/64 × 100)] / 2 39.8 For worker C: Worker C score after accounting for the incoming pod: Result: Worker C ranks first for this resource-scoring calculation. Worker A has slightly more unrequested CPU, but C's larger memory advantage wins under equal weighting. The default Kubernetes scheduler also has other scoring components, including resource balance and image locality. Thus, this is the resource-plugin score, not a guarantee of the final combined result. Stage 3: Binding. Where does the pod go? Assume the other scoring components do not change the ranking. The scheduler assigns batch-worker-01 to worker C. Result: The pod has a selected node. The kubelet on that node can now start its container. Stage 4: Runtime. Why can worker C still become busy? The pod's CPU request stays at 0.25 cores, even if its program starts consuming substantially more CPU. Suppose its workload uses 1.2 cores while it runs. Scheduler accounts for Pod actually consumes 0.25 CPU requested 1.2 CPU cores in use Worker C still has request-based headroom Worker C may be busy running other pods Future pods are checked against requests More overlapping work can increase CPU contention Try the CPU behavior in a test cluster. The following Pod runs two CPU-working Python processes for around 45 seconds. Unlike a sleep command, the processes actively use CPU. Their exact consumption depends on what CPU is available, but their request remains 250m. apiVersion: v1 kind: Pod metadata: name: batch-worker-01 labels: app: batch-cpu-demo spec: restartPolicy: Never containers: - name: worker image: python:3.12-alpine command: - python - -c - | import multiprocessing as mp import time def work(): end = time.monotonic() + 45 while time.monotonic() < end: pass processes = [mp.Process(target=work) for _ in range(2)] for p in processes: p.start() for p in processes: p.join() resources: requests: cpu: 250m memory: 512Mi Save as batch-worker.yaml, then run in an approved test namespace: kubectl apply -n <test-namespace> -f .\batch-worker.yaml kubectl get pod batch-worker-01 -n <test-namespace> -o wide kubectl top pod batch-worker-01 -n <test-namespace> --containers kubectl delete pod batch-worker-01 -n <test-namespace> Run kubectl top while the pod is active, and use Grafana if you want a graph of CPU consumption over time. This tests the difference between requested and actual CPU; a single pod will not demonstrate a lasting node-wide scheduling imbalance. Stage 5: Completion. What happens to its reservation? When the workload finishes and the completed pod stops counting toward active scheduling requests, its 0.25-core reservation is released. Its CPU usage also stops. Worker C may therefore look attractive again when the next Job arrives. A new Job begins a new filtering and scoring cycle. Worker C does not automatically win again, but repeated short-lived Jobs can keep a node busy while reservations are repeatedly freed and reused. The journey in one sentence: A pod fits on four nodes, worker C scores highest under the example resource score, the scheduler binds it there, it runs using more CPU than requested, then finishes and frees its reservation for the next scheduling cycle. 4. Why memory can outweigh CPU All four workers have the same 64 GiB allocatable memory, but their existing pods reserve different amounts: Worker Memory reserved by existing pods Unrequested memory A 35 GiB 29 GiB B 32 GiB 32 GiB C 21 GiB 43 GiB D 30 GiB 34 GiB Worker C does not have more physical memory. It simply has less memory requested by the pods already there. Under equal-weight LeastAllocated scoring, that can be enough to give C the higher resource score even if another worker has more unrequested CPU. 5. How to investigate an uneven placement pattern Start with these three questions: Which nodes were eligible? Compare allocatable resources, pod requests, taints, affinities, and pod-count limits. Why might one node score better? Compare CPU and memory requests, not just live usage. What happened after binding? Compare actual CPU usage, new pods per node, Job completions, and pod startup time. For current node state, use PowerShell and kubectl: kubectl config current-context kubectl get nodes -o wide kubectl describe node <node-name> kubectl describe node shows current state, not what the node looked like last week. In Grafana, look for historical kube_node_status_allocatable, kube_pod_container_resource_requests, kube_pod_info, and container_cpu_usage_seconds_total. Compare nodes at the same timestamps. Where available, use kube_pod_status_scheduled_time for pod scheduling times, rather than treating pod creation time as binding time. For control-plane evidence, AKS can export the kube-scheduler log category through diagnostic settings. These logs establish which pod was bound, where, and when, but do not always contain scoring details. See AKS monitoring resource logs. 6. How to prevent pods piling onto one node A few workload-level changes usually deserve attention before changing scheduler profiles: Right-size CPU requests. If pods commonly consume much more CPU than they request, scheduling can pack too much real work onto a node. Size requests from actual application measurements. Spread related pods. A hostname-based topologySpreadConstraints rule can encourage more even placement. ScheduleAnyway prefers spreading, while DoNotSchedule can block placements that exceed a configured skew. Control batch concurrency. Limit .spec.parallelism for individual Jobs, or use controller-side limits or Kueue admission for many independent Jobs. Reintroduce nodes carefully. Uncordoning immediately makes a node eligible for ordinary scheduling. Test with approved workloads and monitor placements before opening it fully. For example, a Job template can include: topologySpreadConstraints: - maxSkew: 2 topologyKey: kubernetes.io/hostname whenUnsatisfiable: ScheduleAnyway labelSelector: matchLabels: app: batch-worker Remember that ScheduleAnyway is a preference, not a guarantee of equal pod counts. Test rules against your own workload mix. Changing to a bin-packing strategy such as MostAllocated is not an automatic fix for CPU-heavy workloads that under-request CPU. 7. Conclusion and references The Kubernetes scheduler starts with pod requests, not the node's live CPU graph. Filtering determines where the pod can run, and scoring decides which eligible node is preferred. In our example, worker C wins the resource score because its unrequested memory offsets a small CPU difference. Once the pod runs, its real CPU use may exceed what the scheduler reserved. Practical takeaway: Use realistic requests, spread workloads where balance matters, manage Job concurrency, and compare scheduler evidence with runtime metrics before deciding that a busy node is being scheduled incorrectly. Learn more Kubernetes scheduling framework Kubernetes scheduler configuration Kubernetes LeastAllocated scoring source Kubernetes resource management Kubernetes topology spread constraints AKS scheduler guidance AKS control-plane logsCoreDNS in AKS: service discovery, upstream DNS, and failover
1. Where CoreDNS fits in AKS A pod can resolve another Kubernetes Service but fail to resolve a database name outside the cluster. CoreDNS can be running normally in both cases. That distinction matters because several problems can look like the same DNS outage: A cluster Service name fails. The namespace, Service record, or path from the pod to cluster DNS may be wrong. A name outside the cluster fails. CoreDNS may be reachable, but the upstream server or its network path may not be. A lookup eventually succeeds, but the application fails. The application may have stopped waiting before DNS returned an answer. CoreDNS is the default cluster DNS service in AKS. It runs as pods in kube-system, rather than as code inside your application or as a server hosted in the AKS control plane. It has two important jobs: Kubernetes service discovery: Answer names associated with Kubernetes resources, so workloads do not have to track changing addresses. Upstream forwarding: Send queries that require another DNS server to the configured upstream resolvers. Microsoft's AKS DNS concepts guide explains this architecture. The key operational lesson is simple: CoreDNS is part of the resolution path, but it is not the owner of every DNS answer. Who this is for: Platform engineers, application developers, and operations teams who want a practical understanding of CoreDNS in AKS. 2. How a pod gets a DNS answer For a typical pod using dnsPolicy: ClusterFirst, without a node-local DNS layer, the path looks like this: Application in a pod -> cluster DNS Service: kube-dns -> CoreDNS pod -> Kubernetes Service information: answer a cluster Service name -> upstream DNS server: forward a name handled outside the cluster -> DNS answer returns to the application The Service is still named kube-dns even when CoreDNS handles its traffic. That name does not mean the cluster is running the older kube-dns implementation. Kubernetes configures the pod's resolver settings, including its nameserver and search domains. For Linux containers, these are visible in /etc/resolv.conf. Cluster Service names Consider a regular ClusterIP Service named orders in the checkout namespace. With the cluster domain cluster.local, its full name is: orders.checkout.svc.cluster.local CoreDNS's kubernetes plugin uses Kubernetes resource information to answer that name with the Service's cluster IP. It does not need to ask a corporate or public DNS server for that Service record. The namespace matters. A pod in checkout may use the short name orders; a pod in another namespace normally needs orders.checkout or the full name. See Kubernetes DNS for Services and Pods for the naming rules. Names handled by another DNS server For a name outside its configured cluster zones, CoreDNS can use the forward plugin to contact another DNS server. That may be an Azure-provided resolver or a custom resolver, depending on the cluster's network and DNS configuration. Do not assume that every AKS cluster forwards to the same address or that two configured addresses always mean primary and backup. Inspect the effective CoreDNS configuration and the upstream resolver settings it references. Caching can also change the path. A valid cached answer may avoid an upstream query entirely. LocalDNS can change the first hop If AKS LocalDNS is enabled, the pod can contact a DNS proxy and cache on its node first. Cluster-domain queries are forwarded to CoreDNS, while other queries can go through CoreDNS or directly to an upstream, depending on the DNS policy and LocalDNS configuration. The diagram above is therefore a starting point, not a universal packet trace. Check whether LocalDNS is active before deciding which resolver to inspect. The AKS DNS concepts guide describes these alternate paths. 3. What AKS manages and what you can customize AKS manages the CoreDNS deployment and its main configuration. The Corefile, stored in the coredns ConfigMap, tells CoreDNS which plugins and forwarding rules to use. Three plugin responsibilities are useful to recognize: Plugin What it does kubernetes Answers DNS queries for configured Kubernetes zones using cluster resource information. forward Sends matching queries to upstream DNS servers. cache Reuses stored DNS responses when enabled and allowed by its configuration. An upstream failure affects queries that need that upstream. It does not automatically mean that normal Kubernetes Service records have become unavailable. For supported customization, AKS provides the coredns-custom ConfigMap. Microsoft documents custom entries with names ending in .server or .override, including domain-specific forwarding examples. Do not edit the managed main Corefile as a shortcut. A CoreDNS option being valid does not mean that every way of applying it is supported in AKS. For example, forwarding one private domain to designated resolvers is different from replacing the managed root forwarding behavior for the entire cluster. Follow the AKS CoreDNS customization guidance for the intended change. Also check the deployed image. The tests discussed here used CoreDNS 1.13.1. A setting shown in documentation for a newer CoreDNS release may not exist in that image. 4. How CoreDNS selects and checks upstream servers Once a query reaches the forward plugin, three separate decisions matter: which server to try, when to try another, and whether a server should be skipped on later queries. Selection policy chooses the starting server For CoreDNS 1.13.1: random chooses among eligible upstreams. It is the default when no policy is specified. round_robin rotates the initial choice. sequential tries upstreams in their configured order, preferring the first one not marked unhealthy. Here is an illustrative isolated-lab fragment, not a change to apply to AKS-managed CoreDNS. The addresses are placeholders: forward . <primary-dns-ip> <backup-dns-ip> { policy sequential failover SERVFAIL } policy sequential controls the order. failover SERVFAIL permits another upstream attempt when the response says the server could not complete the lookup. Those are different settings for different decisions. A missing reply and an error reply are different If packets are silently dropped, CoreDNS receives no answer and must wait for a timeout. If the server returns SERVFAIL, CoreDNS has received a DNS error response. By default, the forward plugin returns that SERVFAIL to the caller instead of trying another server. An explicit failover rule can change the handling of selected response codes. Protocol matters too. User Datagram Protocol (UDP) does not open a connection before sending the query. Transmission Control Protocol (TCP) does. In this release, the read timeout is two seconds. Opening a TCP connection has a separate timeout that starts at 30 seconds and can decrease toward one second based on recent connection times. There is no single timeout that describes every failure. These behaviors are documented in the CoreDNS 1.13.1 forward reference. Health checks change later selections The forward plugin starts upstream health checking after a network error. It does not continuously poll every untouched healthy upstream before any failure occurs. The documented default check interval is 0.5 seconds. That is not a promise that failover finishes in half a second: the triggering query may already be waiting for a timeout. max_fails controls how many failed health checks mark an upstream unhealthy. Its default is 2; the application-impact lab used 1 to make the change easier to observe. A DNS error response can still prove network reachability. Health checking therefore does not prove that an upstream can successfully resolve every name your application needs. Each CoreDNS process keeps its own upstream health state. Testing one replica does not establish the state of every replica, and restarting a resolver resets that state. The health-check guide and evidence distinguish source-backed behavior from measured, partial, and inconclusive cases. 5. What failure tests on AKS showed The run used Kubernetes v1.35.7 and image mcr.microsoft.com/oss/v2/kubernetes/coredns:v1.13.1-20. Tests ran against separate CoreDNS resolvers and controlled upstream servers in an isolated namespace. They did not inject faults into AKS-managed CoreDNS or validate every production DNS path, including LocalDNS. The test resolver used sequential selection and max_fails 1. Query times below are in milliseconds (ms). Test condition Recorded result First UDP query after silent primary packet loss Backup answer in 2,000 ms Independent one-second and two-second client timeouts Both clients received no response before timing out Five-second client timeout Backup answer in 2,000 ms Three later queries after the primary was marked unhealthy Backup answers, each displayed as 0 ms Primary returned SERVFAIL, with default handling SERVFAIL returned to the client Same error with failover SERVFAIL configured Successful answer from the backup First forced-TCP query with silent primary packet loss SERVFAIL, no address answer, after 30,000 ms Both test upstreams blocked No response before the five-second client timeout Five additional independent UDP failure cycles reached the backup in 2,000-2,004 ms on the first query. Their later queries took 0-4 ms. The result summary and raw query output retain the details. These are observations for one image and controlled failure conditions, not guaranteed AKS timings. A displayed 0 ms reflects the tool's timing precision, not zero latency. The practical lesson: an available CoreDNS pod, a reachable backup, and a successful application request are three different things. 6. Troubleshooting the right part of the DNS path Start by separating cluster Service resolution from upstream resolution. Then inspect the configuration before changing it. Prerequisites: PowerShell 7+, installed and authenticated kubectl, and permission to read CoreDNS Deployments, pods, Services, and ConfigMaps in the intended cluster. Check the context first and stop if it is not the correct cluster. The following commands are read-only. kubectl config current-context kubectl get deployment coredns -n kube-system ` -o jsonpath='{.spec.template.spec.containers[0].image}' kubectl get pods -n kube-system -l k8s-app=kube-dns kubectl get service kube-dns -n kube-system kubectl get configmap coredns -n kube-system -o yaml Use the findings to narrow the investigation: Only a cluster Service name fails: Check the Service name, namespace, and record type. Confirm that the Service exists and that the pod is using the expected cluster DNS path. Only names requiring an upstream fail: Check the matching forwarding rule, upstream reachability, and the upstream's ability to resolve that name. Only some pods fail: Compare their DNS policies, resolver settings, node-local DNS path, and network access. A successful query from another pod is useful, but not conclusive. The first query is slow and later queries are fast: Check upstream health state and caching. Do not assume the first result was an unrelated glitch. CoreDNS returns SERVFAIL: Identify whether it came from an upstream response or another failure. Do not assume it means packets were lost. Measure DNS latency with dig's Query time. The elapsed time of kubectl exec also includes Kubernetes API communication and process startup. Finally, look at the application. A reused connection may avoid DNS, a cached answer may hide an outage, and retries may increase load. A client can time out even if CoreDNS eventually finds an answer. The latest suite recorded 13 passing DNS and environment checks and five blocked application-specific cases. No representative application was supplied, so caching, connection reuse, retries, application telemetry, and service-level objective (SLO) impact were not established. A DNS test alone cannot prove the user's experience. 7. A repeatable way to validate CoreDNS behavior The CoreDNS repository folder organizes these questions into five detailed guides: Guide What to validate Selection policy Which upstream is tried first, and how the policy behaves during failure. Timeout behavior The difference between waiting for a reply, opening a connection, and the client's own timeout. Failover mechanism Network failures, DNS error responses, recovery, and all-upstream failure. Health checks How errors start checks and how health state affects later queries. Application and user impact Which DNS results are measured and which application effects still require a workload test. Each guide maps a question to named test cases, expected results, pass/fail criteria, and an Established evidence section. That section should tell you what happened, when it happened, and what the result does not prove. Prerequisites for fault testing: An authorized test cluster, PowerShell 7+, authenticated kubectl, permission to create and remove namespace-local test resources, and a network implementation that enforces the test NetworkPolicies. Review the selected guide's full setup and cleanup instructions before execution. Use an isolated test resolver. Do not change managed kube-system resources to reproduce an upstream failure. If another test namespace already exists and ownership is unclear, choose a unique namespace instead of deleting it. The published examples include the original lab context and paths beginning with 07-CoreDNS. A GitHub clone uses coredns. Adjust these values for your environment before running a suite. Cleanup is part of the test. In the current run, the unique test namespace was removed, all six base-lab Deployments remained Available, both managed CoreDNS replicas remained Available, and the managed Deployment resource version was unchanged. 8. Conclusion and next steps CoreDNS connects AKS workloads to both Kubernetes service discovery and the wider DNS environment. Understanding where a query is answered is the first step toward understanding why it failed. Start with the pod's DNS path. Inspect the CoreDNS version and configuration. Separate Service records from upstream queries. Then test selection, timeouts, health checks, and application behavior without changing managed cluster DNS. Understand the path before changing the policy. Validate the behavior before promising the outcome. Try it now Prerequisites: Git, PowerShell, network access to GitHub, and a working directory without an existing aks-stuff folder. No Azure permissions are needed to download the guides. These commands do not deploy resources or run failure tests. git clone https://github.com/jvargh/aks-stuff.git Set-Location .\aks-stuff Get-Content .\coredns\README.md Learn more CoreDNS guidance and test suites DNS concepts in AKS Supported CoreDNS customization in AKS Latest validation summary and recorded query output Connect and contribute Share a reproducible finding through the GitHub repository. Include the CoreDNS version, DNS path, test case, failure condition, client timeout, measured result, and cleanup outcome. Remove credentials, private addresses, and customer identifiers before sharing logs. Start here: github.com/jvargh/aks-stuff/tree/main/corednsCentral pki
Has anyone implemented a centralised PKI where the Root CA is stored in Azure Key Vault and workloads can automatically obtain the Root CA when they are deployed, as well as receive updated versions when the Root CA needs to be rotated or renewed? I’m looking to implement a centralised PKI for an Azure hub-and-spoke architecture, where workloads across the spokes can automatically obtain and trust the Root CA. The workloads could include VMs, AKS, containers, App Services and Azure Functions. I’m aware that Azure Machine Configuration can be used to deploy certificates to VMs, but this is specific to VMs. What is the recommended approach for distributing the Root CA to the other Azure workload types using a consistent and automated mechanism? Ideally, I’d like the solution to be fully automated, so that new workloads receive the current Root CA during deployment and existing workloads automatically receive updated versions whenever the Root CA is rotated or renewed. I will be deploying the root ca in a key vault via terraform a project for the root ca only to update whenever is needed and then each resources to be able to get the latest root ca. Has anyone implemented something similar, or could you provide guidance on the recommended architecture and distribution mechanism?334Views0likes1CommentContainer Network Insights Agent (CNIA): Your AI Teammate for AKS Networking Incidents
Hello Folks! If you run AKS in production, you already know the script. A pod cannot reach an external service, every dashboard says the cluster is healthy, and somebody is SSHing into a node with five browser tabs open trying to piece the story together. This session from the Microsoft Azure Infra Summit 2026 tackles that exact pain. Shaifali Garg (PM for Azure Container Networking on AKS) sits down with Jonathan Wang, an AKS operator running 30 clusters across two regions on Cilium, and they walk through what a real networking incident feels like, then introduce the Container Network Insights Agent (CNIA) live in the cluster. Why IT Pros Should Care In Jonathan’s environment, about 40% of incidents end up being networking problems. The tools all exist (kubectl, dashboards, detectors, Hubble), but the time sink is figuring out which layer the problem lives in and what to check next. CNIA goes after that gap. Here is what you actually get back: A symptom-to-classification jump in seconds, so you skip the first 30 minutes of “is this DNS, policy, node, or app?” One chat window with one evidence table, one root cause, and one copy-paste fix command, instead of jumping across five tabs Senior SRE tribal knowledge baked into the workflow, so anyone on the team can run the same investigation a principal engineer would Read-only by design, so the agent never changes anything on your cluster. You stay the human in the loop Installs as an AKS extension (no Helm chart, no YAML to babysit), and Azure handles the lifecycle In short, CNIA is not trying to replace your SRE team. It hands them back 20 or 30 minutes on every networking ticket, which adds up fast across a fleet. What CNIA Is, A Technical Overview Think of CNIA as an AI teammate that lives inside your AKS cluster as a pod. You describe what is broken in plain English, the way you would ping a senior engineer on Slack, and behind the scenes the agent does four things in order. It classifies the kind of problem (DNS, egress, policy, node, app), it pulls live evidence from your cluster, it analyzes that evidence, and it hands you back a clean report with evidence, root cause, and a copy-paste exec command. Two architectural choices stand out. First, the agent uses your own Azure OpenAI resource (bring your own), so prompts and diagnostic content stay in your tenant and your region. Microsoft does not see your diagnostic data, and nothing gets persisted externally. Second, the answer is grounded in evidence pulled from your cluster, not from the internet. Your pods, your policies, your CoreDNS, your host-level NIC and kernel counters. If the evidence is inconclusive, CNIA says so rather than fabricating a root cause. That last bit is what earns trust with senior SREs. CNIA fits inside the broader Advanced Container Networking Services (ACNS) story on AKS. ACNS gives you metrics in Azure Managed Prometheus and Grafana, stored and on-demand network logs with Hubble, and FQDN-based filtering with Cilium. CNIA sits on top, automating the triage loop across those signals so you do not have to walk through the playbook by hand every time. How It Works, Under the Hood The install is an AKS extension. Roughly 5 to 7 minutes from “az aks extension” to “you have an SRE buddy in your cluster.” One small pod runs continuously. A second helper only spins up on the node during a deep packet-drop investigation, reads host-level network counters, and is cleaned up right after. Nothing left behind. Permissions are deliberately narrow: Read-only RBAC on the cluster. The agent looks, it never changes anything A workload identity tied to your Azure OpenAI resource. No shared credentials Outbound traffic is HTTPS to your OpenAI endpoint on port 443, and nothing else. If you want to log that further through an NSG or firewall, that is supported On the safety side, CNIA layers two protections against prompt injection. The agent is scope-restricted by design, so off-topic requests get rejected straight away. In one of Jonathan’s demos, Shefali asks the agent to “delete core-dns” and to “write a script to scrape LinkedIn profiles.” Both are refused on the spot. The second layer is the read-only RBAC at the cluster level. Even if someone tricked the prompt into emitting a destructive command, the cluster itself would refuse. The pod’s execution is scoped to specific diagnostic commands. It is not an open shell. Honest tradeoffs, because you will ask: It is one cluster at a time. Multi-cluster correlation is not in scope yet It does not auto-remediate. It tells you the fix, you verify and run it It is AKS only. EKS and GKE are not supported today Session state lives in the pod in memory. If the pod restarts, you start a fresh chat (past sessions are still available in history) Heavy packet-drop investigations have been validated up to around 7 concurrent users on smaller clusters. The team is actively scaling that up Real-World Value The session includes two demos that map directly to incidents you have probably lived through. Demo 1, egress that silently dies. Pods cannot reach google.com. CoreDNS resolves it fine, example.com works from the same pod, every dashboard says healthy. CNIA classifies it as an egress connectivity problem (not DNS) and surfaces the actual culprit: a Cilium network policy named “restrict external FQDN” with a toFQDN rule that only allows example.com. Everything else gets silently dropped at the egress gate. DNS was allowed, the TCP connection was not. The fix command (a kubectl patch to add google.com to the allow list) is right there in the report. End-to-end fix in under a minute. Demo 2, the target port typo. A service is down with connection refused. Pods running, service exists, endpoints populated, no network policies. The agent goes inside the pod, looks at the actual listening sockets, and proves the mismatch: target port 8080, but nginx listens on port 80. One-digit typo in YAML that no kubectl get would surface on its own. The ROI math is straightforward. If your team handles networking incidents weekly and each one costs 20 to 30 minutes of “where do I even start,” that capacity adds up across the org. And critically, the win is not just speed. When the one engineer who knows where to look goes on leave, the rest of the team is no longer stuck calling them at home. Getting Started Three steps. That is it. Read the public docs, get an overview, scan the use cases, and understand what CNIA does and does not cover Pick a cluster (dev or staging is a great place to start) and install the AKS extension. Give it 5 to 7 minutes Run a few real network tickets through it. Compare your time-to-answer before and after. Hit thumbs-up or thumbs-down in the chat so the product team sees real signal Pricing in preview: no license fee. You pay for the Azure OpenAI tokens it uses (your tenant, your resource), plus the tiny bit of cluster compute for the pod. If you already have Azure OpenAI in your tenant, just point CNIA at it. Resources Diagnose and resolve AKS network issues with Advanced Container Networking Services Advanced Container Networking Services overview Configure Azure CNI Powered by Cilium in AKS AKS cluster extensions Deploy and configure Microsoft Entra Workload ID on an AKS cluster What is Azure OpenAI Service? Keep Learning at the Summit Catch the full Microsoft Azure Infra Summit 2026 session playlist here: https://www.youtube.com/playlist?list=PLjt5SKzX1iI8con7FJDB56G6hHqxGm7ki Cheers! Pierre Roman486Views0likes0CommentsMultithreading, GIL e paralelismo no Python
Concorrência vs. paralelismo Os dois conceitos são parecidos, mas não são a mesma coisa: Concorrência: lidar com várias tarefas ao mesmo tempo, alternando entre elas. As tarefas progridem de forma intercalada, mas não necessariamente executam no mesmo instante. É ideal para trabalho I/O-bound (rede, disco, banco de dados), onde o programa passa a maior parte do tempo esperando. Paralelismo: executar várias tarefas literalmente ao mesmo tempo, em múltiplos núcleos de CPU. É o que acelera trabalho CPU-bound (cálculo pesado, compressão, hashing). Resumindo: todo paralelismo é concorrência, mas nem toda concorrência é paralelismo. Para concorrência de I/O sem threads, o Python oferece o asyncio , baseado em uma única thread com um event loop e a sintaxe async / await . Como ele não cria threads nem processos, é leve e eficiente para milhares de conexões simultâneas — mas não oferece paralelismo de CPU. Threads e o GIL: por que multithreading não paraleliza CPU O módulo threading permite criar threads reais do sistema operacional, mas o CPython usa o GIL (Global Interpreter Lock): uma trava global que garante que apenas uma thread execute bytecode Python por vez. Por que ele existe? O GIL simplifica o interpretador e torna o modelo de objetos (incluindo tipos como dict ) implicitamente seguro contra acesso concorrente, além de facilitar a integração com bibliotecas C. O preço é abrir mão de boa parte do paralelismo em máquinas multi-core. Na prática: Tarefas I/O-bound se beneficiam de threads, pois o GIL é liberado durante operações de I/O (e por extensões como hashlib / zlib em trechos pesados). Tarefas CPU-bound não escalam com threads: o GIL serializa a execução, e usar mais threads não deixa o programa mais rápido — às vezes até o deixa mais lento pelo overhead de troca de contexto. Desde o Python 3.13 existe um build experimental free-threaded (compilado com --disable-gil , descrito na PEP 703) que permite desligar o GIL. Porém isso exige um interpretador compilado especificamente para isso ( python3.14t ); as compilações padrão não permitem desabilitá-lo. O GIL não dispensa sincronização Mesmo com o GIL, ainda precisamos nos preocupar com sincronização. O GIL garante que uma instrução de bytecode não seja interrompida no meio, mas operações de alto nível (como contador += 1 ) envolvem várias instruções de bytecode e podem sofrer race conditions se uma thread for interrompida no meio delas. Por isso o módulo threading oferece primitivos de sincronização — todos usáveis com with para liberação automática: Lock / RLock — exclusão mútua. Semaphore — limita o número de acessos simultâneos. Condition / Event — coordenação entre threads. Multiprocessing: paralelismo real com processos A saída para aplicações CPU-bound é o módulo multiprocessing (ou o ProcessPoolExecutor do concurrent.futures ). Em vez de threads, ele cria processos separados, e cada processo tem seu próprio interpretador e seu próprio GIL, permitindo paralelismo real em múltiplos núcleos. O custo intrínseco é que criar um novo processo cria também um interpretador Python inteiro, o que é pesado em memória e no tempo de inicialização. Além disso, processos não compartilham memória: os dados precisam ser serializados (via pickle ) e trocados por mecanismos de comunicação entre processos como Queue e Pipe , ou por memória compartilhada. Isso torna a sincronização mais complexa e adiciona overhead de comunicação. Benchmark: medindo o impacto do GIL Para comprovar o conceito, um pequeno script calcula muitos hashes SHA-256 encadeados (uma tarefa puramente CPU-bound) e distribui esse trabalho de três formas, usando concurrent.futures : Sequencial — executa tudo em uma única thread, servindo de baseline. ThreadPoolExecutor — divide o trabalho entre várias threads. ProcessPoolExecutor — divide o trabalho entre vários processos. Cada abordagem é medida em tempo de execução e memória consumida. Rodando no Python 3.14.6 (16 núcleos), o resultado foi: Abordagem Tempo Speedup Memória ------------------------------------------------------------ Sequencial 0.79s 1.00x 0.0 MB ThreadPoolExecutor 0.80s 0.99x 0.2 MB ProcessPoolExecutor 0.31s 2.56x 148.6 MB Interpretando os números: As threads não aceleraram a tarefa (speedup ~1.0x, praticamente igual ao sequencial). O GIL serializou a execução do bytecode: mesmo com várias threads, apenas uma roda por vez, então não há ganho de paralelismo para trabalho de CPU. Os processos foram ~2.5x mais rápidos. Como cada processo tem seu próprio interpretador e seu próprio GIL, o trabalho realmente rodou em paralelo em vários núcleos. Esse paralelismo cobra um custo de memória: os 8 processos consumiram ~148 MB (~18,6 MB por interpretador novo), contra apenas ~0,2 MB das threads, que compartilham o mesmo processo. É o trade-off central entre threading e multiprocessing : velocidade real de CPU ao preço de duplicar o interpretador em memória. Conclusão: I/O-bound ou CPU-bound? O GIL é a razão pela qual multithreading no CPython não entrega paralelismo de CPU. A regra prática é: I/O-bound → use threading ou asyncio (o GIL é liberado durante a espera). CPU-bound → use multiprocessing , aceitando o custo de memória e de comunicação entre processos. No futuro, o build free-threaded (PEP 703) promete paralelismo real com threads e sem o custo de vários interpretadores — mas ainda depende de um interpretador compilado sem o GIL. Escolher a ferramenta certa depende, antes de tudo, de entender se o gargalo é de I/O ou de CPU.326Views1like0CommentsLock Down AKS End to End with Application Gateway for Containers and Managed Cilium L7
Hello Folks! If your AKS cluster looks like most production clusters I have walked through, one of two things is true. Either nobody writes any network policies and every pod can talk to every other pod, so one compromised container blows up the entire blast radius. Or somebody wrote a few coarse rules along the lines of “namespace A talks to namespace B over port 80”, which sounds secure right up until an attacker realizes that port 80 is exactly where they were planning to live anyway. Real attacks happen at Layer 7, dressed up like ordinary HTTP traffic, and L3 / L4 plumbing cannot tell the difference. That is the gap session MAIS09 from the Microsoft Azure Infrastructure Summit 2026 closes. Vyshnavi Namani and Darshil Shah from the Azure Networking product team walked through how two AKS-managed add-ons, Application Gateway for Containers (AGC) and Cilium L7 via Advanced Container Networking Services (ACNS), can lock down the entire path from the public internet to a single pod. No NGINX. No external WAF appliance. No third-party CNI to babysit. 📺 Watch the session: Why IT Pros Should Care Let me cut to the chase. If you operate AKS clusters today, this session matters because: You probably still have an ingress controller and an external WAF stitched together with annotations and prayers. AGC plus ACNS collapses that stack into first-party add-ons that AKS owns end to end. Both Application Gateway for Containers and Advanced Container Networking Services are generally available. This is not a preview demo, this is production. Security is finally readable. Every rule is a YAML object. Code review, audit, GitOps. No more “what does this NGINX config map even do anymore” archaeology. It actually works on a real attack pattern. The demo shows WAF killing a SQL-injection-style GET that Cilium would have happily forwarded, because the method (GET) was on the allow list. If you have ever had to explain to an auditor why a single compromised pod could pivot across your whole cluster, this is your exit ramp. The AKS Security Gap This Closes Most clusters are protected by a load balancer at the edge and basically nothing inside. The cluster door looks like a vault, but the hallways are wide open. Cilium calls this the lateral movement problem, and it is exactly how Kubernetes attacks unfold in the wild. Compromise a pod, then phone home, then pivot. What MAIS09 demonstrates is something different. AGC is the L7 front door (the metal detector at the lobby). ACNS Cilium L7 is the lock on every pod’s office door. Both speak HTTP. Both enforce identity. Both are managed by AKS itself. The legacy alternative, Application Gateway Ingress Controller (AGIC), bolted a full Application Gateway onto your cluster through a translator. Two services, two lifecycles, two finger-pointing teams when something broke. AGC is the successor, built from scratch for Kubernetes, speaking the Gateway API natively, enabled with a single AKS flag. AKS provisions the controller, wires the identity, delegates the subnet, and owns the upgrades. You own the policies. AGC + Managed Cilium, End to End Here is the mental model from the session. Picture four concentric layers of defense between the public internet and a pod. AGC front end. One Azure resource, one public DNS name, and (thanks to the Kubernetes Gateway API) multiple hostnames behind the same IP. The demo runs Contoso, Fabrikam, and Adventure Works on a single AGC public IP using three HTTPRoute objects. One infrastructure, three websites. Real cost savings, real ownership clarity (platform owns the Gateway, app teams own the HTTPRoutes). Azure WAF on AGC. This is the content inspector. It runs the OWASP Core Rule Set (DRS 2.1 in the demo) against every incoming request, looks for SQL injection, cross-site scripting, path traversal, and the rest of the OWASP Top 10, and returns a 403 before the packet ever touches your pod. Microsoft maintains the rule set, you bind it to AGC via a SecurityPolicy. ACNS Cilium L7 ingress on every pod. This is where identity-based policy lives. Rules key off pod labels, not IPs, because IPs change every time the cluster autoscaler does its job. The demo uses an allow-agc-l7-get-only CiliumNetworkPolicy that lets the AGC backend reach the tenant pods, but only with GET or GET /products. Anything else, POST, PUT, DELETE, gets a Cilium-synthesized 403 before NGINX ever sees the request. ACNS east-west and egress policy. Two more policies do the heavy lifting inside. client-may-call-contoso-get-only lets the client pod reach Contoso with GET, and only Contoso. A default-deny baseline blocks everything else (pod-to-pod and pod-to-internet) with a single carve-out for kube-dns on port 53. The magic is that the same Cilium engine handles north-south, east-west, and egress with one consistent identity model. eBPF in the Linux kernel does the enforcement on the same node as the pod, so the decision happens before the packet leaves the host. No sidecars, no iptables sprawl, no daemonset you need to upgrade by hand. Real-world Scenarios The demo walks through six tests and the results map directly onto things you are probably trying to solve right now: Multi-site hosting on one IP. Three hostnames, one AGC, three 200 OKs from three different backend pods. If you are paying for three load balancers today, you can stop. WAF blocks a malicious GET that ACNS would have let through. This is the punch line of why you need both layers. The method (GET) is on the Cilium allow list, but the payload is a SQLi pattern. WAF returns 403 at the edge. Defense in depth, working as advertised. Method enforcement at the pod door. GET returns 200, POST/PUT/DELETE return 403, GET /admin returns 403, GET /products returns 200. Cilium is doing actual HTTP inspection, not just dropping packets. East-west enforcement with readable verdicts. Client to Contoso GET is 200. Same client, same destination, POST is 403 (L7 deny, TCP completed). Client to Fabrikam is 000 (L4 drop, no TCP handshake). Reading the difference between 403 and 000 is now a debuggable signal, not a mystery. Default-deny egress kills phone-home. A pod tries to reach bing.com. DNS resolves (the carve-out works), TCP SYN goes nowhere, wget gives up with exit code 1. If that pod was compromised and trying to exfiltrate data, this is where the attack chain dies. Selective allow still works. Same pod, same tools, but a DNS lookup against kube-dns inside the cluster returns instantly. We did not unplug the network. We locked it down with a purpose. Honest tradeoffs to call out. The session does not pretend everything is free. AGC introduces a billed subnet association and a managed identity you do not manage in BYO mode. Cilium L7 needs the Cilium data plane (ACNS Container Network Security features are Cilium-only). The Envoy proxy that handles L7 inspection has a cost only when you actually enforce L7, which is a fair deal in my book. Getting Started If you want to try this on a cluster of your own, three flags do most of the work on az aks create: --network-dataplane cilium (turns on the eBPF data plane) --enable-acns (enables Advanced Container Networking Services, including Hubble observability and Cilium L7 policy) --enable-app-routing or the ALB add-on flag (provisions the AGC controller as an AKS-managed add-on) From there you write four YAML objects: a default-deny CiliumNetworkPolicy, an allow-DNS carve-out, an AGC ingress allow with method and path constraints, and your east-west allow rules. The session repo includes the full set so you can clone and follow along. One bonus worth knowing about. ACNS ships Hubble out of the box, with pre-built Azure Managed Grafana dashboards. Flow logs, service maps, policy hit counts. Even on pods that are not yet under L7 enforcement, you get observability for free. When something breaks at 2 a.m., you have an audit trail instead of a tcpdump. Resources Azure Application Gateway for Containers documentation Set up Layer 7 policies with Advanced Container Networking Services AKS security concepts Cluster security best practices for AKS Container Network Observability for AKS (Hubble, Prometheus, Grafana) Advanced Container Networking Services hands-on lab Use cases of Advanced Network Observability for AKS (Azure Networking Blog) Watch the Rest of the Summit If MAIS09 hit the spot, there are dozens more sessions in the same playlist covering AKS networking at scale, Azure Local, AVM, the new Deployment Agent, and a lot more. Grab a coffee and binge. Microsoft Azure Infrastructure Summit 2026 playlist Cheers! Pierre Roman580Views1like1Comment