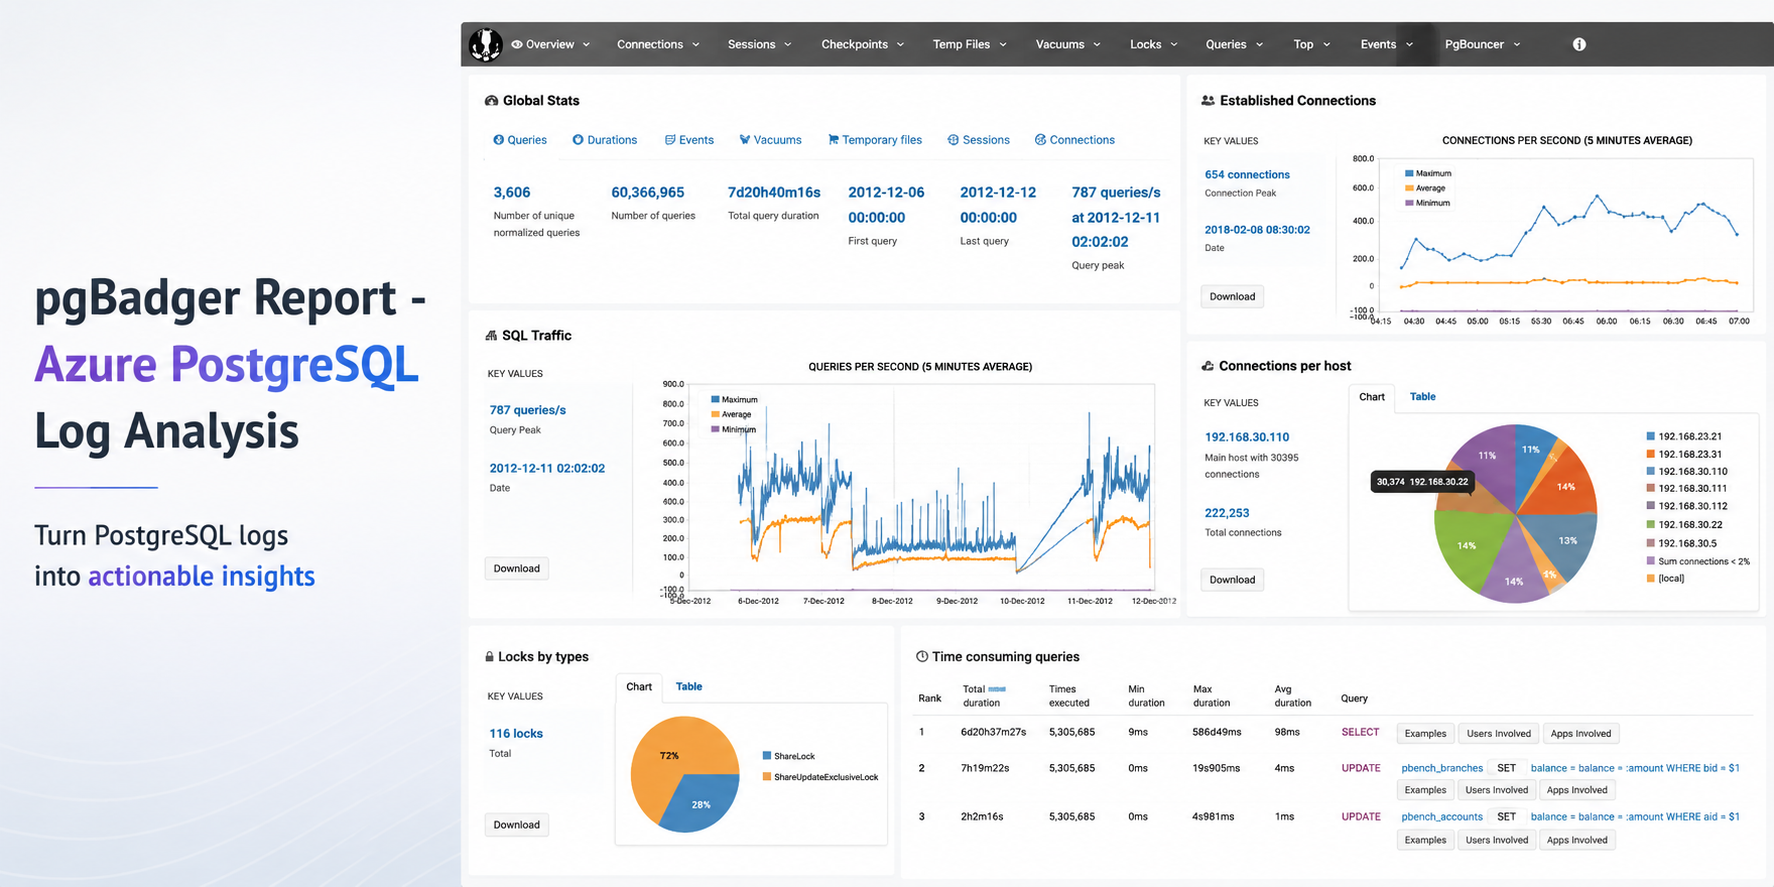
This guide shows how to use pgBadger with Azure Database for PostgreSQL Flexible Server Server logs.
Sometimes the fastest way to understand a PostgreSQL workload is not another dashboard. It is a good log report.
pgBadger is a PostgreSQL log analysis tool that turns raw PostgreSQL logs into an interactive HTML report. It helps summarize query activity, connection patterns, errors, temporary files, lock waits, autovacuum activity, and more.
Earlier guidance for generating pgBadger reports from Azure Database for PostgreSQL Flexible Server focused on exporting logs through Diagnostic Settings, storing them in a storage account, and then using tools such as BlobFuse and jq to extract PostgreSQL log lines from JSON files.
That workflow is still useful when customers centralize logs across multiple servers. However, if you are already using the Server logs feature in Azure Database for PostgreSQL Flexible Server, there is a much simpler path.
In this post: You’ll learn how to generate a pgBadger HTML report from Azure Database for PostgreSQL Flexible Server by downloading native PostgreSQL .log files directly from the Azure portal. No storage account, BlobFuse mount, or JSON extraction required.
Fast path
- Configure
log_line_prefix. - Enable Server logs for download.
- Download the PostgreSQL
.logfiles. - Run pgBadger with the matching prefix.
- Open
pgbadger-report.html.
Why use this workflow?
With Server logs, you can download native PostgreSQL .log files directly from the Azure portal and run pgBadger locally.
| Older path | Simpler path in this blog |
|---|---|
| Diagnostic Settings → Storage account → BlobFuse → JSON extraction → pgBadger | Server logs → Download .log files → pgBadger |
| Area | Older Diagnostic Settings workflow | Server logs workflow |
|---|---|---|
| Export path | Diagnostic Settings to storage account | Download .log files directly from the portal |
| Format | JSON payloads need extraction | Native PostgreSQL .log files |
| Extra tooling | BlobFuse and jq JSON parsing | None |
| Best suited for | Centralized or multi-server logging | Quick per-server analysis |
| Outcome | Flexible, but more setup | Faster path to pgBadger |
Recommended: Use the Server logs workflow when you want a fast, low-friction way to generate a pgBadger report from one Azure Database for PostgreSQL Flexible Server.
When should you use this workflow?
| Use this workflow when... | Use Diagnostic Settings when... |
|---|---|
| You need a quick report for one Flexible Server. | You centralize logs from many servers. |
| You want to run pgBadger locally. | You need long-term retention or workspace-level querying. |
| You want to avoid JSON extraction. | You already have automated log export pipelines. |
Before you start
-
A machine where you can install or run pgBadger.
-
A working Perl runtime.
-
Git Bash on Windows, so the multi-line shell commands work as shown.
-
Portal access to your Azure Database for PostgreSQL Flexible Server.
-
Permission to update server parameters and enable Server logs.
Important: pgBadger can only analyze what PostgreSQL logs capture. To populate query timing and slow-query sections in the report, enable log_min_duration_statement before collecting logs. Logs collected before that change will not include duration data.
Workflow overview
| Task | Type | Rough effort |
|---|---|---|
| Install or prepare pgBadger | One-time setup per analysis machine | 5–10 minutes |
Configure log_line_prefix | One-time setup per server | 2–3 minutes |
| Enable Server logs | One-time setup per server | 2–3 minutes |
| Download logs and run pgBadger | Repeatable | 2–5 minutes |
- Install or prepare pgBadger on the machine where you will analyze logs.
- Configure
log_line_prefixso pgBadger can parse each log line. - Enable Server logs, so PostgreSQL logs are available for download.
- Download the logs and run pgBadger locally.
💡Pro tip: Start with a narrow log window first. Use one or two hourly log files, confirm the report looks right, and then expand the analysis window if needed.
Step 1: Install pgBadger
Before generating a report, you need pgBadger available on the machine where you plan to analyze the downloaded PostgreSQL log files. Run this on a Linux VM, WSL, or another Linux-based environment where you can install packages.
Note: Azure Cloud Shell may work for quick testing, but package installation and build-tool availability can vary by session. For repeatable analysis, use a Linux VM, WSL, or another environment you control.
Copy and run
sudo apt-get update && sudo apt-get install -y git perl make gcc && \
git clone https://github.com/darold/pgbadger.git && \
cd pgbadger && \
perl Makefile.PL && \
make && \
sudo make install && \
pgbadger -V
What good looks like: The install command completes successfully and pgbadger -V returns the installed pgBadger version.
Step 2: Configure log_line_prefix
This is a one-time server configuration step.
The log_line_prefix parameter controls the beginning of each PostgreSQL log line. pgBadger uses this prefix to extract useful fields such as timestamp, user, database, and process ID.
In the Azure portal, open your Flexible Server and go to Server parameters. Search for:
Parameter
log_line_prefixSet this value
%m user=%u db=%d pid=%p:Then select Save.
In Server parameters, confirm that the custom value is saved for log_line_prefix.
Figure 1: Set log_line_prefix so pgBadger can correctly parse timestamp, user, database, and process ID from each log line.
Prefix tokens
| Token | Meaning |
|---|---|
%m | Timestamp with milliseconds |
%u | Username |
%d | Database name |
%p | Process ID |
After this change, log lines should look like this:
Example log line
2026-06-22 19:00:00.070 UTC user=pgadmin db=highcpu pid=3805603: LOG: statement: SELECT 1 FROM pg_extension WHERE extname='pg_stat_statements'The matching pgBadger prefix for this log format is:
Matching pgBadger prefix
%m user=%u db=%d pid=%p:You will use this same value later in the pgBadger command.
What good looks like: The server parameter is saved, and new PostgreSQL log lines begin with timestamp, user, database, and process ID fields that match the pgBadger prefix.
Step 3: Enable Server logs for download
This is also a one-time setup step.
In the Azure portal, open your Flexible Server and go to Server logs. Enable:
Portal setting
Capture logs for downloadSet the retention period based on how long you want logs to remain available for download. For example, a 7-day retention period keeps logs available for download for 7 days.
In Server logs, enable Capture logs for download and choose the retention window.
Figure 2: Enable Capture logs for download and set a retention period long enough to cover the analysis window you want to inspect.
What good looks like: After Server logs are enabled, hourly PostgreSQL log files appear in the Server logs blade and can be downloaded from the Azure portal.
Once enabled, hourly log files appear in the Server logs blade. The files are named by date and hour, for example:
Example log files
postgresql_2026_06_22_19_00_00.log
postgresql_2026_06_22_20_00_00.log
Step 4: Download and organize the logs locally
From the Server logs page, select the .log files for the time window you want to analyze and download them.
For example, to analyze activity between 19:00 and 21:00 UTC, download:
Example files to download
postgresql_2026_06_22_19_00_00.log
postgresql_2026_06_22_20_00_00.log
On your local machine, create a folder for that analysis window. A simple convention is to use the Mon-DD format.
Folder name
Jun-22Place the downloaded .log files inside that folder. Your local folder structure should look like this:
Folder structure
pgbadger-13.1/
  pgbadger
  Jun-22/
    postgresql_2026_06_22_19_00_00.log
    postgresql_2026_06_22_20_00_00.log
Step 5: Generate the pgBadger report
Open Git Bash from the folder where pgBadger is located. For example, if pgBadger is inside the pgbadger-13.1 folder, open Git Bash from that folder.
| # | Action | Command |
|---|---|---|
| 1 | Set the folder | FOLDER=Jun-22 |
| 2 | Confirm files | ls -lh ./$FOLDER |
| 3 | Run pgBadger | Use the full command below. |
Copy and run
FOLDER=Jun-22

ls -lh ./$FOLDER

perl -X ./pgbadger -f stderr \
  --prefix '%m user=%u db=%d pid=%p:' \
  ./$FOLDER/*.log \
  -o ./$FOLDER/pgbadger-report.html
Command breakdown
| Part of command | Purpose |
|---|---|
perl -X ./pgbadger | Runs pgBadger and suppresses non-critical Perl warnings. |
-f stderr | Parses PostgreSQL stderr log files. |
--prefix '%m user=%u db=%d pid=%p:' | Matches the log_line_prefix set on the server. |
./$FOLDER/*.log | Analyzes every .log file in the selected folder. |
-o ./$FOLDER/pgbadger-report.html | Writes the HTML report into the same folder. |
When the command completes successfully, you should see output like this:
Expected output
Parsed 12134249 bytes of 12134249 (100.00%), queries: 26684, events: 83
LOG: Ok, generating html report...
What good looks like: pgBadger finishes parsing the logs and creates pgbadger-report.html in the selected folder.
Step 6: Open the report
Open the generated report:
Copy and run
start ./$FOLDER/pgbadger-report.htmlThe report opens in your default browser. The final report is created here:
Generated report path
Jun-22/pgbadger-report.htmlWhat the report can show
The pgBadger report gives you a quick view into the workload shape for the selected log window. For example, in a sample run across two hourly log files, pgBadger summarized:
- Total number of queries.
- Number of unique normalized queries.
- Query traffic over time.
- Events such as errors and fatal messages.
- Session and connection patterns.
Once the report opens, start with Global Stats to confirm the time range, total queries, normalized queries, and query peak.
Figure 3: Start with Global Stats to validate the selected time range, total query count, normalized query count, and query peak.
Query volume and normalized queries
Many raw queries can often reduce to a smaller number of normalized query patterns. This helps identify whether the workload is spread across many different query shapes or dominated by a smaller set of repeated statements.
Example: In this sample run, 26,684 queries reduced to 59 normalized query shapes. That suggests the workload is mostly a small set of repeated statements, which can help focus tuning effort.
Traffic patterns
The SQL Traffic section helps identify spikes, quiet periods, and workload changes over time.
Figure 4: Use SQL Traffic to identify query spikes, quiet periods, and workload changes during the selected log window.
Figure 5: Review the query breakdown to compare read vs. write volume and query-type distribution for the selected Server logs window.
For example, if the report shows a steady baseline followed by a sharp spike, that spike can be correlated with application activity, batch jobs, synthetic tests, or operational events during the same time window.
Query duration
If query duration shows 0 ms or the slow query sections are empty, it usually means duration logging was not enabled when the logs were collected.
In that case, pgBadger can still show query counts and events, but it cannot calculate the slowest queries, total execution time, average duration, or maximum duration.
To unlock those timing sections, enable log_min_duration_statement, collect fresh logs, and rerun pgBadger.
What pgBadger cannot infer from missing logs
pgBadger reports are only as complete as the log data you provide. If PostgreSQL did not log duration, lock waits, temporary files, or autovacuum activity during the selected time window, pgBadger cannot reconstruct those details later.
| To analyze... | Enable before collecting logs |
|---|---|
| Slow queries | log_min_duration_statement |
| Lock waits | log_lock_waits |
| Temporary files | log_temp_files |
| Autovacuum activity | log_autovacuum_min_duration |
Repeatable copy/paste block
Reusable command block
Change only FOLDER for each new analysis window.
Copy and run
FOLDER=Jun-22

ls -lh ./$FOLDER

perl -X ./pgbadger -f stderr \
  --prefix '%m user=%u db=%d pid=%p:' \
  ./$FOLDER/*.log \
  -o ./$FOLDER/pgbadger-report.html

start ./$FOLDER/pgbadger-report.html
For another date, change only this line:
Update this value
FOLDER=Jun-22Examples:
Example folder values
FOLDER=Jun-23
FOLDER=Jul-01
FOLDER=Aug-15
Optional: Improve report quality
pgBadger can only analyze the information captured in PostgreSQL logs.
The default logs may be enough for query frequency, connection activity, and errors. For deeper performance troubleshooting, consider enabling additional logging parameters based on your scenario.
| Scenario | Parameter | Suggested value | Notes |
|---|---|---|---|
| Slow query analysis | log_min_duration_statement | 1000 | Logs statements slower than 1 second. |
| Short controlled test | log_min_duration_statement | 0 | Logs every statement. Use carefully. |
| Lock troubleshooting | log_lock_waits | on | Helps identify lock waits. |
| Temporary file analysis | log_temp_files | 0 | Logs all temporary files. |
| Autovacuum visibility | log_autovacuum_min_duration | 0 | Useful during focused analysis. |
Useful parameters include:
Recommended logging parameters
log_lock_waits = on
log_temp_files = 0
log_autovacuum_min_duration = 0
To capture query durations, configure:
Duration logging
log_min_duration_statement = 1000This logs statements that run longer than 1000 milliseconds.
For short test runs, you can temporarily use:
Short test run only
log_min_duration_statement = 0Caution: Use log_min_duration_statement = 0 carefully on busy production servers. It logs every statement and can generate a large volume of logs.
Duration matters: If duration logging is not enabled, pgBadger can still show query counts and events, but slowest-query, total duration, average duration, and maximum duration sections will be limited or empty.
Common mistakes and quick fixes
| Symptom | Likely cause | Fix |
|---|---|---|
| Report is empty | Prefix mismatch | Match --prefix with log_line_prefix. |
| No duration data | Duration logging was not enabled | Set log_min_duration_statement before collecting logs. |
| No files visible | Server logs disabled or retention expired | Enable capture and check retention. |
| pgBadger command fails | pgBadger is not in the current folder or path | Run pgbadger -V to confirm installation. |
Common troubleshooting FAQs
1. Report is created but empty
This usually means the pgBadger prefix did not match the actual log format.
Check the first few lines:
Copy and run
head -5 ./$FOLDER/*.logMake sure the pgBadger --prefix matches the server’s log_line_prefix.
2. Report shows queries but no duration
PostgreSQL logged statements but did not log durations.
Enable one of the following, collect fresh logs, and rerun pgBadger:
Parameter options
log_min_duration_statement = 1000

# or temporarily for testing
log_min_duration_statement = 0
3. No .log files are visible
Confirm that Server logs are enabled:
Portal setting
Capture logs for downloadAlso check the retention period. If the retention period has expired, older logs may no longer be available for download.
4. pgBadger command fails
Confirm that pgBadger is available in the current folder or installed in your path.
Copy and run
pgbadger -VIf you are running pgBadger from the local folder, use:
Copy and run
perl -X ./pgbadgerSummary
For customers already using Azure Database for PostgreSQL Flexible Server logs, the pgBadger workflow is straightforward:
-
Install pgBadger.
-
Configure
log_line_prefix. -
Enable Server logs for download.
-
Download the
.logfiles. -
Place them in a local date-based folder.
-
Run pgBadger with the matching prefix.
-
Open
pgbadger-report.html.
Bottom line: Server logs give you the shortest path from Azure Database for PostgreSQL Flexible Server logs to a pgBadger report. Download the native .log files, run pgBadger with the matching prefix, and open the generated HTML report.
References

 Microsoft