Forum Discussion
DavidBridges
Nov 02, 2020Copper Contributor
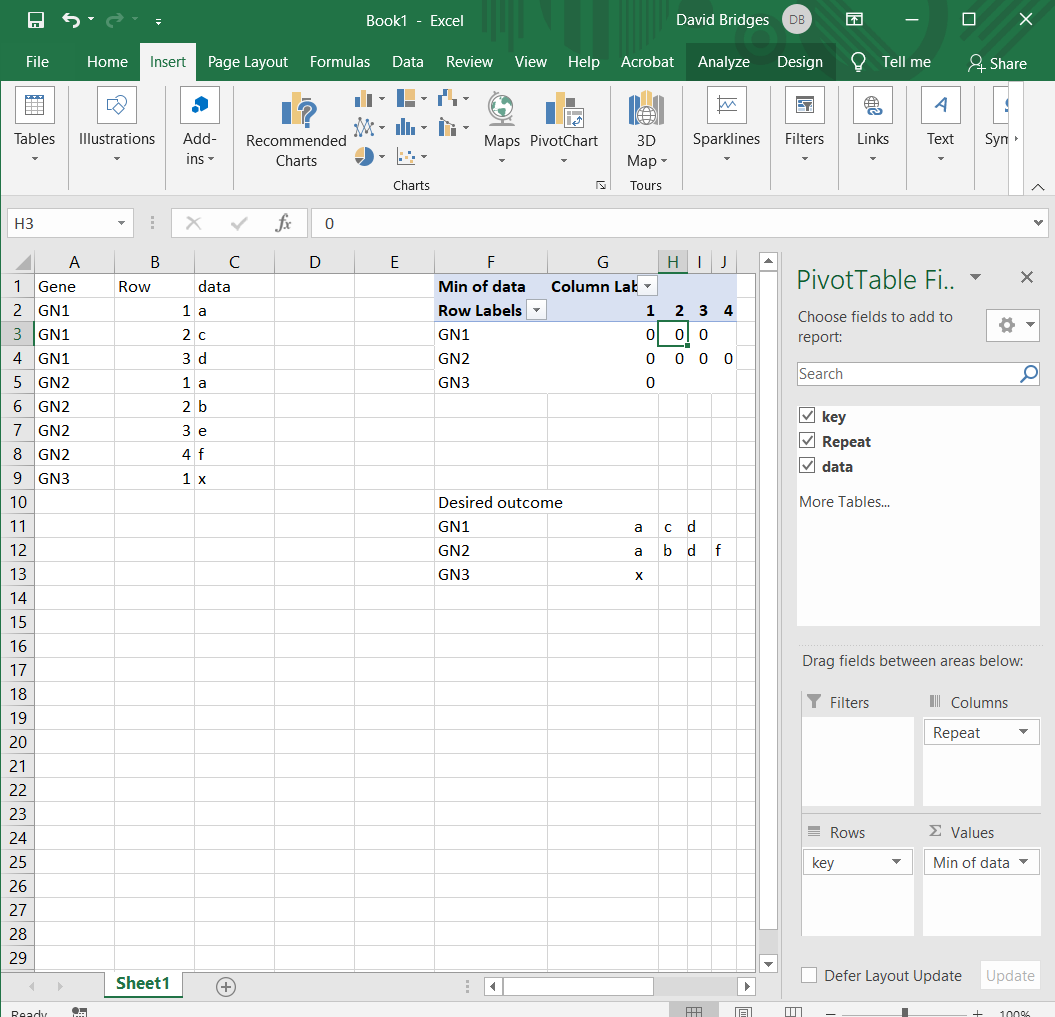
Summarizing of text data in pivot tables.
My task involves manipulation of gene sequencing data. The description of the task is simplified to focus on key issues. I have text data relating to a single gene that is spread over multiple rows...
- Nov 03, 2020
To do that with PivotTable you need to add data to data model creating it and add measure like
Measure:=CONCATENATEX(Table1,Table1[Data])and use it as
Riny_van_Eekelen
Nov 03, 2020Platinum Contributor
DavidBridges This becomes easy with Get & Transfor Data (a.k.a. Power Query). See attached workbook based on you example. This will work particularly well on large data sets.