SOLVED

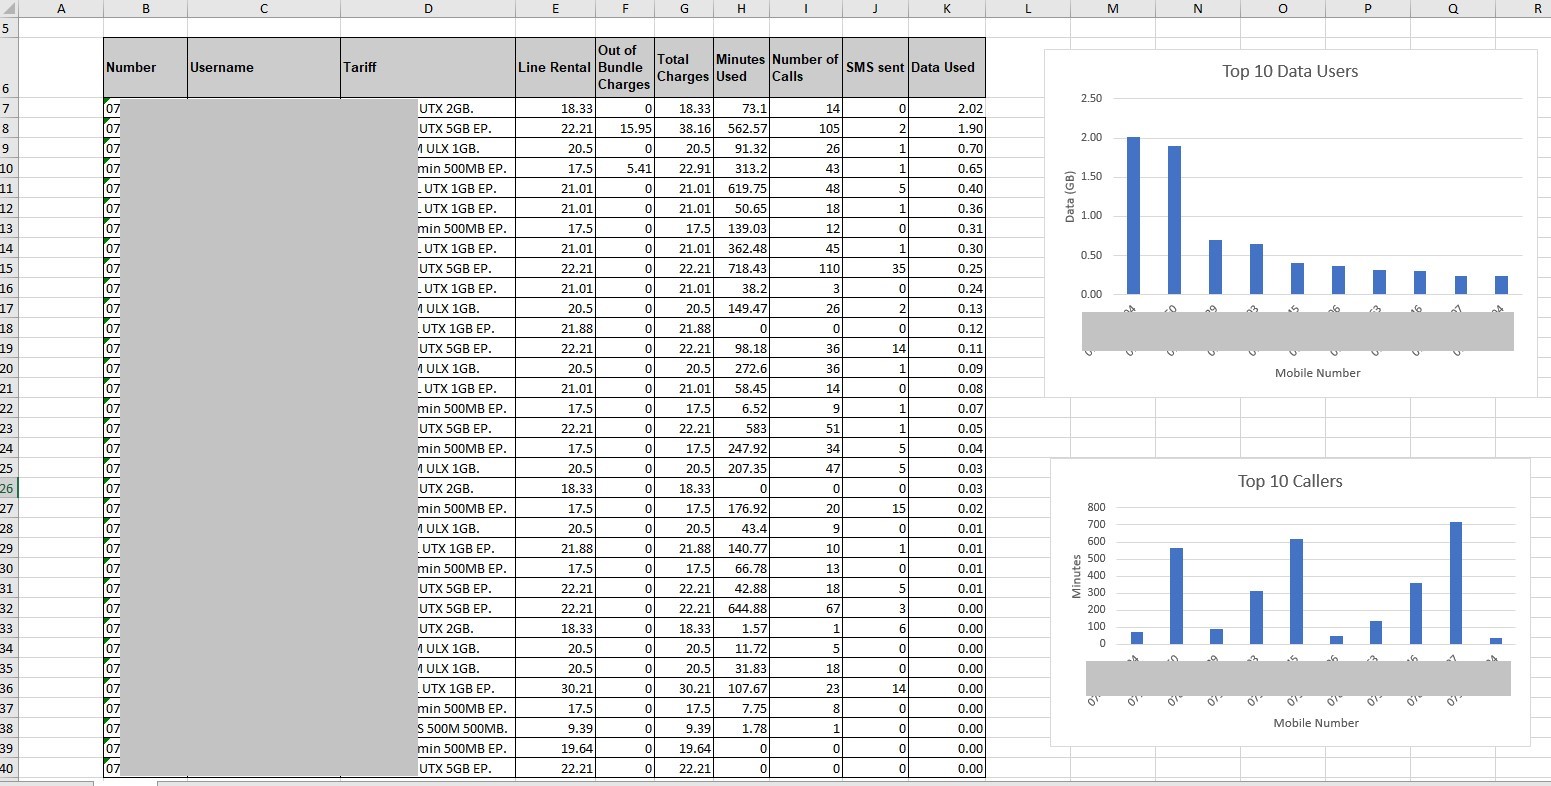
How to sort multiple graphs in order highest to lowest from the same data set?

Copper Contributor

Hi guys,


It's probably really simple but I can't seem to find a way to do it and can't seem to find the right answer on Google. 


Basically I have a table with mobile usage i.e. minutes used, sms sent, data used etc. I currently have two tables one is 'Top 10 data users' and the other 'Top 10 callers' basically one showing users with highest data usage and the other with highest minutes usage. 


If I sort the data usage column highest to lowest my graph looks fine but then I also want my second graph to be ordered highest to lowest but I can't because I'm already sorting the data column. 


Is there a way to do this without having to duplicate the table?


I have attached a screenshot so it's easier to understand. 


Many thanks,


Kamil

4 Replies
best response confirmed by KamCMM (Copper Contributor)
Solution
Its better you use Pivot Charts, which works easier with data.

You can share the sample file, and we could help you with the example

Its better you use Pivot Charts, which works easier with data. You can share the sample file, and we could help you with the example

@KamCMM 

You need helper table. Idea is here https://www.xelplus.com/excel-da-dynamic-sorted-chart/, that's with dynamic arrays Excel, but on older one could be done as well by other technique.

1 best response

Accepted Solutions
best response confirmed by KamCMM (Copper Contributor)
Solution
Its better you use Pivot Charts, which works easier with data.

You can share the sample file, and we could help you with the example

View solution in original post