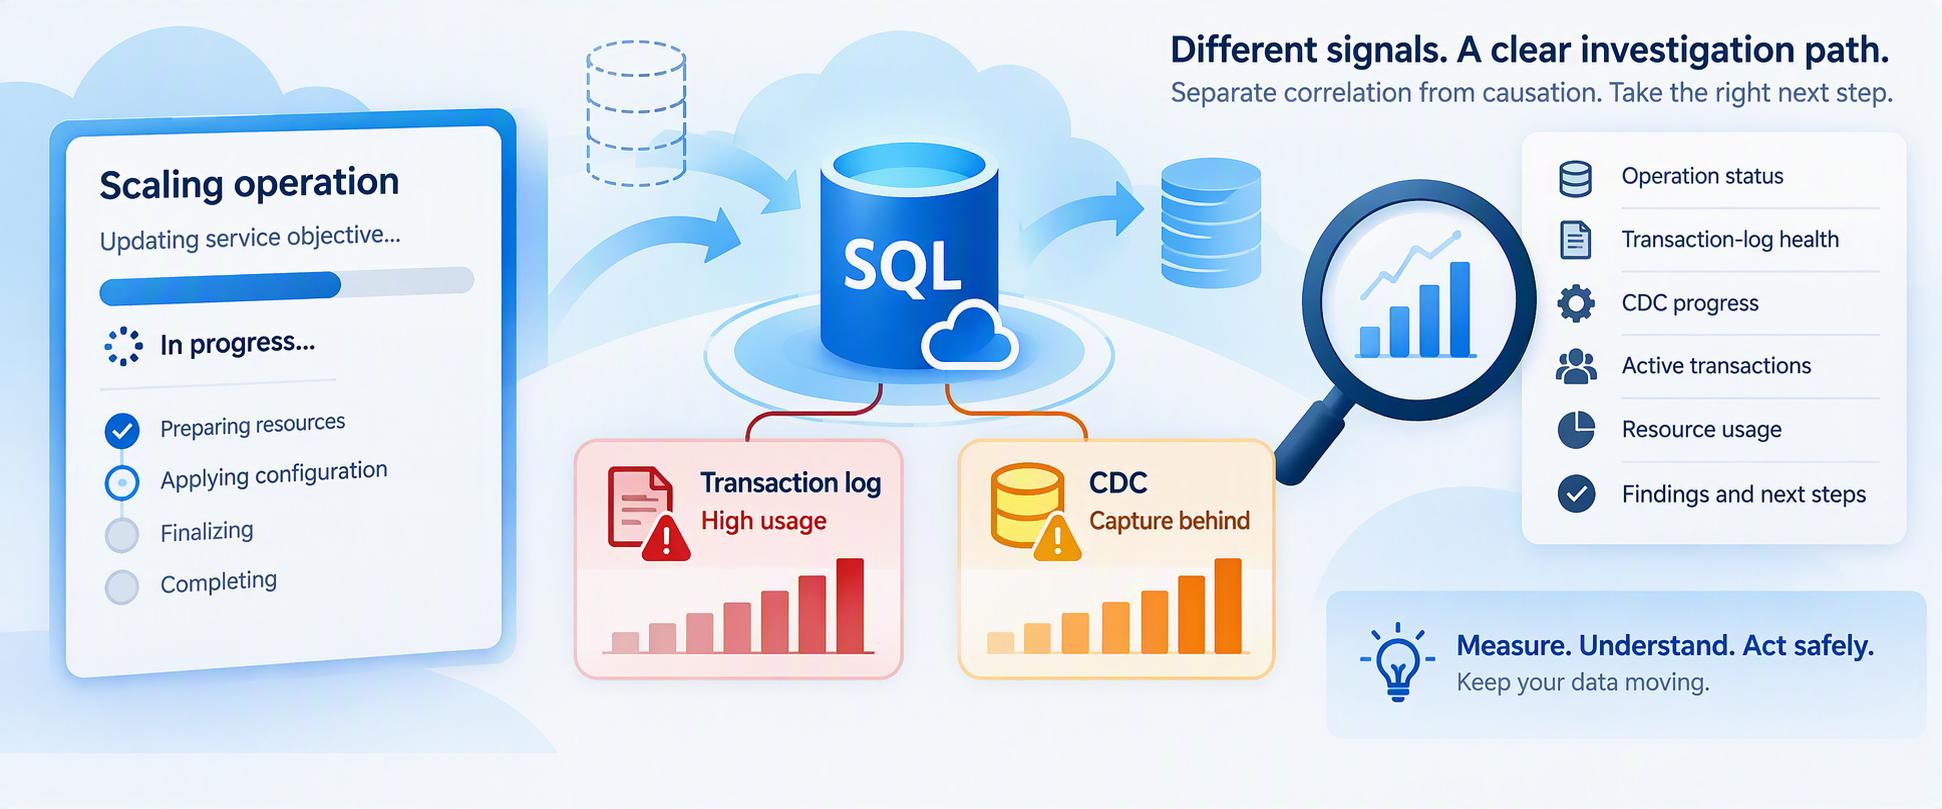
A scale operation and a growing transaction log can happen at the same time without one necessarily causing the other.
Azure SQL Database makes scaling compute straightforward. But troubleshooting becomes more complicated when several things happen simultaneously:
- A scale operation remains IN_PROGRESS.
- A cancellation remains CANCEL_IN_PROGRESS.
- Transaction-log usage is growing.
- Change Data Capture (CDC) is enabled.
- Log truncation reports REPLICATION.
- Long-running transactions are present.
The temptation is to connect all these observations immediately:
"CDC is preventing Azure SQL from scaling."
That's a hypothesis, not yet a diagnosis.
CDC reads changes from the transaction log, and CDC capture latency can delay log truncation under certain conditions. Microsoft specifically documents scenarios where CDC combined with long-running transactions can contribute to continued transaction-log growth.
However, that doesn't establish a universal rule that:
- CDC causes scale operations to become stuck.
- REPLICATION as a log reuse wait means scaling is blocked.
- Disabling CDC will resolve a scale operation.
- A CDC problem and a long-running scale operation necessarily share the same root cause.
The safest investigation separates the evidence into layers.
1. Start With the Scale Operation
A scale operation changes the resources available to Azure SQL Database.
Depending on the type of scaling operation, Azure SQL might need to:
- Create a compute instance with the requested configuration.
- Move or copy data when necessary.
- Redirect connections to the new environment.
- Terminate existing connections during the final switch.
Microsoft documents that Azure SQL Database normally remains online during much of this process, although the final connection switch can cause a short interruption. Long-running transactions can increase the time required for recovery when connections are terminated.
So, begin with the operation itself.
2. Check the Operation State
Azure SQL Database exposes database-operation status using:
sys.dm_operation_statusThis DMV reports operations such as ALTER and their state.
Run the query from the logical server's master database:
SELECT
    session_activity_id,
    major_resource_id AS database_name,
    operation,
    state_desc,
    percent_complete,
    start_time,
    last_modify_time,
    error_code,
    error_desc
FROM sys.dm_operation_status
ORDER BY start_time DESC;
Possible states include:
- PENDING
- IN_PROGRESS
- COMPLETED
- FAILED
- CANCEL_IN_PROGRESS
- CANCELLED
An important detail is that percent_complete shouldn't automatically be interpreted like a traditional progress bar.
For many active operations:
50 = operation in progress
and:
100 = operation complete
Restore operations have more granular progress values.
So:
An ALTER operation remaining at 50% doesn't necessarily mean exactly half of the work is complete.
3. Build an Operation Timeline
Capture:
- Scale request time.
- Requested service objective.
- Operation start time.
- Current state.
- last_modify_time.
- Cancellation request time, when applicable.
- Subsequent scale requests.
- Application impact.
- Database availability.
- Workload running during the operation.
For example:
| Time | Observation |
|---|---|
| T0 | Scale requested |
| T1 | Operation enters IN_PROGRESS |
| T2 | Transaction-log utilization rises |
| T3 | log_reuse_wait_desc reports REPLICATION |
| T4 | Cancellation requested |
| T5 | Operation still CANCEL_IN_PROGRESS |
This timeline establishes correlation.
It doesn't yet establish causation.
4. Don't Keep Submitting Scale Requests
When a scale or cancellation appears slow, avoid repeatedly submitting new modifications without understanding the state of the existing operation.
Instead:
- Preserve the current operation ID.
- Record the operation state.
- Record timestamps.
- Capture current database workload.
- Investigate the transaction log.
- Investigate CDC independently.
- Escalate if the operation remains persistently unable to reach a terminal state.
The goal is to reduce variables rather than introduce new ones.
5. Measure Transaction-Log Utilization
Now move to the database being investigated.
sys.dm_db_log_space_usage is supported in Azure SQL Database and reports how much transaction-log space is currently occupied.
SELECT
    total_log_size_in_bytes / 1024.0 / 1024.0
        AS total_log_size_mb,

    used_log_space_in_bytes / 1024.0 / 1024.0
        AS used_log_space_mb,

    used_log_space_in_percent
FROM sys.dm_db_log_space_usage;
Capture this repeatedly.
You're looking for a trend such as:
T1 25%
T2 41%
T3 58%
T4 73%
T5 88%
versus:
T1 60%
T2 63%
T3 56%
T4 61%
T5 58%
The first pattern suggests sustained net log growth.
The second shows that log space is being reused.
One snapshot can't tell you which behavior is occurring.
6. Ask Why the Log Can't Be Reused
One of the most useful checks is:
SELECT
    name,
    log_reuse_wait_desc
FROM sys.databases
WHERE database_id = DB_ID();
The value describes the current condition preventing transaction-log reuse.
Microsoft also exposes the same concept through sys.dm_db_log_stats() as log_truncation_holdup_reason.
A more complete diagnostic query is:
SELECT
    database_id,
    total_log_size_mb,
    active_log_size_mb,
    total_vlf_count,
    active_vlf_count,
    log_truncation_holdup_reason,
    log_since_last_checkpoint_mb
FROM sys.dm_db_log_stats(DB_ID());
sys.dm_db_log_stats() is documented as applicable to Azure SQL Database and returns summary-level information for diagnosing transaction-log health.
7. What Does REPLICATION Mean When CDC Is Enabled?
This point requires careful interpretation.
CDC uses the transaction log as the source for captured changes. Inserts, updates, and deletes are recorded in the transaction log before CDC processes those changes.
Microsoft documents an important interaction:
- CDC is enabled.
- Transactions produce log records.
- CDC must capture relevant log information.
- Capture latency can hold back log truncation.
- log_reuse_wait_desc can consequently report REPLICATION.
Therefore, if you see:
REPLICATION
in a CDC-enabled Azure SQL Database, CDC-related log processing is a legitimate investigation path.
But don't jump from:
"log_reuse_wait_desc = REPLICATION"
to:
"CDC caused the scaling operation to become stuck."
That's a different claim requiring separate evidence.
8. Confirm Whether CDC Is Enabled
Azure SQL Database exposes CDC status through sys.databases.
SELECT
    name,
    is_cdc_enabled
FROM sys.databases
WHERE database_id = DB_ID();
If:
is_cdc_enabled = 1
CDC is enabled for the database.
Microsoft documents CDC support in Azure SQL Database and notes that the database must first be CDC-enabled before individual source tables can be tracked.
9. Inventory CDC Capture Instances
Rather than using SQL Server Agent job queries, inspect Azure SQL Database CDC metadata.
SELECT
    ct.capture_instance,
    OBJECT_SCHEMA_NAME(ct.source_object_id)
        AS source_schema,
    OBJECT_NAME(ct.source_object_id)
        AS source_table,
    ct.start_lsn,
    ct.create_date
FROM cdc.change_tables AS ct
ORDER BY
    source_schema,
    source_table;
This helps answer:
- Which tables are tracked?
- How many capture instances exist?
- When were they created?
- Has the CDC scope changed recently?
An important Azure SQL-specific detail is:
Azure SQL Database doesn't depend on SQL Server Agent CDC capture and cleanup jobs.
Instead, Azure SQL Database uses a built-in CDC scheduler that automatically runs capture and cleanup within the database.
That distinction is critical when adapting SQL Server CDC troubleshooting procedures to Azure SQL Database.
10. Check Whether CDC Is Advancing
A simple high-level check is:
SELECT
    sys.fn_cdc_get_min_lsn(
        ct.capture_instance
    ) AS minimum_lsn,

    sys.fn_cdc_get_max_lsn()
        AS maximum_lsn,

    ct.capture_instance,

    OBJECT_SCHEMA_NAME(ct.source_object_id)
        AS source_schema,

    OBJECT_NAME(ct.source_object_id)
        AS source_table
FROM cdc.change_tables AS ct;
Take repeated samples.
The objective isn't to derive a universal threshold.
The objective is to determine whether the observable CDC boundary is:
- Advancing.
- Intermittently advancing.
- Apparently static over a meaningful period.
Again:
Trend matters more than a single snapshot.
11. Investigate Long-Running Transactions
This is particularly important when CDC and log growth appear together.
Microsoft specifically documents transaction-log growth scenarios involving CDC and long-running transactions.
Start by examining database transactions:
SELECT
    dt.transaction_id,
    dt.database_transaction_begin_time,
    dt.database_transaction_type,
    dt.database_transaction_state,
    dt.database_transaction_log_record_count,

    CAST
    (
        dt.database_transaction_log_bytes_used
        / 1024.0 / 1024.0
        AS decimal(18,2)
    ) AS log_mb_used,

    CAST
    (
        dt.database_transaction_log_bytes_reserved
        / 1024.0 / 1024.0
        AS decimal(18,2)
    ) AS log_mb_reserved

FROM sys.dm_tran_database_transactions AS dt

WHERE dt.database_id = DB_ID()

ORDER BY
    dt.database_transaction_log_bytes_used DESC;
sys.dm_tran_database_transactions is supported in Azure SQL Database and provides transaction-level database information, including transaction start time and log bytes consumed.
12. Connect Transactions Back to Sessions
A transaction ID is useful, but identifying the application session makes it actionable.
SELECT
    st.session_id,
    at.transaction_id,
    at.transaction_begin_time,
    at.transaction_type,
    at.transaction_state,
    dt.database_transaction_begin_time,

    CAST
    (
        dt.database_transaction_log_bytes_used
        / 1024.0 / 1024.0
        AS decimal(18,2)
    ) AS log_mb_used,

    s.login_name,
    s.host_name,
    s.program_name,
    r.status,
    r.command,
    r.wait_type,
    r.blocking_session_id

FROM sys.dm_tran_session_transactions AS st

JOIN sys.dm_tran_active_transactions AS at
    ON st.transaction_id = at.transaction_id

JOIN sys.dm_tran_database_transactions AS dt
    ON st.transaction_id = dt.transaction_id

LEFT JOIN sys.dm_exec_sessions AS s
    ON st.session_id = s.session_id

LEFT JOIN sys.dm_exec_requests AS r
    ON st.session_id = r.session_id

WHERE dt.database_id = DB_ID()

ORDER BY
    at.transaction_begin_time;
sys.dm_tran_active_transactions and sys.dm_tran_database_transactions are documented for Azure SQL Database.
Look for:
- Very old transactions.
- Transactions consuming large amounts of log.
- Sleeping sessions with open transactions.
- Blocking.
- Large write activity.
Don't terminate transactions merely because they're old.
First determine:
- Which application owns them.
- Whether rollback would cause more impact.
- Whether they're expected.
- Whether they're actually contributing to the observed log condition.
13. Correlate With Log-Write Pressure
Azure SQL Database also exposes recent transaction-log write utilization through:
sys.dm_db_resource_statsIt provides roughly one hour of resource history with approximately 15-second samples.
SELECT TOP (240)
    end_time,
    avg_cpu_percent,
    avg_data_io_percent,
    avg_log_write_percent,
    avg_memory_usage_percent
FROM sys.dm_db_resource_stats
ORDER BY end_time DESC;
Now correlate:
- Scale-operation start time.
- Log-space growth.
- log_reuse_wait_desc.
- CDC progression.
- Long-running transactions.
- avg_log_write_percent.
This can reveal two very different scenarios.
Scenario A
- Log is large.
- Log-write rate is currently modest.
- CDC continues advancing.
- No unusually long transaction is present.
This weakens the hypothesis that current transaction-log pressure is the primary explanation for the ongoing scale behavior.
Scenario B
- Log usage continually rises.
- REPLICATION remains the reuse wait.
- CDC progression appears delayed.
- Large transactions remain active.
- Log-write pressure is high.
This strengthens the case for investigating the log/CDC workload further.
It still doesn't prove CDC is blocking scaling.
14. Test Correlation Without Inventing Causation
Build a timeline like this:
| Time | Scale state | Log used | Reuse wait | CDC progress | Long transaction |
|---|---|---|---|---|---|
| T1 | IN_PROGRESS | 45% | NOTHING | Advancing | No |
| T2 | IN_PROGRESS | 62% | REPLICATION | Slower | Yes |
| T3 | IN_PROGRESS | 78% | REPLICATION | Limited | Yes |
| T4 | IN_PROGRESS | 66% | NOTHING | Advancing | No |
Then ask:
Evidence supporting a relationship
- Problem begins at the same time.
- Log pressure remains sustained.
- CDC progression is materially delayed.
- Long transactions contribute substantial log activity.
- Reducing unnecessary write pressure produces measurable improvement.
Evidence weakening the relationship
- CDC progresses normally.
- Log space is actively reused.
- Scale remains IN_PROGRESS despite normal log behavior.
- Scale problems occur independently of CDC pressure.
- Log pressure clears but operation state doesn't change.
This distinction protects the investigation from a common mistake:
Correlation is an investigation path, not proof of root cause.
15. Don't Disable CDC as a First Step
Disabling CDC is a substantial configuration change.
It can affect:
- ETL pipelines.
- Integration platforms.
- Analytics workloads.
- Incremental processing.
- Downstream synchronization.
- CDC history.
Azure SQL Database provides documented procedures for enabling and disabling CDC, but those procedures should be used because changing CDC is an intentional design decision, not simply because a scale operation is taking longer than expected.
Even if disabling CDC changes the symptom, that fact alone doesn't prove:
CDC was the root cause.
Other conditions may have changed simultaneously.
16. Use a Safe Mitigation Order
When a scale operation, CDC, and transaction-log pressure overlap, consider this sequence.
Step 1: Stop introducing new variables
Avoid repeatedly submitting duplicate or conflicting scale operations.
Step 2: Preserve operation evidence
Capture:
- Operation ID.
- Start time.
- State.
- Last modification time.
- Errors.
Step 3: Measure log health
Capture:
- Log size.
- Used log percentage.
- Truncation holdup reason.
- Trend over time.
Step 4: Validate CDC
Confirm:
- CDC enabled.
- Tracked tables.
- CDC progression.
- Recent CDC configuration changes.
Step 5: Investigate long-running transactions
Determine:
- Age.
- Session.
- Application owner.
- Log consumption.
- Business impact of intervention.
Step 6: Reduce avoidable write pressure
When operationally safe, reduce nonessential:
- Bulk updates.
- Large batches.
- ETL writes.
- Maintenance jobs.
- Excessive write concurrency.
Step 7: Treat CDC changes as controlled interventions
Only disable CDC when:
- Downstream impact is understood.
- The change is justified.
- The recovery/reinitialization path is understood.
- Evidence supports testing it.
17. Validate Recovery
Don't stop when the scale operation finally completes.
Confirm all layers.
Scale operation
Verify that the operation reached:
- COMPLETED
- FAILED
- CANCELLED
rather than remaining indefinitely in an intermediate state.
Transaction log
Verify:
- Log usage stabilizes.
- Log reuse resumes.
- log_truncation_holdup_reason changes appropriately.
CDC
Verify:
- Change capture continues.
- Expected tracked tables remain enabled.
- Downstream consumers remain healthy.
Application
Verify:
- Connections recover.
- Workload resumes normally.
- No unexpected backlog remains.
18. Know When to Escalate
Escalation becomes appropriate when you've established that:
- The scale or cancellation operation remains persistently nonterminal.
- No meaningful state changes are occurring.
- Database workload evidence has been captured.
- Log health is understood.
- CDC status is documented.
- Long transactions have been investigated.
- Business impact continues.
Microsoft provides sys.dm_operation_status specifically for monitoring operations performed on Azure SQL databases, including pending, in-progress, failed, cancellation-in-progress, and canceled states.
A useful escalation package includes:
- Sanitized operation history.
- Service objective before and after the requested scale.
- sys.dm_operation_status evidence.
- Log-space trend.
- log_truncation_holdup_reason.
- CDC state.
- CDC progress observations.
- Long-running transaction evidence.
- Resource metrics.
- Mitigations attempted and their results.
- Remaining application/business impact.
19. Practical Decision Tree
When an Azure SQL scale operation appears stuck:
Is the operation still nonterminal?
No
- Validate workload, CDC, and log health.
- Continue monitoring.
Yes
- Record its state and timeline.
Is the transaction log under sustained pressure?
No
- Don't make CDC the primary hypothesis solely because it's enabled.
Yes
- Continue.
What is preventing log reuse?
ACTIVE_TRANSACTION
- Investigate long-running transactions.
REPLICATION with CDC enabled
- Investigate CDC progress and transaction activity.
Another value
- Investigate that truncation holdup independently.
Is CDC demonstrating progress?
Yes
- A completely stalled CDC process becomes a weaker hypothesis.
- Continue investigating log generation and the scale operation separately.
No, or inconclusive
- Gather repeated samples.
- Check transactions and workload pressure.
Did log pressure resolve while scaling remained stuck?
Yes
- The evidence weakens the hypothesis that log/CDC pressure alone explains the operation.
No
- Continue correlation and consider escalation.
Final Takeaway
When Azure SQL scaling, CDC, and transaction-log pressure happen together, don't begin with:
"CDC blocked the scale operation."
Begin with four independent questions:
- What is the actual state of the scale operation?
- Is the transaction log genuinely under sustained pressure?
- Why is log reuse being delayed?
- Is CDC demonstrating forward progress?
Azure SQL Database provides documented tools for each layer:
- sys.dm_operation_status for operation state.
- sys.dm_db_log_space_usage for log-space utilization.
- sys.dm_db_log_stats() for transaction-log health and truncation holdup.
- sys.dm_tran_database_transactions for transaction/log consumption.
- sys.dm_db_resource_stats for recent CPU, I/O, and log-write pressure.
- Azure SQL Database's built-in CDC scheduler and CDC metadata for capture investigation.
Most importantly:
Don't disable CDC just because two symptoms occurred together.
Preserve evidence, reduce unnecessary workload pressure, address demonstrated transaction problems, and escalate persistent nonterminal scaling operations with a clear timeline.
Because:
The safest diagnosis separates correlation from causation before changing the workload.
Further reading

 Microsoft