azure sql database
173 TopicsLessons Learned #554: I Have Used BCP for Years — But How Does It Actually Work?
BCP is one of those SQL Server tools that many of us have been using for years. It is simple, reliable, and extremely fast when we need to move large amounts of data. We execute it, and millions of rows can be loaded into SQL Server or Azure SQL Database. But after using BCP many times, I had a question that stayed in my mind: Why is BCP so fast? And that question led me to another one: What does BCP actually send to SQL Server? Is it simply executing thousands or millions of INSERT statements behind the scenes? And finally: Could I create my own BCP-like application in C++, .NET, Java, or another programming language and adapt it to my own requirements? That curiosity is what motivated this article. The answer is quite interesting. BCP is not simply a faster way to execute INSERT statements. It uses a different model for moving data. A Very Simple BCP Example A typical import might look like this: bcp MyDatabase.dbo.Customers in customers.csv -S myserver.database.windows.net -d MyDatabase -c -t"," -T The bcp utility bulk copies data between SQL Server and a data file in a user-specified format. Microsoft also exposes bulk-copy functionality programmatically through SQL Server drivers. At a very high level, we normally think of the process as: File -> BCP -> SQL Server. But there is much more happening in between. My First Question: Is BCP Sending INSERT Statements? Imagine that we need to load one million rows. A traditional application could repeatedly execute something like: INSERT INTO dbo.Customers ( CustomerId, CustomerName, Amount ) VALUES ( @CustomerId, @CustomerName, @Amount ); Even when the connection is reused and the statement is parameterized, we are still performing a very large number of individual database operations. BCP works differently. And this is probably the most important concept in this article: BCP is not a faster way to send millions of INSERT statements. It avoids sending those INSERT statements in the first place. Instead, BCP establishes a bulk data stream with SQL Server. Going One Level Lower: TDS SQL Server clients communicate with the database engine using TDS — Tabular Data Stream. TDS carries SQL requests, result sets, metadata, errors, authentication information, bulk data, and other messages between the client and SQL Server. For bulk loading, TDS defines a dedicated bulk-load stream. At a simplified level, it looks like this: Conceptually, SQL Server first receives metadata describing the incoming row shape, followed by the row stream and a completion token. This is a completely different model from repeatedly submitting: INSERT INSERT INSERT INSERT INSERT SQL Server is told what the incoming data looks like, and then rows are streamed continuously through the connection. There Is an INSERT BULK Operation This was one of the details I found most interesting. When we execute bcp.exe, we do not manually write an INSERT BULK statement. However, the bulk-load protocol requires the client to identify the destination and incoming structure before sending the actual row stream. A simplified sequence looks like this: The important point is that the rows themselves are not represented as complete SQL statements. They are part of a structured bulk stream. What Is COLMETADATA? Suppose our destination table is: CREATE TABLE dbo.Customers ( CustomerId int, CustomerName varchar(100), Amount decimal(10,2) ); Before SQL Server can interpret the incoming row data, it needs information about the shape and types of the columns. Conceptually, the metadata describes something similar to: Column 1 INT Column 2 VARCHAR Length = 100 Column 3 DECIMAL Precision = 10 Scale = 2 Then the row stream follows: ROW 1001 Juan 42.50 ROW 1002 Pedro 18.75 ROW 1003 Jose 91.00 The real TDS representation is binary and structured, not human-readable like this, but the mental model is useful:BCP sends structured row data through the bulk protocol instead of generating SQL text for every record. From a CSV File to SQL Server Imagine the source file contains: 1001,Juan,42.50 1002,Pedro,18.75 1003,Jose,91.00 and we execute: bcp MyDatabase.dbo.Customers in customers.csv -S myserver -c -t"," -T Because we are using character mode, the source contains character representations. BCP reads the file, recognizes the fields according to the specified format, and feeds the values into the bulk-copy path. For example, the character value "1001" ultimately has to become an INT, and "42.50" has to become a DECIMAL(10,2). So BCP is fast, but it is not magic. Data still has to be interpreted and converted into the destination SQL Server data types. What About Memory? This was another thing I wanted to understand. Suppose I need to import a 100-GB file. Does BCP need 100 GB of memory? No. A better mental model is a streaming pipeline. The complete file does not need to reside in memory at the same time. Buffers can be filled, transmitted, reused, filled again, and transmitted again. The amount of data being transferred is not the same as the amount of memory required to transfer it. A Row Is Not Necessarily a Network Packet Sending one row through the BCP API does not necessarily mean that one network packet is immediately sent for that row. The bulk-copy implementation can accumulate rows while filling network packets. Conceptually: Row 1 ----\ Row 2 -----\ Row 3 ------> Network packet ---> SQL Server Row 4 -----/ Row 5 ----/ This is much more efficient than treating every row as an independent network operation. The command-line utility also exposes a packet-size option through -a packet_size. Larger is not automatically better; the optimal value depends on the environment, row size, driver, network, and workload. Then I Discovered the BCP API This was probably my favorite part of the investigation. BCP is not only a command-line utility. Microsoft exposes bulk-copy functionality programmatically through the ODBC bulk-copy API. Among the available functions are: bcp_init() bcp_bind() bcp_sendrow() bcp_batch() bcp_done() That means we can create our own bulk loader instead of launching bcp.exe. Understanding bcp_bind() Imagine that our application contains: int CustomerId; char CustomerName[100]; With the BCP API, those variables can be associated with destination columns. The application can then populate the same variables repeatedly and call bcp_sendrow() to feed another row into the bulk stream. CustomerId = 1; strcpy(CustomerName, "Customer A"); bcp_sendrow(hdbc); CustomerId = 2; strcpy(CustomerName, "Customer B"); bcp_sendrow(hdbc); The application is not building and submitting a new INSERT INTO... statement each time. It keeps populating values and feeding rows into the existing bulk-copy pipeline. The Source Does Not Even Need to Be a File Once we understand the API, another interesting possibility appears: the source can be anything our application knows how to read. For example, the source could be a REST API, a message stream, another database, generated data, or an in-memory structure. bcp.exe is therefore one implementation of the bulk-copy concept, not the only way to use it. Can I Create My Own BCP in Another Programming Language? Yes. The exact interface depends on the language and driver. C / C++ The ODBC BCP API gives low-level access using functions such as: bcp_init bcp_bind bcp_sendrow bcp_batch bcp_done .NET For .NET applications, Microsoft provides SqlBulkCopy : using var connection = new SqlConnection(connectionString); await connection.OpenAsync(); using var bulkCopy = new SqlBulkCopy(connection); bulkCopy.DestinationTableName = "dbo.Customers"; bulkCopy.BatchSize = 10000; await bulkCopy.WriteToServerAsync(reader); Java The Microsoft JDBC Driver provides SQLServerBulkCopy : SQLServerBulkCopy bulkCopy = new SQLServerBulkCopy(connection); bulkCopy.setDestinationTableName("dbo.Customers"); bulkCopy.writeToServer(resultSet); The important concept is that the same bulk-copy model can be consumed directly by applications. Batches: Another Piece of the Puzzle There is another important concept: transaction batching. Using the BCP API, an application can send multiple rows and then call: bcp_batch(); The command-line utility exposes the same general idea through -b batch_size. Batching can affect transaction duration, rollback scope, transaction-log behavior, error recovery, and throughput. Batch size is not the same thing as memory buffer size. If we specify -b 100000, we are primarily defining a transactional boundary. We are not saying that BCP must hold exactly 100,000 rows in RAM. What Happens When the Stream Arrives at SQL Server? Successfully delivering rows to SQL Server is only part of the operation. On the server side, a simplified path looks like this: TDS bulk stream-> Decode metadata and rows -> Bulk-load processing -> Storage Engine -> Data pages -> Transaction log SQL Server still needs to store those rows. Depending on the destination, that can involve data-type processing, page allocation, transaction logging, index maintenance, constraint validation, identity handling, triggers, locking, and dirty data pages. So Why Is BCP So Fast? After looking at the mechanism, I do not think there is one single magic optimization. BCP is fast because several efficiencies work together. Traditional row-by-row processing BCP / Bulk Copy Many individual SQL operations Continuous bulk stream Repeated execution overhead Bulk-oriented processing Potentially many client/server interactions Persistent streaming pipeline SQL statement representation Structured row representation Small network operations possible Rows can be packed efficiently into packets Frequent transaction boundaries possible Controlled batching Generic DML execution pattern Bulk-copy-oriented path For a few rows, the difference might not matter much. Multiply those savings by millions of rows, and the result becomes significant. References Microsoft Learn — bcp utility Microsoft Learn — Import and export bulk data using bcp Microsoft Open Specifications — TDS Bulk Load BCP Microsoft Learn — bcp_bind Microsoft Learn — bcp_sendrow Microsoft Learn — SqlBulkCopy Microsoft Learn — SQLServerBulkCopy244Views0likes0CommentsAzure SQL Data Sync Retirement: Migration Insights and Modern Alternatives
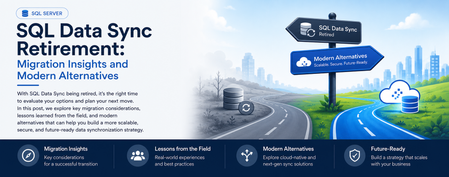
What started as a routine customer discussion quickly evolved into a strategic modernization conversation. A service that had quietly synchronized business-critical data for years was approaching retirement, prompting an important question: What should organizations do next? Every service retirement is an opportunity to reassess architecture, reduce technical debt, and build for the future. When a Retirement Notification Becomes a Business Conversation Recently, while working with a customer, we reviewed their Azure SQL Database architecture and discovered a critical dependency on SQL Data Sync For years, the service had reliably synchronized data across multiple databases, enabling applications, reporting workloads, and distributed business processes. Like many organizations, the customer viewed Data Sync as infrastructure that simply worked in the background. However, the discussion took a different turn when we reviewed Microsoft's retirement announcement: Azure SQL Data Sync will be retired on September 30, 2027. What initially appeared to be a migration challenge quickly became an opportunity to modernize the customer's data movement architecture and align with Microsoft's future investments in data integration, analytics, and cloud-native services. Understanding SQL Data Sync Azure SQL Data Sync was designed to synchronize selected data between Azure SQL Databases and, in some cases, between Azure and on-premises databases. Organizations have commonly used Data Sync for: Hybrid data synchronization Distributed application architectures Globally distributed applications Bi-directional data synchronization While the service has served customers well, organizations should begin evaluating alternative solutions now to ensure sufficient planning, testing, and adoption time before retirement. Because both databases were already in Azure, the discussion quickly moved toward identifying strategic alternatives. Customer's Setup This particular customer had a simple, familiar layout: one Azure SQL Database feeding another, both fully in Azure, connected by SQL Data Sync. No on-premises leg, no complicated topology — just two cloud databases that needed to stay aligned. Their requirements were equally straightforward, and honestly, the kind every team asks for: Reliable, dependable synchronization Low operational overhead — nobody wanted a new system to babysit Something with a real future, not another service on a retirement countdown Room to scale as data volumes grow An Azure-native fit, not a bolt-on third-party tool Because both databases already lived in Azure, the conversation moved quickly toward the platform's own native tooling — starting with the option that ended up being the strongest fit. Option 1: Azure Data Factory (Recommended Strategy) For customers running Azure SQL Database to Azure SQL Database synchronization, Azure Data Factory (ADF) emerged as the strongest strategic recommendation. Why ADF? Azure Data Factory provides: Fully managed Azure-native data movement Enterprise-grade monitoring Flexible orchestration Scalability from development through production environments Long-term Microsoft investment and support The migration pattern we typically recommend looks like: Phase1 :Initial Full Load Before anything can stay in sync, both sides need to start from the same place. Phase 1 is a one-time bulk copy: Azure Data Factory reads everything from the source database and writes it into the target, establishing a clean baseline. Phase2 :Incremental Synchronization Once both databases match, you don't need to keep copying everything — just what's changed. This is where Change Tracking (CT) or Change Data Capture (CDC) comes in: SQL Server-native features that flag which rows were inserted, updated, or deleted since the last run. ADF's incremental pipeline reads only those deltas and applies them downstream, on whatever schedule the business needs — minutes, hours, or daily. Phase 3: Scheduling and Monitoring Once both phases are live, ADF takes over the operational side: scheduling pipeline runs, monitoring their health, retrying failures automatically, and alerting your team when something needs attention. That's a level of visibility SQL Data Sync's built-in sync groups never really offered ADF handles: Scheduling Pipeline execution Monitoring Retry mechanisms Alerting This model often delivers greater visibility and operational control than traditional SQL Data Sync implementations. When You Don't Need Synchronization — You Need a Copy Partway through the engagement, one question reframed the whole discussion: do we actually need two-way synchronization, or do we just need a readable copy of the database somewhere else? That distinction matters more than it sounds, and it points to three other options worth knowing. Option 1: Active Geo-Replication If the goal is disaster recovery, serving read traffic closer to users, or keeping the business running through a regional outage, Active Geo-Replication is usually a better fit than rebuilding sync logic from scratch. It gives you a continuously updated, readable secondary — not a bi-directional sync target. Best fit Disaster recovery scenarios Read-intensive applications Global user distribution Secondary readable databases Less ideal for Complex data transformations Bi-directional updates Option 2: Database Copies and Read Replicas Some organizations do not require continuous synchronization at all. In those cases: Read Replicas Database Copy Good Use Cases Reporting databases Analytics environments Refreshable staging systems Read-only workloads This approach significantly reduces architectural complexity while still meeting many business requirements. Option 3: Microsoft Fabric Mirrored Databases As Microsoft Fabric adoption grows, another interesting alternative is Fabric Mirrored Databases. This option is particularly attractive for organizations already investing in: Microsoft Fabric OneLake Real-time analytics AI and data platform modernization Benefits include: Near real-time data availability Simplified analytics architecture Integration with Fabric workloads Reduced data silos For customers modernizing both operational and analytical platforms, this can be an excellent opportunity to rethink data architecture beyond simple synchronization. Option 4: Azure Functions for Event-Driven Synchronization Not every customer requires a large orchestration platform. For lightweight or application-specific synchronization logic, Azure Functions may offer a more agile approach. Example Use Cases Event-driven updates Custom business rules Microservices architectures Low-volume synchronization requirements The tradeoff is that customers assume additional development and operational responsibilities Lessons Learned from the Customer Engagement This engagement reinforced several important lessons: Don't Wait Until 2027 Although retirement is over a year away, large organizations often require significant planning, testing, governance approvals, and deployment cycles. Starting early reduces risk. There Is No Universal Replacement The right solution depends on: Latency requirements Read versus write workloads Synchronization direction Operational complexity DR requirements Budget limitation Different use cases require different migration paths. 3. Migration Is an Opportunity Rather than simply replacing SQL Data Sync, organizations should evaluate: Data architecture modernization Observability improvements Operational simplification Fabric adoption opportunities Long-term cloud strategy Final Recommendations For most customers currently using Azure SQL Database → Azure SQL Database synchronization: Requirement Recommended Solution Ongoing synchronization Azure Data Factory + CDC/Change Tracking Read-only replica Active Geo-Replication Simple duplication Database Copy or Read Replica Analytics modernization Fabric Mirrored Databases Event-driven custom logic Azure Functions In my customer's use case, Azure Data Factory with incremental changes (CDC) emerged as the preferred strategic path because it was Azure-native, scalable, supported long-term, and aligned with Microsoft's future direction for data movement and integration. Closing Thoughts Technology retirements often create urgency, but they also create opportunity. retirement of SQL Data Sync is not merely a migration project. It is an opportunity to reassess data movement architecture, improve resiliency, reduce technical debt, and embrace modern Azure-native services. If your organization is currently using SQL Data Sync, now is the right time to inventory your sync groups, identify dependencies, and begin evaluating alternative architectures before September 30, 2027. References SQL Data Sync Retirement Migration Guide What is SQL Data Sync for Azure SQL Database? SQL Data Sync retirement: Migrate to alternative solutions502Views1like0CommentsLessons Learned #553: Before Troubleshooting SQL Server, Find Out Who Generated the Error
Recently, I reviewed a customer case where an application intermittently reported: com.microsoft.sqlserver.jdbc.SQLServerException: The statement did not return a result set. The issue occurred during a specific period and was no longer reproducible. Instead of starting troubleshooting from the database side, my first objective was to answer a simpler question: Who is actually generating this error: SQL Server Engine or the JDBC driver? Step 1 – Is this a SQL Server Engine error? A useful first check is sys.messages. SQL Server exposes its system-defined error messages through this catalog view, so I can search for the reported text: SELECT message_id, severity, text FROM sys.messages WHERE text LIKE '%did not return a result set%'; The sys.messages catalog view contains the system error messages available in SQL Server. If I find the error there, I have a good reason to continue investigating the SQL Server Engine error number, severity, conditions, and associated diagnostics. In this case, however, the message led me in another direction. An important caveat: not finding a message in sys.messages does not by itself prove that SQL Server or Azure SQL Database cannot be involved. Errors can also originate from drivers, operating systems, network libraries, gateways, application frameworks, or custom code. However, it is a very useful way to reduce the troubleshooting scope. Step 2 – Follow the component mentioned in the exception The exception class itself provided the next clue: com.microsoft.sqlserver.jdbc.SQLServerException. This pointed directly to the Microsoft JDBC Driver for SQL Server, so instead of continuing with database-side diagnostics, I decided to inspect the driver implementation. The driver is open source and its code is available in the Microsoft GitHub repository: microsoft/mssql-jdbc The Java source code is located under: src/main/java/com/microsoft/sqlserver/jdbc/. This directory contains the implementation of the JDBC driver, including connection handling, statements, prepared statements, result sets, exceptions, and resource messages. Step 3 – Search for the exact error text I searched the source code for: The statement did not return a result set. The message is defined in: src/main/java/com/microsoft/sqlserver/jdbc/SQLServerResource.java as: {"R_noResultset", "The statement did not return a result set."} This was already an important finding. The exact message is defined inside the JDBC driver. Step 4 – Search for R_noResultset The next step was to search for the resource identifier: R_noResultset This led to: src/main/java/com/microsoft/sqlserver/jdbc/SQLServerPreparedStatement.java where the driver contains the following logic: if (EXECUTE_QUERY == executeMethod && null == resultSet) { SQLServerException.makeFromDriverError( connection, this, SQLServerException.getErrString("R_noResultset"), null, true); } Now the meaning of the customer's error becomes much clearer. The application executed the statement using an operation equivalent to: executeQuery() but after processing the response: resultSet == null Therefore, the JDBC driver raises this exception when executeQuery() is used but, after processing the response, no ResultSet is available (resultSet == null). Step 5 – Now investigate the database execution Only at this point would I move deeper into the SQL execution. The question is no longer: Why did SQL Server fail? It becomes: Why did this execution not return the ResultSet that the JDBC application expected? For example: IF Condition = 1 BEGIN SELECT ... END One execution might produce: Condition = TRUE -> SELECT -> ResultSet -> executeQuery() succeeds while another could produce: Condition = FALSE -> No SELECT -> No ResultSet -> JDBC raises the exception This could also explain why the customer's issue was intermittent. At that stage I would investigate the stored procedure, parameters, conditional branches, DML operations, multiple result sets, and the application's use of executeQuery(), executeUpdate(), or execute(). The troubleshooting lesson The most useful part of this case was not only understanding this particular exception. It was the troubleshooting process: Customer error -> Who generated it? -> Search sys.messages -> Engine error? YES -> SQL Server troubleshooting NO / unclear -> Identify client component -> Search its source code -> Locate exact message -> Find where it is raised -> Understand the condition -> Return to SQL Server with a focused hypothesis When the client component is open source, its source code can become another diagnostic tool. Instead of collecting large amounts of database telemetry, we can first determine which component generated the error and why. One final consideration: always check the JDBC driver version used by the customer and, when possible, inspect the corresponding GitHub release or tag rather than relying exclusively on the current main branch. Sometimes a few lines of source code can significantly reduce hours of troubleshooting.196Views0likes0CommentsLessons Learned #539: Azure SQL DB Scale-Down from S3 to S2 Can Fail When Change Feed Is Enabled
Recently, I worked on a service request where a customer reported that an Azure SQL Database could not be scaled down from Standard S3 to Standard S2. The operation failed with the following message: "An unexpected error occurred while processing the request". During the troubleshooting process, we reviewed the database configuration to identify any setting that could prevent the scale-down operation. As part of that review, we executed the query select * from sys.databases and observed that the column is_change_feed_enabled had a value different from 0. This indicated that Change Feed was enabled on the database and, according to the current documentation, this setting is not supported when scaling down to Standard S0, S1, or S2 After disabling Change Feed by running EXEC sys.sp_change_feed_disable_db; we were able to complete the scale-down operation successfully.842Views0likes0CommentsLessons Learned #552:10 Lines in an SSMS MSAL Trace That Tell You Almost Everything You Need to Know
In one of our support cases, a customer reported higher-than-expected connection times when connecting from SQL Server Management Studio (SSMS) to Azure SQL Database using Microsoft Entra authentication. The behavior was also not completely consistent. Sometimes the connection required interaction with the account selection experience. Other times, subsequent connections were noticeably faster. At first, there were several possible areas to investigate: Was Azure SQL taking too long to authenticate the user? Was there a networking, proxy, or firewall issue? Was access to login.microsoftonline.com being delayed or denied? Was Microsoft Entra authentication itself taking the time? Was Conditional Access or MFA involved? Was SSMS using the expected Microsoft Entra account? Was the delay happening before or after the access token was obtained? The important question became: Where exactly was the connection time being spent? Instead of treating the SSMS connection as a single operation, I enabled verbose MSAL tracing in SSMS and started following the authentication process. SSMS exposes the MSAL Output Window Trace Level under Tools → Options → Azure Services. The same options page exposes the Microsoft Entra authority, Azure SQL Database service principal name, and Web Account Manager settings. The resulting trace was large—hundreds of lines. But while analyzing it, I realized something useful: I didn't need to understand every line in the MSAL trace. A small number of search strings were enough to reconstruct almost the entire authentication story. These are the 10 things I learned to look for. 1. CorrelationId — First, make sure I am following the same authentication request One of the first things I learned was not to read the trace only by timestamp. MSAL performs several related operations: GetAccounts. AcquireTokenSilent. ReadAccountById AcquireTokenInteractive Broker operations Token cache operations Some can happen almost at the same time, and they don't necessarily share the same correlation ID. For example, in one reproduction, the silent authentication attempt had one correlation ID, while the subsequent interactive request used another one. So my first search became: CorrelationId I learned not to calculate latency by simply subtracting two nearby timestamps. First I identify: Operation + CorrelationId + Start / End and only then interpret the timing. This becomes particularly valuable if the logs later need to be correlated with identity-service investigations. MSAL exposes the correlation ID specifically to piece together an authentication flow. 2. ApiId — Was SSMS trying silent or interactive authentication? My second search became: ApiId In the first connection attempt I found: ApiId - AcquireTokenSilent That immediately told me that SSMS was not initially trying to display an authentication UI. It first attempted to obtain the token silently. But later in the same reproduction I found: ApiId - AcquireTokenInteractive Now the flow was becoming clearer: SSMS ->AcquireTokenSilent -> Silent authentication cannot continue -> AcquireTokenInteractive This was my first important lesson from the case: An SSMS Microsoft Entra connection isn't necessarily interactive from the beginning. MSAL can first try silent authentication and only switch to an interactive mechanism if necessary. Microsoft documents MsalUiRequiredException precisely for situations in which a non-interactive acquisition cannot continue without user interaction—for example because sign-in, MFA, consent, or another requirement must be satisfied. 3. Authority — Where was the authentication request actually going? The next thing I wanted to know was whether the delay could be associated with reaching Microsoft Entra. I searched for: Authority - The trace showed: Authority - https://login.microsoftonline.com/<tenant-id>/ This single line gives us two very important pieces of information: https://login.microsoftonline.com/ -> Microsoft Entra tenant -> Identity authority That means that before blaming Azure SQL, I can establish which identity endpoint SSMS/MSAL is using. This is also where a frequently reported problem such as: "It looks like access to login.microsoftonline.com is denied." can be investigated much more precisely. If I see something such as: MsalServiceException StatusCode: 403 AADSTS.... then I need to inspect the Microsoft Entra response and its error code. If I see a DNS, TLS, proxy, connection timeout, or similar exception, the network path to the identity endpoint becomes much more relevant. Those are very different problems. MSAL distinguishes client/library errors (MsalClientException), token-provider/service responses (MsalServiceException), and scenarios requiring interaction (MsalUiRequiredException). Network failures that MSAL doesn't handle are propagated to the application. One thing I would not conclude from a 403 alone is: "The firewall is blocking login.microsoftonline.com." The ErrorCode, AADSTS code, StatusCode, and ResponseBody together are much more useful than the HTTP status alone. 4. Scopes — Which resource was SSMS requesting the token for? Another line that became essential was: Scopes - Our trace showed: Scopes - https://database.windows.net//.default This helped me separate two parts of the connection that are easy to mix together: Microsoft Entra Authority login.microsoftonline.com -> issues / obtains identity token Token requested for database.windows.net -> Azure SQL The Authority tells me where authentication is being performed. The scope tells me for which resource the token is being requested. SSMS documents https://database.windows.net/ as the Azure SQL Database service principal name used when obtaining a Microsoft Entra token. That gave me another troubleshooting rule: Don't treat a Microsoft Entra token acquisition problem and an Azure SQL authorization problem as the same thing. 5. LoginHint — What identity did SSMS suggest? The next search gave us one of the most interesting findings of the investigation: LoginHint In one reproduction we had: LoginHint provided: True and later: LoginHint - user@contoso.com In another reproduction, a different login hint was supplied, and MSAL eventually returned: MsalUiRequiredException ErrorCode: no_account_for_login_hint with the explanation that no account in the token cache matched that login hint. At first sight, it is tempting to interpret: no_account_for_login_hint as: Incorrect username But the other traces showed me that this interpretation is too simplistic. LoginHint is better understood as: "Try to locate or preselect this identity" It doesn't necessarily mean: "This is already the resolved MSAL account" . That distinction turned out to be very important. 6. Account provided and GetAllAccounts — LoginHint and Account are not the same thing This became perhaps my favorite finding from the investigation. I started searching for: GetAllAccounts and: Account provided In one trace we had: GetAllAccounts ... found 1 accounts but: LoginHint provided: True Account provided: false MSAL nevertheless ended with: no_account_for_login_hint This originally looked contradictory. There was an account in the cache, but MSAL said there was no account for the login hint. It isn't contradictory. What I learned was: An account exists ≠ An account matching this LoginHint exists Then I captured another scenario: LoginHint provided: False Account provided: Account username: user@contoso.com Now SSMS/MSAL wasn't trying to resolve a textual login hint. It already had a concrete account. I started thinking of the two cases like this: LoginHint -> "Try this identity" Account provided -> "Use this resolved identity" This distinction can be especially useful when investigating aliases, UPNs, multiple Windows accounts, cached identities, or cross-tenant accounts. The same error can also have another explanation Another reproduction made the lesson even clearer. This time the trace started with: GetAllAccounts ... found 0 accounts Found 0 RTs and 0 accounts SSMS attempted: LoginHint provided: True Account provided: false and again received: ErrorCode: no_account_for_login_hint But this time the UPN itself was valid. The cache simply contained no suitable account. So another important lesson was: Never diagnose no_account_for_login_hint from the error text alone. Check GetAllAccounts, LoginHint, and Account provided together. 7. ErrorCode, AADSTS, StatusCode — The error tells me where to investigate next At this point I realized that one of the fastest troubleshooting searches was simply: ErrorCode together with: AADSTS StatusCode ResponseBody MsalUiRequiredException MsalServiceException MsalClientException For example: MsalUiRequiredException ErrorCode: no_account_for_login_hint immediately tells me that I am still dealing with token acquisition/account resolution. I haven't reached the point where Azure SQL database permissions would explain this particular failure. This became my mental decision table: Evidence in the trace Where I would investigate first no_account_for_login_hint LoginHint / cached account / account resolution MsalUiRequiredException Why silent authentication requires interaction authentication_canceled Interactive UI / broker / user cancellation AADSTSxxxxx Microsoft Entra authentication or policy MsalServiceException Token provider/service response MsalClientException Client/library/device side DNS/TLS/proxy exception Connectivity to identity service Access token obtained successfully Move the investigation beyond token acquisition 8. Broker, WAM, authorization_type — Who was really authenticating me? This was another part that changed how I read SSMS authentication traces. I searched for: Broker WAM RuntimeBroker auth_flow authorization_type and found: Broker is configured followed by: Using Windows account picker and: Calling SignInInteractivelyAsync The telemetry then reported: auth_flow: Broker authorization_type: Interactive So the authentication path was more accurately represented as: SSMS -> MSAL -> Windows Web Account Manager -> Account / authentication broker -> Microsoft Entra WAM is a Windows component that MSAL can use as an authentication broker. It can integrate with accounts already known to Windows and provide SSO and account-selection capabilities. But another trace showed: authorization_type: WindowsIntegratedAuth during a silent acquisition. That taught me something else: The same SSMS connection target does not necessarily follow the same identity path every time. Account state, cache state, WAM, tenant, identity configuration, MFA, Conditional Access, and whether interaction is required can all affect the path. 9. AccessToken returned — This is the line that changes the investigation Eventually, I found the line that I consider one of the most useful in the entire trace: AccessToken returned: True In our successful authentication we also had: AccessToken Type: Bearer and later: === Token Acquisition finished successfully source: Broker This became a very useful troubleshooting boundary for me: Identity troubleshooting: Account LoginHint MSAL WAM MFA / CA Authority Token acquisition -> AccessToken returned: True -> Azure SQL Token validation Principal resolution Database authentication Authorization Permissions If the token has been successfully obtained, asking: "Why can't MSAL authenticate?" is probably no longer the most useful question. Now I want to know: "What happens when this token is presented to Azure SQL?" That doesn't prove that the complete SQL connection will succeed, but it gives us a very useful point at which to change troubleshooting direction. 10. DurationTotalInMs — Finally, I could see where the connection time was going This was the original reason for the support investigation. The customer reported high connection times. So eventually the most important searches became: DurationTotalInMs DurationInHttpInMs DurationInCacheInMs request_duration time_in_queue_ms Microsoft defines DurationTotalInMs as the total time spent by MSAL acquiring a token, including network and cache operations. DurationInHttpInMs represents time spent in HTTP calls made by MSAL to the identity provider, and DurationInCacheInMs measures cache activity. And now we finally had evidence from our reproduction. The first token acquisition reported: DurationTotalInMs: 2185 DurationInCacheInMs: 0 DurationInHttpInMs: 0 But the broker telemetry contained another very interesting metric: time_in_queue_ms: 2152 and request_duration: 2183 That changed the quality of the diagnosis completely. Instead of saying: "SSMS authentication seems to take around two seconds." I could say: The captured token acquisition took approximately 2.18 seconds, and approximately 2.15 seconds were represented as broker queue time in the MSAL/WAM telemetry. That is actionable evidence. Putting the 10 searches together By the end of the investigation, this became the sequence I would use when somebody sends me an SSMS MSAL trace: Search for What I want to know CorrelationId Am I following the same authentication operation? ApiId Silent or interactive token acquisition? Authority Which Microsoft Entra endpoint and tenant? Scopes Which resource is the token intended for? LoginHint Which identity did SSMS suggest? Account provided / GetAllAccounts Is an identity already resolved or cached? ErrorCode / AADSTS Why did the authentication step fail? Broker / WAM / authorization_type Which authentication mechanism actually handled the request? AccessToken returned / source: Was a usable token obtained, and from where? DurationTotalInMs and related metrics Where was the authentication time spent? With those ten searches, a trace containing hundreds of lines becomes much easier to read. Appendix – Sanitized MSAL Trace Sample The following extract is a sanitized and condensed version of the MSAL trace used in this investigation. User names, tenant IDs, correlation IDs, account identifiers, and other PII have been replaced with placeholders. The goal is to provide a practical sample where you can apply the 10 searches described in this article. First connection ==== GetAccounts started ==== GetAllAccounts ... found 0 accounts Found 0 RTs and 0 accounts in MSAL cache === AcquireTokenSilent Parameters === LoginHint provided: True Account provided: false Authority - https://login.microsoftonline.com/<tenant-id>/ Scopes - https://database.windows.net//.default ApiId - AcquireTokenSilent CorrelationId - <correlation-id-1> === Token Acquisition (SilentRequest) started === MsalUiRequiredException ErrorCode: no_account_for_login_hint No account was found in the token cache having this login hint. MSAL then moved to interactive authentication: === InteractiveParameters Data === LoginHint provided: True Prompt: select_account Authority - https://login.microsoftonline.com/<tenant-id>/ Scopes - https://database.windows.net//.default ApiId - AcquireTokenInteractive LoginHint - user@contoso.com CorrelationId - <correlation-id-2> Broker is configured Using Windows account picker Calling SignInInteractivelyAsync The broker successfully obtained the token: auth_flow: Broker authorization_type: Interactive time_in_queue_ms: 2152 request_duration: 2183 WAM response status success Successfully retrieved token AccessToken returned: True AccessToken Type: Bearer === Token Acquisition finished successfully === source: Broker DurationTotalInMs: 2185 DurationInCacheInMs: 0 DurationInHttpInMs: 0 Second connection A few seconds later, the account was already available: GetAllAccounts ... found 1 accounts Returning 1 accounts === AcquireTokenSilent Parameters === LoginHint provided: False Account provided: Account username: user@contoso.com Authority - https://login.microsoftonline.com/<tenant-id>/ Scopes - https://database.windows.net//.default ApiId - AcquireTokenSilent CorrelationId - <correlation-id-3> This time the broker completed the request silently: Acquiring token silently authorization_type: WindowsIntegratedAuth auth_flow: AT request_duration: 2 WAM response status success Successfully retrieved token AccessToken returned: True === Token Acquisition finished successfully === source: Broker DurationTotalInMs: 13 DurationInCacheInMs: 0 DurationInHttpInMs: 0 What changed? First connection No account → LoginHint → AcquireTokenSilent → no_account_for_login_hint → Interactive / WAM → Token → 2185 ms Second connection Resolved Account → AcquireTokenSilent → WAM → Token → 13 ms These extracts contain the main strings I now look for when reviewing an SSMS MSAL trace: CorrelationId ApiId Authority Scopes LoginHint Account provided / GetAllAccounts ErrorCode / AADSTS Broker / WAM AccessToken returned DurationTotalInMs294Views0likes0CommentsLessons Learned #543: Evaluating MultiSubnetFailover with Azure SQL Database
Last week, I worked on a support case in which the use of the MultiSubnetFailover connection-string feature was being considered for an application connecting to Azure SQL Database. The expectation was that enabling the following option could improve connection recovery during a database failover changing MultiSubnetFailover to True. This option is commonly associated with SQL Server high availability, and Azure SQL Database is also designed to remain available by moving databases between replicas when required. However, after reviewing the Azure SQL Database connectivity architecture and comparing the behavior with the property enabled and disabled, I did not observe a clear improvement. The property could be added to the connection string without generating an error, and the application was able to connect successfully with both configurations. What MultiSubnetFailover is designed for MultiSubnetFailover was introduced primarily for SQL Server high-availability configurations such as: Always On Availability Group listeners. SQL Server Failover Cluster Instance virtual network names. In a multi-subnet Availability Group, a listener name may resolve to multiple IP addresses located in different network subnets. Without MultiSubnetFailover=True, the application may try those addresses sequentially. If the first address is not currently active, the connection can be delayed while the attempt waits for a timeout. When the option is enabled, supported SQL client drivers can attempt connections to the listener addresses in parallel and use the first address that responds successfully. This can reduce connection time after an Availability Group failover because the SQL client is directly involved in selecting the reachable listener address. Why Azure SQL Database is different Azure SQL Database uses a different connectivity architecture. The application connects to a logical server endpoint: <server-name>.database.windows.net. The Azure SQL connectivity layer receives the connection and routes it to the infrastructure currently hosting the database. Depending on the configured connection policy, the Azure SQL gateway either proxies the connection or redirects the application to the appropriate database node. The important difference is that the SQL client does not receive a list containing the IP addresses of the Azure SQL Database primary and secondary replicas. The decision and the associated routing are managed by the Azure SQL Database platform. Although Azure SQL Database internally uses multiple replicas for high availability, this is not the same connectivity model as a SQL Server Availability Group listener that publishes multiple addresses through DNS. What about Failover Groups? Azure SQL Database Failover Groups provide a stable listener endpoint such as: <failover-group-name>.database.windows.net. Following a regional failover, the listener is updated so that it points to the logical server hosting the new primary databases. This process depends partly on DNS. The listener name remains the same, but its DNS target changes after the failover. This is still different from a SQL Server multi-subnet Availability Group listener. The Failover Group listener does not expose the addresses of the Azure SQL Database replicas to the SQL client. Therefore, MultiSubnetFailover=True cannot directly select the new primary replica. In this scenario, application recovery continues to depend on the service transition, DNS resolution, and retry behavior. The importance of retry logic One of the main lessons from this case was that retry logic is more relevant to Azure SQL Database resiliency than enabling MultiSubnetFailover. An application connecting to Azure SQL Database must expect occasional transient connectivity errors. These can occur during maintenance, scaling, failover, network interruptions, or temporary service conditions. An appropriate retry strategy should normally include: A limited number of retry attempts. A short delay before the first retry. Increasing delays between subsequent attempts. A maximum retry interval. Creation of a fresh SQL connection. For transactions, retry logic requires additional care. The application must determine whether the transaction was committed, rolled back, or left in an unknown state before repeating the complete operation.Lessons Learned #545:Understanding client_ip = 0.0.0.0 in Azure SQL Auditing
During my analysis, I reproduced the same behavior in a test environment using a client connection to Azure SQL Database through a Microsoft.Sql Virtual Network Service Endpoint . After enabling Azure SQL Auditing and reviewing the original Azure SQL Database Audit file (.xel), the connection was also recorded with client_ip = 0.0.0.0. This confirms that 0.0.0.0 can represent a valid client connection using a Service Endpoint and should not automatically be interpreted as internal Azure platform. When the original client IP is not exposed, one of the best ways to identify the originating application is to configure a meaningful Application Name property in the SQL connection string:Application Name=Customer-Production; Therefore, when reviewing Azure SQL audit records with client_ip = 0.0.0.0, check the original .xel audit file and use the application_name, host_name, authenticated principal, database name, and timestamp to correlate the activity with the correct application.107Views0likes0CommentsLesson Learned #548: From Symptoms to Evidence – How I Approach an Azure SQL Investigation
After working on many Azure SQL support cases, I have learned that the initial service request details are essential, although they may not always provide sufficient information to understand the complete technical situation. When a service request is initially created, the available information may be limited to a brief description such as: The database is running slowly. CPU utilization is high. Connections are failing. The issue started after a deployment. Performance improved after a failover. The workload became slower after a service-tier migration. These details provide an important starting point for the investigation. However, the initial description may not yet include all the relevant timestamps, metrics, logs, configuration details, or historical context required for a complete technical assessment. This is completely understandable. At the time the service request is created, the immediate priority is normally to describe the observed behavior and its impact. Additional technical context can then be collected progressively during the investigation. For that reason, I normally use the initial service request details to understand the reported symptom and determine which additional information may be required. The first objective is to clarify the observed behavior, define the affected scope, and identify the evidence that may help us evaluate the different possible explanations. In this article, I would like to share the approach I normally follow when moving from an initial service request description to an evidence-based technical conclusion. Clarifying the Observed Behavior The first thing I normally try to understand is the exact impact. For example: Was the application completely unavailable, or was it slower than usual? Did the behavior affect all users or only a specific group? Did it affect all queries or only one process? Was the issue continuous or intermittent? Did it affect one database, several databases, or the complete logical server? Did the problem occur only from a particular network location? Did existing connections continue working while new connections failed? These questions may appear simple, but the answers can significantly change the direction of the investigation. For example, the initial service request details may indicate: Connections to Azure SQL Database are failing. After reviewing the scenario, we may find that: other applications can connect successfully; only one application instance is affected; existing connections continue working; only new connections are failing; the issue occurs from one specific network path. With this additional information, the situation may no longer appear to be a general Azure SQL connectivity issue. The investigation may instead need to focus on areas such as: application connection pooling; authentication; DNS resolution; token renewal; network routing; firewall rules; a specific application instance; client-side resource pressure. Similarly, a service request may indicate that the database is slow. Before looking for the cause, I normally try to understand what “slow” means in that specific situation. For example: Are all queries slower? Is only one stored procedure affected? Has execution time increased from seconds to minutes? Is the delay occurring while opening the connection? Is the delay occurring while executing the command? Is the application waiting on Azure SQL Database or on another dependency? Before reviewing metrics, logs, or execution plans, it is important to convert the initial description into a precise and measurable technical symptom. Distinguishing Observations from Possible Explanations One of the most useful habits I have developed is to separate what has been observed from what still needs to be validated. Consider the following statement: The application became slow when database CPU reached 95%. From this description, we may have two observations: the application experienced a slowdown; database CPU reached 95%. However, the relationship between those two observations still needs to be validated. High CPU may have caused the slowdown, but it could also be part of a larger chain of events. For example, CPU utilization may have increased because: the application started sending more requests; blocking caused requests to accumulate; a query execution plan changed; application retries generated additional workload; a scheduled process started running; concurrency increased; a query began processing more data; data distribution changed; statistics changed; a maintenance task started. In other words, high CPU may be the cause of the performance issue, but it may also be the result of another condition. I have seen similar situations after failovers, application restarts, and scaling operations. For example, the available details may indicate: Performance returned to normal after a failover. The failover is an important part of the investigation, but it may not, by itself, fully explain the original cause. A failover may also: disconnect blocking sessions; cause queries to compile again; refresh application connections; reset a temporary condition; clear some cached state; coincide with a reduction in workload. For this reason, I normally try to distinguish between: what was initially reported; what has been confirmed by telemetry; what is currently considered a possible explanation; what has already been validated. This distinction helps prevent an early assumption from becoming the final conclusion before sufficient evidence is available. Building a Timeline When timestamps and historical information are available, I normally try to build a timeline. A timeline is often one of the most useful parts of an investigation because several events may initially appear related until they are placed in the correct order. Consider the following example: Time Event 10:00 UTC Application deployment completed 10:05 UTC Active sessions started increasing 10:10 UTC Query duration increased 10:12 UTC Data IO reached 100% 10:15 UTC CPU reached 95% 10:20 UTC Application timeouts were reported 10:30 UTC Application service was restarted 10:35 UTC Session count returned to normal If the initial service request description mentions only the CPU peak and the application timeouts, CPU may appear to be the most likely starting point. However, the timeline shows that the number of active sessions and Data IO utilization increased before CPU reached 95%. This does not immediately confirm the root cause, but it changes the questions that should be asked. For example: Why did the number of sessions increase? Did requests start taking longer because of IO pressure? Did application retries contribute to the workload increase? Was the CPU peak the initial cause, or was it a consequence of the accumulating workload? Did the application deployment change request volume or execution patterns? Depending on the situation, the timeline may include information from: Azure Monitor metrics; Query Store; application logs; deployment history; audit events; scaling operations; failovers; configuration changes; maintenance processes; network changes. The objective is not to collect every piece of information available. The objective is to identify the sequence of events that may explain what happened before, during, and after the reported incident. Using Each Data Source for the Right Question Another lesson I have learned is that no single source of telemetry normally explains the complete situation. Different data sources answer different questions. Azure Monitor Azure Monitor can help identify whether the database reached limits related to: CPU; Data IO; log write; sessions; workers; storage; connection failures; deadlocks. These metrics are very useful for identifying when resource pressure occurred. However, a database-level metric may not directly identify the query, application, or operation responsible for that resource usage. Query Store Query Store may help identify: changes in query duration; increased CPU consumption; changes in execution count; increased logical reads; execution-plan changes; query regressions. It can be especially useful when a database-level metric needs to be correlated with specific query activity. Dynamic Management Views Dynamic Management Views may provide information about: active requests; waits; blocking; sessions; open transactions; memory grants; current resource consumption. This information is especially valuable while the issue is occurring. However, some of the data may no longer be available after the event has ended. Application Logs Application logs may help identify: connection timeouts; command duration; retry behavior; connection-pool exhaustion; authentication errors; dependency failures; changes in request volume. These logs often provide context that may not be visible from the database side. Deployment and Configuration History Deployment and configuration history may help explain why the behavior began at a particular time. This may include: application releases; schema changes; index operations; compatibility-level changes; connection-string updates; service-tier changes; network changes; security configuration changes. The important point is to choose the evidence according to the question being investigated. For example, if I am investigating whether a workload is limited by Data IO rather than CPU, reviewing only CPU percentage may not provide sufficient information. I would also want to understand: when Data IO reached its limit; whether query duration increased during the same period; which queries generated the highest number of reads; whether the workload started reading more data; whether the same degradation occurred when Data IO remained below its limit; whether additional IO capacity changed the result. The investigation becomes more effective when every piece of telemetry is connected to a specific technical question. Collecting more data does not automatically produce a better conclusion. Keeping More Than One Possible Explanation Open It is easy to identify one technically reasonable explanation and begin searching only for evidence that supports it. I normally try to avoid doing this, especially during the first stages of the investigation. For example, imagine that a database is migrated from a DTU-based service tier to a vCore-based service tier and the workload subsequently performs more slowly. One possible explanation is that the new environment does not provide sufficient CPU. However, other possibilities may include: lower Data IO capacity; lower transaction-log throughput; different memory availability; an execution-plan change; statistics changes; a compatibility-level difference; increased concurrency; a change in request volume; a change in data size or distribution; an application change unrelated to the migration. Each possible explanation requires different evidence. If CPU remains moderate while Data IO repeatedly reaches its limit, increasing the number of vCores without reviewing the storage characteristics may not address the main constraint. If Query Store shows a plan regression immediately after the migration, the selected service tier may not be the primary cause. If execution count doubled after an application deployment, the database may simply be processing more work than before. Keeping several possible explanations open does not make the investigation less decisive. It reduces the risk of reaching a conclusion before the relevant evidence has been reviewed. Defining What Would Challenge the Hypothesis One of the most useful questions I ask during troubleshooting is: What result would demonstrate that my current hypothesis may not be correct? Suppose the current hypothesis is: The performance degradation is caused by Data IO saturation. Evidence supporting this hypothesis may include: Data IO reaches 100% during the affected periods; query duration increases at the same time; the affected queries perform a high number of physical reads; CPU remains below its limit; performance improves when the workload runs with additional IO capacity. However, I should also look for results that may challenge the hypothesis. For example: Does the same slowdown occur while Data IO remains low? Are there periods with high Data IO but normal application performance? Are queries with very few reads also affected? Does additional IO capacity consistently improve the workload? Does changing another variable produce a larger improvement? Does the issue occur in an environment where the same IO pressure is not present? If an investigation only searches for supporting evidence, almost any initial theory may appear correct. Actively looking for evidence that challenges the current explanation makes the final conclusion stronger and more reliable. Conclusion After working on many support investigations, one of the most important lessons I have learned is that the initial service request details and the final technical conclusion naturally serve different purposes. The initial description provides the first available information about the observed behavior and its impact. At that stage, some of the relevant logs, metrics, timestamps, configuration details, or historical context may not yet be available. A reliable investigation begins with the initial service request details and develops progressively as additional evidence and technical context become available.185Views0likes0CommentsLessons Learned #549: Reproduce, Challenge, and Validate – Testing Technical Assumptions
During an Azure SQL investigation, the available evidence may point to a technically reasonable explanation. For example: A network change may appear to explain a connectivity issue. High CPU may appear to explain a performance degradation. A query plan change may appear to explain a longer execution time. A failover may appear to explain why the behavior disappeared. These explanations may be correct. However, before considering them confirmed, I normally try to reproduce the behavior and validate the conditions under which it occurs. A reasonable explanation is still a hypothesis until the available evidence supports it consistently. Reproduce the Smallest Useful Scenario A reproduction does not always need to recreate the complete production environment. In many cases, a smaller test provides a clearer result. For a connectivity issue, the test may require only: one client; one database endpoint; the same authentication method; the relevant network path; a clearly identified timestamp. For a performance issue, it may require: one representative query; the same parameters; the relevant database configuration; a controlled execution period. The objective is to isolate the behavior being investigated while reducing unnecessary variables. The smaller the scenario, the easier it normally becomes to understand why the result changes. Define the Expected Result Before running a test, I try to define what result I expect. For example: Hypothesis: The connection behavior depends on a specific network path. Expected Result: The behavior should occur when the connection uses that path and should not occur when an alternative path is used. Result That Would Challenge the Hypothesis: The same behavior occurs independently of the network path. The same approach can be used for performance investigations. Hypothesis: The query slowdown is caused by Data IO saturation. Expected Result: Query duration should increase when Data IO reaches its service-level limit. Result That Would Challenge the Hypothesis: The same slowdown occurs while Data IO remains low. Defining the expected result before the test helps avoid interpreting every outcome as confirmation of the initial explanation. Change One Variable at a Time When several conditions are changed simultaneously, it may be difficult to determine which one affected the result. For example, suppose a performance test includes: a larger service objective; updated statistics; a new index; lower concurrency. If performance improves, the result is positive, but it may not clearly identify which change produced the improvement. A more useful approach is to test each relevant change separately. Test Change Test 1 Original configuration Test 2 Updated statistics only Test 3 New index only Test 4 Higher service objective only This does not mean that every investigation requires an extensive test matrix. The objective is simply to avoid changing several important variables at the same time when we need to understand which one explains the behavior. Compare Where the Behavior Occurs and Where It Does Not Understanding where a behavior does not occur can be as useful as reproducing where it does. For example: Does the connection fail from one application server but succeed from another? Does the query perform normally with different parameters? Does the issue occur only through one network path? Does the previous execution plan perform better? Does the behavior disappear when concurrency is reduced? These comparisons help define the boundaries of the problem. They may not immediately identify the complete root cause, but they help determine which conditions are relevant and which ones are less likely to explain the result. Challenge the Explanation Once a test appears to support a hypothesis, I normally try to challenge it. For example, if performance improves after scaling the database, it may be tempting to conclude that CPU was insufficient. However, scaling may also provide: more memory; higher Data IO capacity; greater transaction-log throughput; additional workers; different resource limits. The improvement is important evidence, but additional information may still be required to identify which resource was actually limiting the workload. Similarly, if a failover restores normal performance, it may also have: disconnected blocking sessions; refreshed application connections; caused query recompilation; reset a temporary condition. The action that restores normal operation may not, by itself, fully explain the original cause. Document the Result and Its Limitations Not every test produces a definitive answer. A useful conclusion should describe: which conditions were tested; what result was expected; what result was observed; whether the result was repeatable; which differences from the original scenario remained; what the evidence did and did not allow us to confirm. For example: The behavior was reproduced only when the connection used the affected network path. The same authentication method and database endpoint worked successfully through an alternative path. Based on these tests, the network path was confirmed as a relevant condition. The available evidence did not identify the specific network component responsible for the behavior. This conclusion is useful because it clearly separates what was validated from what remains unknown. Conclusion Reproduction is one of the most valuable troubleshooting tools available to an engineer. However, its purpose is not simply to make an error occur again. A useful reproduction should help us understand: which conditions are required; which conditions are not relevant; what result supports the hypothesis; what result challenges it; how consistently the behavior can be observed. The most effective tests are often simple: reproduce the smallest useful scenario; define the expected result; change one variable at a time; compare affected and unaffected conditions; document the limitations. Reproduction does not only confirm that a behavior exists. It helps define the conditions under which the technical conclusion can be trusted.156Views0likes0CommentsLessons Learned #551: Azure SQL Connection Timeouts: Three Things to Check
An application starts reporting intermittent timeouts when connecting to Azure SQL Database. Some requests succeed, others fail, and a test from a developer’s laptop works perfectly. The database appears online, no recent deployment seems related, and the natural reaction is to ask: Is Azure SQL unavailable? Is the firewall blocking the connection? Should we increase the connection timeout? Should we change the driver or scale the database? Those are reasonable questions, but they may lead the investigation in the wrong direction. The most important lesson is simple: A timeout tells us how long the application waited. It does not tell us what the application was waiting for. Not every “SQL timeout” happens inside Azure SQL From the application’s point of view, opening a database connection may involve several operations: Resolving the server name. Reaching the SQL endpoint. Obtaining a Microsoft Entra access token. Waiting for an available pooled connection. Completing the SQL login. Executing the first command. When all these operations are reported through the same application method or log entry, it can look as though Azure SQL took thirty seconds to accept the connection. In reality, only part of that time may have been spent connecting to the database. In one anonymized support scenario, the application experienced problems mainly on its first connection. Network tests were successful and no corresponding SQL connection failure was identified. The investigation eventually showed that access-token acquisition was consuming a significant part of the available time. Increasing the SQL timeout or changing the firewall would not have addressed the real delay. Check 1: Capture the complete error and the exact time A screenshot containing only “Connection Timeout Expired” is rarely enough. Capture: The complete exception and inner exception. The operation being performed. The driver and version. The authentication method. The exact timestamp in UTC. Whether the issue affects every connection or only some of them. The wording around the timeout matters. For example, a timeout while obtaining a connection from the pool points toward the application’s pooling and concurrency behavior. A pre-login or TLS error belongs to a different investigation. A command timeout after the connection was established is usually a query-performance problem rather than a connection problem. Check 2: Measure the application timeline The application should record important operations separately. A simple timeline can completely change the investigation: 10:14:20.100 Token acquisition started 10:14:28.400 Token acquired 10:14:28.405 SQL connection started 10:14:29.050 SQL connection established The complete operation took almost nine seconds, but Azure SQL connection establishment took less than one second. Useful measurements include: Token-acquisition duration. Time waiting for a pooled connection. SQL connection-open duration. SQL command duration. Number of retry attempts. Applications using Microsoft Entra authentication must obtain an access token before authenticating to Azure SQL. Measuring that operation separately helps distinguish an identity delay from a database connectivity problem. This is particularly useful when the issue appears: On the first connection after startup. After a token expires. Only with Managed Identity or Workload Identity. Intermittently, while SQL authentication connections remain unaffected. Check 3: Test from the application environment A successful connection from a laptop does not validate the path used by an application running in: Azure App Service. Azure Functions. Azure Kubernetes Service. A virtual machine. An on-premises application server. A container or integration runtime. The laptop and the application may use different DNS servers, routes, firewalls, proxies and identities. Connectivity and DNS tests should therefore be performed from the environment that is actually failing. This becomes especially important when Private Endpoint is used. The application should continue connecting with: <server>.database.windows.net It should not use the Private Endpoint IP address or the privatelink.database.windows.net hostname directly. Direct login attempts using the private IP or the private-link FQDN fail; the normal logical-server FQDN must remain in the connection string. From the affected environment, confirm that: The expected DNS server answers the request. The server FQDN resolves to the expected private IP. The Private Endpoint connection is approved. The Private DNS zone is linked correctly. The resolved address is reachable through the intended route. A test from an unrelated machine is still useful for comparison, but it does not prove that the application path is healthy. Observed symptom Likely investigation area Timeout while obtaining a connection from the pool Application connection pooling Server name cannot be resolved DNS TCP connection to the endpoint cannot be established Network path, firewall or routing Error during the pre-login handshake TLS, driver, network interruption or pre-login processing Authentication or access-token error Microsoft Entra authentication, identity or token acquisition Timeout during the post-login phase Login completion, session initialization or server-side processing Execution or command timeout after connecting Query execution and database performance Avoid changing several things at once During a production incident, it is tempting to: Increase the timeout. Add firewall rules. Change the connection policy. Upgrade the driver. Restart the application. Clear connection pools. Applying several changes together makes it difficult to determine which one helped, and some may only hide the symptom. A better approach is to define one hypothesis: We believe DNS in the application environment is resolving the public endpoint instead of the Private Endpoint. Then define: The evidence supporting the hypothesis. One controlled change. The expected result. How the result will be measured. How the change will be reverted. Azure SQL supports Proxy and Redirect connection policies, which determine how traffic flows after reaching the Azure SQL gateway. The policy is configured for the logical server, so it should be verified before making firewall assumptions or changes. What should we collect before opening a support request? A small but precise evidence package can avoid several rounds of questions: Complete error and inner exception. Exact UTC timestamps. Application platform and location. Public or Private Endpoint. Server FQDN used by the application. Driver and version. Authentication method. Token, pool, connection and command durations. DNS result from the affected environment. Whether the issue is constant, intermittent or limited to the first connection. Recent application, network, identity or configuration changes.319Views0likes0Comments