t-sql
6 TopicsAzure SQL Scaling Stuck? Investigating CDC and Transaction Log Pressure
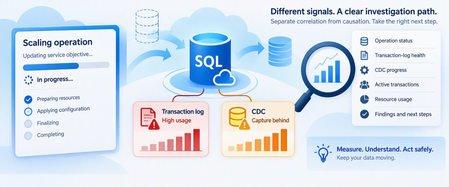
Azure SQL Database makes scaling compute straightforward. But troubleshooting becomes more complicated when several things happen simultaneously: A scale operation remains IN_PROGRESS. A cancellation remains CANCEL_IN_PROGRESS. Transaction-log usage is growing. Change Data Capture (CDC) is enabled. Log truncation reports REPLICATION. Long-running transactions are present. The temptation is to connect all these observations immediately: "CDC is preventing Azure SQL from scaling." That's a hypothesis, not yet a diagnosis. CDC reads changes from the transaction log, and CDC capture latency can delay log truncation under certain conditions. Microsoft specifically documents scenarios where CDC combined with long-running transactions can contribute to continued transaction-log growth. However, that doesn't establish a universal rule that: CDC causes scale operations to become stuck. REPLICATION as a log reuse wait means scaling is blocked. Disabling CDC will resolve a scale operation. A CDC problem and a long-running scale operation necessarily share the same root cause. The safest investigation separates the evidence into layers. 1. Start With the Scale Operation A scale operation changes the resources available to Azure SQL Database. Depending on the type of scaling operation, Azure SQL might need to: Create a compute instance with the requested configuration. Move or copy data when necessary. Redirect connections to the new environment. Terminate existing connections during the final switch. Microsoft documents that Azure SQL Database normally remains online during much of this process, although the final connection switch can cause a short interruption. Long-running transactions can increase the time required for recovery when connections are terminated. So, begin with the operation itself. 2. Check the Operation State Azure SQL Database exposes database-operation status using: sys.dm_operation_status This DMV reports operations such as ALTER and their state. Run the query from the logical server's master database: SELECT session_activity_id, major_resource_id AS database_name, operation, state_desc, percent_complete, start_time, last_modify_time, error_code, error_desc FROM sys.dm_operation_status ORDER BY start_time DESC; Possible states include: PENDING IN_PROGRESS COMPLETED FAILED CANCEL_IN_PROGRESS CANCELLED An important detail is that percent_complete shouldn't automatically be interpreted like a traditional progress bar. For many active operations: 50 = operation in progress and: 100 = operation complete Restore operations have more granular progress values. So: An ALTER operation remaining at 50% doesn't necessarily mean exactly half of the work is complete. 3. Build an Operation Timeline Capture: Scale request time. Requested service objective. Operation start time. Current state. last_modify_time. Cancellation request time, when applicable. Subsequent scale requests. Application impact. Database availability. Workload running during the operation. For example: Time Observation T0 Scale requested T1 Operation enters IN_PROGRESS T2 Transaction-log utilization rises T3 log_reuse_wait_desc reports REPLICATION T4 Cancellation requested T5 Operation still CANCEL_IN_PROGRESS This timeline establishes correlation. It doesn't yet establish causation. 4. Don't Keep Submitting Scale Requests When a scale or cancellation appears slow, avoid repeatedly submitting new modifications without understanding the state of the existing operation. Instead: Preserve the current operation ID. Record the operation state. Record timestamps. Capture current database workload. Investigate the transaction log. Investigate CDC independently. Escalate if the operation remains persistently unable to reach a terminal state. The goal is to reduce variables rather than introduce new ones. 5. Measure Transaction-Log Utilization Now move to the database being investigated. sys.dm_db_log_space_usage is supported in Azure SQL Database and reports how much transaction-log space is currently occupied. SELECT total_log_size_in_bytes / 1024.0 / 1024.0 AS total_log_size_mb, used_log_space_in_bytes / 1024.0 / 1024.0 AS used_log_space_mb, used_log_space_in_percent FROM sys.dm_db_log_space_usage; Capture this repeatedly. You're looking for a trend such as: T1 25% T2 41% T3 58% T4 73% T5 88% versus: T1 60% T2 63% T3 56% T4 61% T5 58% The first pattern suggests sustained net log growth. The second shows that log space is being reused. One snapshot can't tell you which behavior is occurring. 6. Ask Why the Log Can't Be Reused One of the most useful checks is: SELECT name, log_reuse_wait_desc FROM sys.databases WHERE database_id = DB_ID(); The value describes the current condition preventing transaction-log reuse. Microsoft also exposes the same concept through sys.dm_db_log_stats() as log_truncation_holdup_reason. A more complete diagnostic query is: SELECT database_id, total_log_size_mb, active_log_size_mb, total_vlf_count, active_vlf_count, log_truncation_holdup_reason, log_since_last_checkpoint_mb FROM sys.dm_db_log_stats(DB_ID()); sys.dm_db_log_stats() is documented as applicable to Azure SQL Database and returns summary-level information for diagnosing transaction-log health. 7. What Does REPLICATION Mean When CDC Is Enabled? This point requires careful interpretation. CDC uses the transaction log as the source for captured changes. Inserts, updates, and deletes are recorded in the transaction log before CDC processes those changes. Microsoft documents an important interaction: CDC is enabled. Transactions produce log records. CDC must capture relevant log information. Capture latency can hold back log truncation. log_reuse_wait_desc can consequently report REPLICATION. Therefore, if you see: REPLICATION in a CDC-enabled Azure SQL Database, CDC-related log processing is a legitimate investigation path. But don't jump from: "log_reuse_wait_desc = REPLICATION" to: "CDC caused the scaling operation to become stuck." That's a different claim requiring separate evidence. 8. Confirm Whether CDC Is Enabled Azure SQL Database exposes CDC status through sys.databases. SELECT name, is_cdc_enabled FROM sys.databases WHERE database_id = DB_ID(); If: is_cdc_enabled = 1 CDC is enabled for the database. Microsoft documents CDC support in Azure SQL Database and notes that the database must first be CDC-enabled before individual source tables can be tracked. 9. Inventory CDC Capture Instances Rather than using SQL Server Agent job queries, inspect Azure SQL Database CDC metadata. SELECT ct.capture_instance, OBJECT_SCHEMA_NAME(ct.source_object_id) AS source_schema, OBJECT_NAME(ct.source_object_id) AS source_table, ct.start_lsn, ct.create_date FROM cdc.change_tables AS ct ORDER BY source_schema, source_table; This helps answer: Which tables are tracked? How many capture instances exist? When were they created? Has the CDC scope changed recently? An important Azure SQL-specific detail is: Azure SQL Database doesn't depend on SQL Server Agent CDC capture and cleanup jobs. Instead, Azure SQL Database uses a built-in CDC scheduler that automatically runs capture and cleanup within the database. That distinction is critical when adapting SQL Server CDC troubleshooting procedures to Azure SQL Database. 10. Check Whether CDC Is Advancing A simple high-level check is: SELECT sys.fn_cdc_get_min_lsn( ct.capture_instance ) AS minimum_lsn, sys.fn_cdc_get_max_lsn() AS maximum_lsn, ct.capture_instance, OBJECT_SCHEMA_NAME(ct.source_object_id) AS source_schema, OBJECT_NAME(ct.source_object_id) AS source_table FROM cdc.change_tables AS ct; Take repeated samples. The objective isn't to derive a universal threshold. The objective is to determine whether the observable CDC boundary is: Advancing. Intermittently advancing. Apparently static over a meaningful period. Again: Trend matters more than a single snapshot. 11. Investigate Long-Running Transactions This is particularly important when CDC and log growth appear together. Microsoft specifically documents transaction-log growth scenarios involving CDC and long-running transactions. Start by examining database transactions: SELECT dt.transaction_id, dt.database_transaction_begin_time, dt.database_transaction_type, dt.database_transaction_state, dt.database_transaction_log_record_count, CAST ( dt.database_transaction_log_bytes_used / 1024.0 / 1024.0 AS decimal(18,2) ) AS log_mb_used, CAST ( dt.database_transaction_log_bytes_reserved / 1024.0 / 1024.0 AS decimal(18,2) ) AS log_mb_reserved FROM sys.dm_tran_database_transactions AS dt WHERE dt.database_id = DB_ID() ORDER BY dt.database_transaction_log_bytes_used DESC; sys.dm_tran_database_transactions is supported in Azure SQL Database and provides transaction-level database information, including transaction start time and log bytes consumed. 12. Connect Transactions Back to Sessions A transaction ID is useful, but identifying the application session makes it actionable. SELECT st.session_id, at.transaction_id, at.transaction_begin_time, at.transaction_type, at.transaction_state, dt.database_transaction_begin_time, CAST ( dt.database_transaction_log_bytes_used / 1024.0 / 1024.0 AS decimal(18,2) ) AS log_mb_used, s.login_name, s.host_name, s.program_name, r.status, r.command, r.wait_type, r.blocking_session_id FROM sys.dm_tran_session_transactions AS st JOIN sys.dm_tran_active_transactions AS at ON st.transaction_id = at.transaction_id JOIN sys.dm_tran_database_transactions AS dt ON st.transaction_id = dt.transaction_id LEFT JOIN sys.dm_exec_sessions AS s ON st.session_id = s.session_id LEFT JOIN sys.dm_exec_requests AS r ON st.session_id = r.session_id WHERE dt.database_id = DB_ID() ORDER BY at.transaction_begin_time; sys.dm_tran_active_transactions and sys.dm_tran_database_transactions are documented for Azure SQL Database. Look for: Very old transactions. Transactions consuming large amounts of log. Sleeping sessions with open transactions. Blocking. Large write activity. Don't terminate transactions merely because they're old. First determine: Which application owns them. Whether rollback would cause more impact. Whether they're expected. Whether they're actually contributing to the observed log condition. 13. Correlate With Log-Write Pressure Azure SQL Database also exposes recent transaction-log write utilization through: sys.dm_db_resource_stats It provides roughly one hour of resource history with approximately 15-second samples. SELECT TOP (240) end_time, avg_cpu_percent, avg_data_io_percent, avg_log_write_percent, avg_memory_usage_percent FROM sys.dm_db_resource_stats ORDER BY end_time DESC; Now correlate: Scale-operation start time. Log-space growth. log_reuse_wait_desc. CDC progression. Long-running transactions. avg_log_write_percent. This can reveal two very different scenarios. Scenario A Log is large. Log-write rate is currently modest. CDC continues advancing. No unusually long transaction is present. This weakens the hypothesis that current transaction-log pressure is the primary explanation for the ongoing scale behavior. Scenario B Log usage continually rises. REPLICATION remains the reuse wait. CDC progression appears delayed. Large transactions remain active. Log-write pressure is high. This strengthens the case for investigating the log/CDC workload further. It still doesn't prove CDC is blocking scaling. 14. Test Correlation Without Inventing Causation Build a timeline like this: Time Scale state Log used Reuse wait CDC progress Long transaction T1 IN_PROGRESS 45% NOTHING Advancing No T2 IN_PROGRESS 62% REPLICATION Slower Yes T3 IN_PROGRESS 78% REPLICATION Limited Yes T4 IN_PROGRESS 66% NOTHING Advancing No Then ask: Evidence supporting a relationship Problem begins at the same time. Log pressure remains sustained. CDC progression is materially delayed. Long transactions contribute substantial log activity. Reducing unnecessary write pressure produces measurable improvement. Evidence weakening the relationship CDC progresses normally. Log space is actively reused. Scale remains IN_PROGRESS despite normal log behavior. Scale problems occur independently of CDC pressure. Log pressure clears but operation state doesn't change. This distinction protects the investigation from a common mistake: Correlation is an investigation path, not proof of root cause. 15. Don't Disable CDC as a First Step Disabling CDC is a substantial configuration change. It can affect: ETL pipelines. Integration platforms. Analytics workloads. Incremental processing. Downstream synchronization. CDC history. Azure SQL Database provides documented procedures for enabling and disabling CDC, but those procedures should be used because changing CDC is an intentional design decision, not simply because a scale operation is taking longer than expected. Even if disabling CDC changes the symptom, that fact alone doesn't prove: CDC was the root cause. Other conditions may have changed simultaneously. 16. Use a Safe Mitigation Order When a scale operation, CDC, and transaction-log pressure overlap, consider this sequence. Step 1: Stop introducing new variables Avoid repeatedly submitting duplicate or conflicting scale operations. Step 2: Preserve operation evidence Capture: Operation ID. Start time. State. Last modification time. Errors. Step 3: Measure log health Capture: Log size. Used log percentage. Truncation holdup reason. Trend over time. Step 4: Validate CDC Confirm: CDC enabled. Tracked tables. CDC progression. Recent CDC configuration changes. Step 5: Investigate long-running transactions Determine: Age. Session. Application owner. Log consumption. Business impact of intervention. Step 6: Reduce avoidable write pressure When operationally safe, reduce nonessential: Bulk updates. Large batches. ETL writes. Maintenance jobs. Excessive write concurrency. Step 7: Treat CDC changes as controlled interventions Only disable CDC when: Downstream impact is understood. The change is justified. The recovery/reinitialization path is understood. Evidence supports testing it. 17. Validate Recovery Don't stop when the scale operation finally completes. Confirm all layers. Scale operation Verify that the operation reached: COMPLETED FAILED CANCELLED rather than remaining indefinitely in an intermediate state. Transaction log Verify: Log usage stabilizes. Log reuse resumes. log_truncation_holdup_reason changes appropriately. CDC Verify: Change capture continues. Expected tracked tables remain enabled. Downstream consumers remain healthy. Application Verify: Connections recover. Workload resumes normally. No unexpected backlog remains. 18. Know When to Escalate Escalation becomes appropriate when you've established that: The scale or cancellation operation remains persistently nonterminal. No meaningful state changes are occurring. Database workload evidence has been captured. Log health is understood. CDC status is documented. Long transactions have been investigated. Business impact continues. Microsoft provides sys.dm_operation_status specifically for monitoring operations performed on Azure SQL databases, including pending, in-progress, failed, cancellation-in-progress, and canceled states. A useful escalation package includes: Sanitized operation history. Service objective before and after the requested scale. sys.dm_operation_status evidence. Log-space trend. log_truncation_holdup_reason. CDC state. CDC progress observations. Long-running transaction evidence. Resource metrics. Mitigations attempted and their results. Remaining application/business impact. 19. Practical Decision Tree When an Azure SQL scale operation appears stuck: Is the operation still nonterminal? No Validate workload, CDC, and log health. Continue monitoring. Yes Record its state and timeline. Is the transaction log under sustained pressure? No Don't make CDC the primary hypothesis solely because it's enabled. Yes Continue. What is preventing log reuse? ACTIVE_TRANSACTION Investigate long-running transactions. REPLICATION with CDC enabled Investigate CDC progress and transaction activity. Another value Investigate that truncation holdup independently. Is CDC demonstrating progress? Yes A completely stalled CDC process becomes a weaker hypothesis. Continue investigating log generation and the scale operation separately. No, or inconclusive Gather repeated samples. Check transactions and workload pressure. Did log pressure resolve while scaling remained stuck? Yes The evidence weakens the hypothesis that log/CDC pressure alone explains the operation. No Continue correlation and consider escalation. Final Takeaway When Azure SQL scaling, CDC, and transaction-log pressure happen together, don't begin with: "CDC blocked the scale operation." Begin with four independent questions: What is the actual state of the scale operation? Is the transaction log genuinely under sustained pressure? Why is log reuse being delayed? Is CDC demonstrating forward progress? Azure SQL Database provides documented tools for each layer: sys.dm_operation_status for operation state. sys.dm_db_log_space_usage for log-space utilization. sys.dm_db_log_stats() for transaction-log health and truncation holdup. sys.dm_tran_database_transactions for transaction/log consumption. sys.dm_db_resource_stats for recent CPU, I/O, and log-write pressure. Azure SQL Database's built-in CDC scheduler and CDC metadata for capture investigation. Most importantly: Don't disable CDC just because two symptoms occurred together. Preserve evidence, reduce unnecessary workload pressure, address demonstrated transaction problems, and escalate persistent nonterminal scaling operations with a clear timeline. Because: The safest diagnosis separates correlation from causation before changing the workload. Further reading Change Data Capture (CDC) with Azure SQL Database Scale single database resources in Azure SQL Database sys.dm_operation_status sys.dm_db_log_space_usage sys.dm_db_log_stats Transaction log growth with long-running transactions and CDC126Views0likes0CommentsWhen Change Tracking Cleanup Falls Behind: A Safe Playbook for Azure SQL
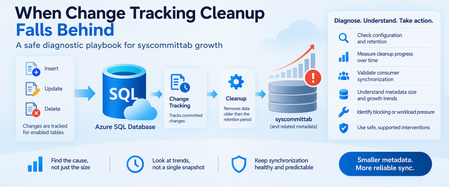
A growing Change Tracking table is a symptom. The useful question is whether cleanup is slow, blocked, or behaving as configured. Change Tracking is a lightweight mechanism for applications that need to determine which rows have changed without building a custom tracking framework. Azure SQL Database supports Change Tracking, including its built-in background cleanup mechanism. Track Data Changes But in long-running or high-change-rate environments, you may eventually encounter a different question: Why does Change Tracking metadata continue to grow? Possible explanations include: The observed growth is still within the configured retention window. Cleanup is progressing, but slower than new changes are arriving. Cleanup isn't making meaningful progress. The workload has changed substantially. A synchronization consumer has fallen behind. A long-running workload requires further investigation. The situation requires Azure support investigation. The important lesson is simple: Don't start by deleting Change Tracking metadata. Start by measuring it. 1. Understand the Change Tracking Contract Change Tracking records committed inserts, updates, and deletes for enabled tables. Applications typically maintain a synchronization version and later ask Azure SQL Database which rows changed after that version. Change Tracking Functions Three concepts are particularly important. Current version SELECT CHANGE_TRACKING_CURRENT_VERSION() AS current_version; CHANGE_TRACKING_CURRENT_VERSION() returns a version associated with the last committed transaction. An application can preserve this version and subsequently use it when enumerating changes. Change Tracking Functions Minimum valid version For individual tracked tables: SELECT s.name AS schema_name, t.name AS table_name, CHANGE_TRACKING_MIN_VALID_VERSION(t.object_id) AS min_valid_version FROM sys.tables AS t JOIN sys.schemas AS s ON t.schema_id = s.schema_id JOIN sys.change_tracking_tables AS ct ON t.object_id = ct.object_id ORDER BY s.name, t.name; The minimum valid version defines how far back a consumer can safely request changes. If the consumer's saved version falls below the minimum valid version, a subsequent CHANGETABLE result might no longer contain the complete change history the consumer expects. CHANGE_TRACKING_MIN_VALID_VERSION Retention The database's retention setting defines how long Change Tracking information should be retained before becoming eligible for cleanup. That's important because: Retention is not the same thing as a synchronization schedule. A consumer must synchronize frequently enough that its saved version doesn't fall behind the minimum valid version. 2. Start With the Configuration Before investigating cleanup, verify that Change Tracking is configured the way you think it is. SELECT DB_NAME(database_id) AS database_name, is_auto_cleanup_on, retention_period, retention_period_units_desc FROM sys.change_tracking_databases WHERE database_id = DB_ID(); Check: Is Change Tracking enabled? Is automatic cleanup enabled? What is the retention period? Does the retention period match the application's synchronization expectations? Microsoft documents sys.change_tracking_databases as one of the catalog views used to determine databases where Change Tracking is enabled. Manage Change Tracking If cleanup was intentionally disabled, metadata growth has a very different explanation than an environment where automatic cleanup is enabled. 3. Inventory Every Change-Tracked Table Next, understand the scope. SELECT s.name AS schema_name, t.name AS table_name, ct.is_track_columns_updated_on, ct.begin_version, ct.cleanup_version, ct.min_valid_version FROM sys.change_tracking_tables AS ct JOIN sys.tables AS t ON ct.object_id = t.object_id JOIN sys.schemas AS s ON t.schema_id = s.schema_id ORDER BY s.name, t.name; sys.change_tracking_tables returns one row for each Change Tracking-enabled table in the current database and exposes several useful diagnostic columns. sys.change_tracking_tables In particular: begin_version Represents the database version associated with the beginning of Change Tracking for the table. cleanup_version Represents the version up to which cleanup might have removed Change Tracking information. min_valid_version Represents the minimum Change Tracking version that's still valid for synchronization. sys.change_tracking_tables This immediately establishes: How many tables are tracked. Which tables started tracking at different points. Whether cleanup-related metadata differs significantly across tables. Whether your investigation affects one table or the entire database. 4. Capture Current and Minimum Valid Versions Together For a concise health snapshot: SELECT s.name AS schema_name, t.name AS table_name, CHANGE_TRACKING_CURRENT_VERSION() AS current_version, ct.begin_version, ct.cleanup_version, CHANGE_TRACKING_MIN_VALID_VERSION(t.object_id) AS min_valid_version FROM sys.change_tracking_tables AS ct JOIN sys.tables AS t ON ct.object_id = t.object_id JOIN sys.schemas AS s ON t.schema_id = s.schema_id ORDER BY s.name, t.name; This isn't a complete cleanup-health metric by itself. Instead, use it to understand how the Change Tracking version boundaries evolve over time. The key is: One snapshot isn't enough. A single sample can make healthy cleanup appear stuck, and a temporary movement can make an unhealthy trend look normal. 5. Measure Progress Over Time A better investigation takes repeated observations. For example: Sample Current Version Minimum Valid Version Cleanup Version T1 850000 710000 709900 T2 870000 728000 727900 T3 892000 746000 745900 These are synthetic values, but they demonstrate the important question. Ask: Are the boundaries moving forward over time? If yes: Cleanup is demonstrating progress. The next question is whether that progress is sufficient relative to the workload and retention expectations. If no: Extend the observation window. Validate configuration. Check workload conditions. Determine whether the lack of progress is persistent. Do not diagnose cleanup failure from a single observation. 6. Monitor Change Tracking Storage Safely Microsoft documents that Change Tracking creates internal tables, and sys.internal_tables can be used to identify those objects. Manage Change Tracking For investigation, you can inventory Change Tracking internal objects without modifying them: SELECT it.object_id, it.name AS internal_table_name, it.internal_type_desc, OBJECT_SCHEMA_NAME(it.parent_object_id) AS parent_schema_name, OBJECT_NAME(it.parent_object_id) AS parent_table_name FROM sys.internal_tables AS it WHERE it.internal_type_desc LIKE '%CHANGE_TRACKING%' ORDER BY parent_schema_name, parent_table_name; This is a diagnostic inventory. Do not: Delete rows directly from internal tables. Modify internal-table schema. Create unsupported indexes on internal objects. Treat internal Change Tracking tables like customer-owned tables. Microsoft explicitly documents that sys.internal_tables lists the internal objects created when Change Tracking is enabled. Manage Change Tracking 7. Estimate the Storage Footprint If you need to understand whether Change Tracking storage is increasing, combine the documented internal-table catalog metadata with partition statistics for measurement. SELECT it.name AS internal_table_name, OBJECT_SCHEMA_NAME(it.parent_object_id) AS parent_schema_name, OBJECT_NAME(it.parent_object_id) AS parent_table_name, SUM(ps.row_count) AS approximate_rows, CAST ( SUM(ps.reserved_page_count) * 8.0 / 1024 AS decimal(18,2) ) AS reserved_mb, CAST ( SUM(ps.used_page_count) * 8.0 / 1024 AS decimal(18,2) ) AS used_mb FROM sys.internal_tables AS it JOIN sys.dm_db_partition_stats AS ps ON it.object_id = ps.object_id WHERE it.internal_type_desc LIKE '%CHANGE_TRACKING%' GROUP BY it.name, it.parent_object_id ORDER BY reserved_mb DESC; Use this as a measurement query only. The most useful information isn't usually the absolute number. It's the trend: T1 → 800 MB T2 → 900 MB T3 → 1,050 MB T4 → 1,220 MB versus: T1 → 800 MB T2 → 820 MB T3 → 790 MB T4 → 810 MB The first pattern suggests sustained net growth. The second could simply reflect normal accumulation and cleanup behavior. 8. Validate the Synchronization Consumer Cleanup health is only half of the story. You must also protect the consumer's synchronization contract. Imagine an application stores its last synchronized Change Tracking version: DECLARE @last_sync_version bigint = 700000; DECLARE @table_id int = OBJECT_ID(N'dbo.SampleTable'); DECLARE Min_valid_version bigint = CHANGE_TRACKING_MIN_VALID_VERSION(@table_id); SELECT @last_sync_version AS last_sync_version, Min_valid_version AS min_valid_version, CASE WHEN Min_valid_version IS NULL THEN N'Unable to validate' WHEN @last_sync_version < Min_valid_version THEN N'Reinitialization required' ELSE N'Incremental synchronization valid' END AS sync_status; Microsoft specifically recommends validating a saved synchronization version against CHANGE_TRACKING_MIN_VALID_VERSION(). If last_sync_version is lower than the minimum valid version, subsequent CHANGETABLE results might not be valid for the intended synchronization. CHANGE_TRACKING_MIN_VALID_VERSION That's why simply shortening retention to reduce storage isn't necessarily harmless. You may create a different problem: Consumers can fall outside the valid synchronization window. 9. Use the Safe Change Enumeration Pattern Once the consumer's saved version is known to be valid, it can request subsequent changes. For example: DECLARE @last_sync_version bigint = 700000; SELECT CT.SampleID, CT.SYS_CHANGE_VERSION, CT.SYS_CHANGE_CREATION_VERSION, CT.SYS_CHANGE_OPERATION FROM CHANGETABLE ( CHANGES dbo.SampleTable, @last_sync_version ) AS CT; CHANGETABLE(CHANGES...) returns Change Tracking information for changes that occurred since the supplied version. Change Tracking Functions But validate first: DECLARE @last_sync_version bigint = 700000; DECLARE Min_valid_version bigint = CHANGE_TRACKING_MIN_VALID_VERSION ( OBJECT_ID(N'dbo.SampleTable') ); IF Min_valid_version IS NULL BEGIN THROW 50001, 'Unable to validate the Change Tracking version.', 1; END; IF @last_sync_version < Min_valid_version BEGIN THROW 50002, 'Saved synchronization version is no longer valid. Reinitialization is required.', 1; END; SELECT CT.SampleID, CT.SYS_CHANGE_VERSION, CT.SYS_CHANGE_CREATION_VERSION, CT.SYS_CHANGE_OPERATION FROM CHANGETABLE ( CHANGES dbo.SampleTable, @last_sync_version ) AS CT; This is much safer than assuming a consumer can request changes indefinitely. 10. Don't Confuse Consumer Lag With Cleanup Failure Suppose: Auto-cleanup is enabled. Cleanup versions are moving forward. Internal-table size fluctuates. A synchronization consumer hasn't run for longer than the retention window. Then the consumer's failure doesn't automatically mean cleanup malfunctioned. Cleanup may have behaved exactly as configured. The real issue may be: The consumer failed to synchronize within the retention contract. This distinction is important because increasing cleanup aggression wouldn't solve that problem. Instead, investigate: Synchronization frequency. Retention configuration. Consumer outages. Failed synchronization jobs. Whether the retention period reasonably accommodates normal recovery time. 11. Slow Cleanup and Blocked Cleanup Aren't the Same Consider three possible behaviors. Pattern A: Progressing normally You observe: Auto-cleanup enabled. Minimum valid versions advancing. Cleanup versions advancing. Storage fluctuating around a range. Consumers healthy. Interpretation: No evidence of a persistent cleanup failure. Pattern B: Progressing but falling behind You observe: Cleanup versions advance. Minimum valid versions advance. Change Tracking storage nonetheless grows over repeated observations. Interpretation: Cleanup appears to be making progress. Net Change Tracking generation may be exceeding cleanup throughput during the observation period. More investigation is warranted. Pattern C: Persistently no observable progress You observe over an appropriate period: Auto-cleanup enabled. Significant stale metadata is expected based on retention. Cleanup version doesn't materially advance. Storage continues growing. The behavior persists. Interpretation: A sustained cleanup backlog becomes a stronger hypothesis. Gather evidence before intervention. Escalation may be appropriate. 12. Check the Workload Before Blaming Cleanup Change Tracking operates alongside your application workload. Consider whether anything changed recently: More tracked tables? Higher DML rates? Larger transaction volumes? More databases using Change Tracking? New bulk workloads? Changes to synchronization frequency? Change Tracking enabled on high-churn tables? Increased contention or long-running operations? Change Tracking adds synchronous work to DML and uses a background cleanup mechanism for stale tracking information. Track Data Changes Therefore, a meaningful diagnosis should correlate metadata growth with: Change rate. Database workload. Cleanup progress. Retention. Consumer behavior. 13. Be Careful With Long-Running Transactions Change Tracking records changes on the basis of committed transactions. Microsoft specifically notes that its ordering is based on transaction commit time, allowing reliable behavior when transactions overlap or run for extended periods. Track Data Changes If you're investigating unusual cleanup timing, long-running workload activity deserves consideration. For currently active database transactions: SELECT s.session_id, r.status, r.command, r.start_time, r.total_elapsed_time, r.cpu_time, r.wait_type, r.wait_time, r.blocking_session_id FROM sys.dm_exec_sessions AS s JOIN sys.dm_exec_requests AS r ON s.session_id = r.session_id WHERE s.is_user_process = 1 AND r.database_id = DB_ID() ORDER BY r.total_elapsed_time DESC; Don't automatically conclude that a long-running request blocks Change Tracking cleanup. Instead, treat the workload evidence as another variable to correlate with cleanup behavior. 14. Use a Safe Intervention Hierarchy When metadata growth becomes concerning, resist the temptation to modify system objects. Use this order instead. Step 1: Confirm configuration Check: Change Tracking enabled. Retention. Auto-cleanup. Enabled tables. Step 2: Validate consumers Check: Last synchronization version. Minimum valid version. Synchronization frequency. Failed synchronization jobs. Step 3: Establish a trend Record over time: Current version. Minimum valid version. Cleanup version. Internal storage estimate. Step 4: Check workload changes Correlate: DML volume. Concurrent workload. Long-running operations. Newly tracked tables. Step 5: Reduce avoidable pressure If the workload itself changed, investigate it before assuming an engine defect. Step 6: Use only documented management mechanisms Avoid direct manipulation of Change Tracking internal objects. Step 7: Escalate when evidence shows a persistent backlog Provide: Configuration. Trend measurements. Tracked-table inventory. Version progression. Storage trend. Relevant workload timeline. Consumer status. That creates a much stronger support package than: "syscommittab is large." 15. Validate Recovery Suppose configuration or workload changes are made. Don't validate recovery with one query. Observe an appropriate workload cycle and compare: Metadata size trend. cleanup_version. Minimum valid version. Current version. Consumer synchronization success. Change Tracking-related errors. Workload rate. The desired outcome isn't necessarily: Change Tracking storage becomes tiny. The useful outcome is: Cleanup demonstrates sustainable progress, metadata growth stabilizes relative to workload, and consumers remain inside their valid synchronization window. 16. Prevent the Problem From Returning A healthy Change Tracking deployment needs operational monitoring. Consider tracking: Configuration health Is automatic cleanup enabled? Did retention change? Were new tables added? Cleanup trend Are cleanup versions advancing? Are minimum valid versions advancing? Is metadata storage continuously growing? Consumer health When did each consumer last synchronize? How close is its saved version to the minimum valid version? Are synchronization jobs failing? Workload health Has the write rate changed? Have new bulk workloads appeared? Has database scale changed substantially? The most useful alerts often focus on trend and synchronization safety, not simply: "syscommittab exceeded X GB." Absolute size tells you very little without workload and cleanup context. 17. A Practical Diagnostic Decision Table Observation Interpretation Next step Auto-cleanup disabled Configuration explains lack of automatic cleanup Confirm whether intentional Consumer version below minimum valid version Consumer fell outside valid window Reinitialize according to application design Cleanup versions advancing Cleanup demonstrating progress Continue trend analysis Versions advancing but storage growing Creation may exceed cleanup during observation Correlate workload and change rate No version movement in one snapshot Inconclusive Collect repeated samples Persistent lack of progress + sustained growth Cleanup backlog becomes plausible Gather escalation evidence Storage fluctuates but remains broadly stable Could represent normal operation Continue monitoring Consumer repeatedly approaches minimum valid version Retention/sync schedule may be misaligned Review synchronization design Final Takeaway When Change Tracking metadata grows, don't start with: "How do I delete syscommittab?" Start with: "Is cleanup progressing, is the workload outpacing it, or is the system behaving exactly as configured?" Azure SQL Database provides documented interfaces that let you answer much of that safely: sys.change_tracking_databases sys.change_tracking_tables CHANGE_TRACKING_CURRENT_VERSION() CHANGE_TRACKING_MIN_VALID_VERSION() CHANGETABLE sys.internal_tables for inventory and diagnostic observation Microsoft documents Change Tracking as having a built-in automatic cleanup mechanism and exposes catalog views and functions for managing and consuming its metadata. Track Data Changes Manage Change Tracking The most reliable investigation follows a simple sequence: Confirm configuration. Inventory tracked tables. Validate synchronization consumers. Measure version progression over time. Measure storage as a trend. Correlate growth with workload. Avoid direct system-object manipulation. Escalate with evidence when progress persistently stalls. Most importantly: Don't modify Change Tracking internal tables directly. Those objects are implementation details owned by the database engine. Observe them when documented metadata makes that appropriate, but manage Change Tracking through supported, documented interfaces. Because with Change Tracking cleanup: One snapshot tells you the size. A trend tells you the story. Further reading Track Data Changes About Change Tracking Manage Change Tracking sys.change_tracking_tables CHANGE_TRACKING_MIN_VALID_VERSION Change Tracking Functions123Views0likes0CommentsSeconds of Downtime, Hours of Confusion: Handling Transient Azure SQL Disconnects
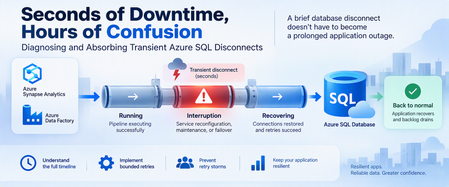
A database can recover in seconds while an application remains unavailable for much longer. Brief connectivity interruptions are expected failure modes that cloud applications should be designed to tolerate. With Azure SQL Database, transient connectivity errors can occur during short-lived service reconfiguration events. Microsoft notes that many such reconfiguration events complete in less than 60 seconds and recommends that applications implement retry logic rather than immediately surfacing transient failures to users. But the database interruption is only part of the story. An application might continue experiencing problems because of: Failed connections. Lost in-flight operations. Retry behavior. Connection-pool recovery. Authentication or token issues. Queued requests. Application instances retrying simultaneously. Backlogs that must drain after connectivity returns. This leads to an important troubleshooting principle: Database recovery and application recovery are separate milestones. Understanding that difference can turn a confusing availability incident into a defensible timeline and, more importantly, a more resilient application design. 1. Transient Does Not Mean Harmless A transient interruption is temporary, but its application impact doesn't have to be. Consider a simplified timeline: Time Event T0 Application healthy T1 Database connectivity is interrupted T2 Database connectivity becomes available again T3 Applications reconnect T4 Request backlog begins draining T5 Application returns to normal The actual database connectivity event is: T1 → T2 But users might experience impact across: T1 → T5 Calling the entire T1-to-T5 period a continuous database outage would be inaccurate unless evidence proves that the database itself remained unavailable. Instead, investigate the periods separately. 2. Build a Three-Layer Timeline A good post-incident investigation should correlate three timelines. Layer 1: Database/connectivity behavior Capture: Connection failures. Successful reconnections. Relevant Azure monitoring signals. Azure Service Health information when applicable. Database resource behavior. Layer 2: Client connectivity Capture: SQL exception number. Exception timestamp in UTC. Connection timeout. Retry attempts. Retry delays. Authentication failures. Network errors. Azure SQL troubleshooting guidance recommends logging failure timestamps and notes that SQL Database can return tracing information helpful during connectivity investigations. Layer 3: Application recovery Capture: Application health. Request failures. Queue depth. Retry volume. Connection-pool recovery. Backlog drain time. Time when users actually recovered. The timelines might reveal: Database connectivity restored │ ▼ Applications reconnect │ ▼ Backlog continues │ ▼ Application fully recovered That distinction is essential. 3. Classify the Failure Before Retrying It Not every SQL connectivity error means the same thing. Classify the symptom into categories such as: Transient availability/connectivity failure. Authentication failure. Token-related failure. Network-path problem. DNS problem. Firewall/configuration issue. Resource-governance condition. Application timeout. Long application recovery after SQL connectivity returns. Azure SQL Database documents multiple connectivity failure categories, including transient fault errors such as 40197 and 40613, authentication failures such as 18456, network termination conditions, firewall issues, and connection timeouts. The classification matters because: Not every failure should be retried in the same way. 4. Use Azure SQL Connectivity History Carefully Azure SQL Database exposes connectivity-event information through system views in the logical server's master database. One useful view is: sys.database_connection_stats It provides aggregated connection success and failure information in five-minute intervals. Connect to the logical server's master database and run: DECLARE @StartTime datetime2 = DATEADD(HOUR, -2, SYSUTCDATETIME()); SELECT database_name, start_time, end_time, success_count, total_failure_count, connection_failure_count FROM sys.database_connection_stats WHERE start_time >= @StartTime ORDER BY start_time DESC; This can help answer: Did connection failures occur? Which database was affected? In which five-minute interval? Were successful connections also occurring? But there's an important limitation. This is aggregated historical information, not a second-by-second outage trace. The data can also arrive later, with Microsoft documenting that it can take up to 24 hours for all information to appear. Therefore, don't use one five-minute bucket containing failures to claim: "The database was unavailable for five minutes." The evidence only tells you connection failures were recorded during that interval. 5. Look Deeper With sys.event_log For additional connectivity-event information, Azure SQL Database exposes: sys.event_log This view records successful database connections and connection failures and is intended to help track and troubleshoot Azure SQL Database connectivity activity. Again, connect to master. DECLARE @StartTime datetime2 = DATEADD(HOUR, -2, SYSUTCDATETIME()); SELECT database_name, start_time, end_time, event_category, event_type, event_subtype, event_subtype_desc, severity, event_count, description FROM sys.event_log WHERE start_time >= @StartTime AND event_category = N'connectivity' ORDER BY start_time DESC; Useful columns include: start_time end_time event_category event_type event_subtype_desc severity event_count description Microsoft cautions that querying sys.event_log can consume significant resources on logical servers with many databases or high login volumes, so keep the time range and other filters appropriately narrow. 6. Correlate SQL Evidence With Application Errors Now correlate the Azure SQL evidence with client telemetry. For every important application-side SQL exception, capture: UTC timestamp. SQL error number. Error message. Application instance. Operation. Retry attempt. Retry delay. Final outcome. Correlation or request ID when available. For example: UTC Layer Observation 10:00:02 Application SQL connection exception 10:00:04 Application Retry 1 fails 10:00:08 Application Retry 2 fails 10:00:15 SQL Connectivity succeeds 10:00:18 Application New connection succeeds 10:01:30 Application Queue still processing 10:05:00 Application Normal service restored Now you can separate: Connectivity interruption. Reconnection period. Application recovery period. That's substantially more useful than describing the full period as: "SQL was down." 7. Understand Connectivity and Reconfiguration Applications connect to the Azure SQL Database gateway, after which traffic is handled according to the effective connection policy and directed to the appropriate database environment. In a managed database service, applications must be designed for transient connectivity interruption. Microsoft specifically describes transient faults as conditions whose underlying cause resolves itself and notes that service reconfiguration can temporarily affect database connectivity. The application therefore shouldn't depend on one connection remaining valid indefinitely. Design for: Connections occasionally being terminated. New connection attempts occasionally failing. In-flight work requiring recovery. DNS and network paths needing to remain correctly configured. Authentication credentials or tokens remaining valid. Retry behavior that allows the system time to recover. Avoid guessing at undocumented platform internals when investigating an event. If evidence establishes only: "Connections failed briefly." Don't convert that into an unsupported explanation of why the platform changed state. 8. Retry Smartly, Not Aggressively Retry logic is essential for cloud applications that connect to Azure SQL Database. Microsoft explicitly recommends retry logic for transient connection failures. But a retry strategy needs boundaries. A good strategy considers: Number of attempts. Delay between attempts. Increasing delay. Random jitter. Maximum interval. Total retry budget. Whether the operation can safely be repeated. A bad strategy looks like: Failure ↓ Retry immediately ↓ Failure ↓ Retry immediately ↓ Failure ↓ Retry immediately... Across hundreds of application instances, this behavior can make recovery harder. A better pattern is: Failure ↓ Wait + jitter ↓ Retry ↓ Longer wait + jitter ↓ Retry ↓ Stop after bounded attempts 9. Use Microsoft.Data.SqlClient Retry Logic For .NET applications using Microsoft.Data.SqlClient, configurable retry logic is available in version 3.0 and later. Microsoft documents providers for configuring connection and command retries. A connection retry provider can be configured like this: var options = new SqlRetryLogicOption() { NumberOfTries = 5, DeltaTime = TimeSpan.FromSeconds(1), MaxTimeInterval = TimeSpan.FromSeconds(20) }; SqlRetryLogicBaseProvider provider = SqlConfigurableRetryFactory.CreateExponentialRetryProvider(options); using var connection = new SqlConnection(connectionString); connection.RetryLogicProvider = provider; connection.Open(); With this configuration: NumberOfTries = 5 Allows one initial attempt and up to four retries. DeltaTime Influences the delay between attempts. MaxTimeInterval Caps an individual retry delay. The exponential provider adds randomized jitter to retry intervals. The actual values should be tested against your application's: Latency requirements. Failure budget. Traffic volume. Concurrency. User experience. They're not universal service recommendations. 10. Connection Retry and Command Retry Are Different This is one of the most important resiliency distinctions. Suppose this fails: connection.Open(); Retrying the connection after an appropriate delay is generally straightforward for a transient connection condition. But suppose this fails: UPDATE dbo.Orders SET ProcessingStatus = N'Completed' WHERE OrderID = @OrderID; The application now has a harder question: Did the UPDATE execute before the connection was lost? Blindly repeating the command isn't always safe. Microsoft's Azure SQL guidance recommends establishing a fresh connection after a transient command failure before retrying, and retry logic must correctly account for the transaction's outcome. 11. Idempotency Matters Different operations require different retry treatment. Read-only operation For example: SELECT OrderID, ProcessingStatus FROM dbo.Orders WHERE OrderID = @OrderID; Repeating a read is often relatively straightforward, subject to your application's consistency requirements. Update operation For example: UPDATE dbo.Orders SET ProcessingStatus = N'Completed' WHERE OrderID = @OrderID; The client must determine whether repeating this operation is safe. Insert operation Consider: INSERT dbo.PaymentRequests ( RequestID, AccountID, Amount ) VALUES ( @RequestID, @AccountID, @Amount ); If the connection disappears after the server commits but before the client receives confirmation, an unconditional retry could create duplicate business activity unless the application and schema provide an idempotency mechanism. For example, a unique request identifier can make duplicate detection possible. The important principle is: Retryability is a business-operation property, not simply a SQL error property. 12. Transactions Need Special Treatment Be particularly careful with multi-statement transactions. Consider: BEGIN TRANSACTION; UPDATE dbo.Inventory SET Quantity = Quantity - @Quantity WHERE ProductID = @ProductID; INSERT dbo.ShipmentQueue ( RequestID, ProductID, Quantity ) VALUES ( @RequestID, @ProductID, @Quantity ); COMMIT TRANSACTION; If connectivity is interrupted, don't simply reconnect and retry the last statement. Your application needs a strategy that protects the integrity of the entire unit of work. Microsoft's retry documentation specifically cautions that if a transient failure invalidates an active transaction, the application should retry the entire transaction rather than only the failed statement. 13. Prevent the Retry Storm Imagine 500 application instances lose connectivity simultaneously. If every instance retries immediately: 500 requests fail ↓ 500 immediately retry ↓ Another synchronized wave ↓ Another synchronized wave Recovery traffic itself can become disruptive. Exponential backoff with jitter helps spread retries across time instead of concentrating them into synchronized bursts. The configurable retry provider in Microsoft.Data.SqlClient supports exponential retry behavior with randomized jitter. Also consider application-level resilience mechanisms such as: Circuit breakers. Back-pressure. Queueing. Controlled concurrency. Connection-pool recovery. Rate limiting. Load shedding where appropriate. The objective isn't: "Retry until SQL succeeds." It's: Recover gracefully without creating a second problem. 14. Don't Ignore the Network Path Not every SQL connection failure originates from the database. Azure SQL Database connectivity includes several components between the application and database, with connection behavior also influenced by the configured connection policy. Troubleshooting may need to include: DNS. Firewall configuration. Private endpoints. Network security rules. Client outbound connectivity. Connection policy. Authentication. Application host health. Azure SQL supports Redirect, Proxy, and Default connection-policy configurations depending on the environment and configuration. In Redirect mode, clients establish connections directly to the node hosting the database after the initial gateway interaction, which requires appropriate network access. This is another reason not to classify every connection exception as: "Azure SQL outage." 15. Test Resiliency Before an Incident Don't wait for a real platform event to discover whether your application's recovery logic works. Test controlled failure scenarios involving: New connections. Existing connections. Read-only requests. Writes. Multi-statement transactions. Multiple application instances. Queued workloads. Connection pools. Measure: Time to detect failure. First retry delay. Number of attempts. Time to establish a new connection. Failed user requests. Queue growth. Queue drain time. Full application recovery. The real success metric isn't merely: "Can I connect to the database again?" It's: "How quickly can the application return to normal service without compromising correctness?" 16. Write a Defensible Post-Incident Report A strong post-incident report separates facts, inferences, and unknowns. Confirmed facts Examples: Client connection failures were recorded during a specific UTC interval. Successful connections later resumed. Certain client instances continued failing after initial connectivity returned. Application backlog persisted beyond the connectivity event. Retry activity increased during recovery. Supported inference Example: Aggressive retry behavior likely contributed to slower application recovery. Use this classification only when application telemetry supports the relationship. Unknowns Examples: The exact internal platform operation responsible for a transient event. Whether an unrelated network event contributed. Whether a capacity change affected recovery. Don't fill gaps in telemetry with assumptions. 17. A Practical Decision Tree When an application reports an Azure SQL connectivity incident: 1. Is the database reachable now? No Check current Azure status and application connectivity. Validate networking, DNS, firewall, authentication, and Azure SQL availability. Yes Continue reconstructing the historical incident. 2. Did Azure SQL record connection failures? Yes Correlate: sys.event_log. sys.database_connection_stats. Application timestamps. Azure monitoring evidence. No or evidence isn't yet available Continue investigating application and network telemetry. Remember that historical connectivity data can arrive later. 3. Did the application retry? No Implement a bounded transient-fault handling strategy. Yes Evaluate: Retry count. Delay. Backoff. Jitter. Error classification. 4. Did many instances retry simultaneously? Yes Investigate: Retry synchronization. Circuit breaking. Back-pressure. Queue recovery. Connection pools. 5. Were writes or transactions interrupted? Yes Validate: Transaction outcome. Idempotency. Duplicate prevention. Whole-transaction retry behavior. 6. Did the application remain unhealthy after connections succeeded? Yes Measure application recovery separately from the original database connectivity event. Final Takeaway The hardest part of a transient Azure SQL event isn't always the interruption itself. Sometimes it's the application's response. A resilient architecture recognizes three separate timelines: Connectivity interruption Database/connectivity recovery Application recovery Azure SQL Database is designed as a cloud service where applications should expect and tolerate transient connectivity conditions. Microsoft recommends implementing retry logic rather than exposing appropriate transient failures directly to users. But resilient retry logic must be: Bounded. Delayed. Appropriately randomized. Error-aware. Transaction-aware. Idempotency-aware. Observable. And post-incident analysis should distinguish: What is confirmed. What is inferred. What remains unknown. Because: A brief database disconnect doesn't have to become a prolonged application outage. The objective isn't to design an application that never experiences a disconnected connection. The objective is to design an application that absorbs the interruption, recovers safely, and returns to normal operation predictably. Further reading Working with Transient Errors in Azure SQL Database Troubleshoot Common Connection Issues in Azure SQL Configure Retry Logic in Microsoft.Data.SqlClient Azure SQL Database Connectivity Architecture sys.event_log for Azure SQL Database sys.database_connection_stats for Azure SQL Database130Views0likes0CommentsThe Pipeline Is Slow, or Is SQL Waiting? Diagnosing Synapse-to-Azure SQL Regressions
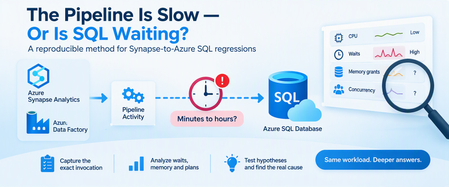
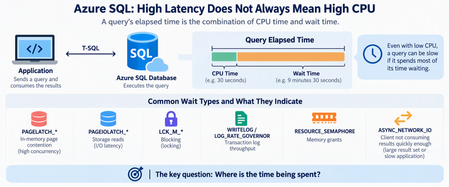
A query can consume very little CPU and still keep a pipeline waiting for hours. A pipeline activity that normally finishes in minutes suddenly starts taking hours. Nothing obvious has changed: The pipeline definition looks the same. The stored procedure looks the same. Azure SQL Database isn't showing sustained high CPU. Pipeline monitoring still points toward the SQL activity. At this point, saying "SQL is slow" isn't enough. The request may actually be: Executing expensive work. Waiting for memory. Blocked by another transaction. Reading more data than before. Running with a different execution plan. Competing with concurrent pipeline activities. Experiencing different cardinality because of different parameter values. The key is to connect the pipeline invocation to the database execution and determine where elapsed time is really going. 1. Define the Regression Precisely Before troubleshooting SQL, establish what actually changed. Capture: Expected pipeline duration. Observed pipeline duration. Pipeline activity involved. Stored procedure or statement invoked. Exact parameter values. Affected and unaffected executions. Pipeline concurrency. Retry behavior. Connection and command timeout. Deployment or configuration changes. For example: Evidence Baseline Regression Pipeline duration Minutes Much longer Stored procedure Same Same Parameter range A B Concurrent activities Low Higher Azure SQL CPU Normal Normal/moderate SQL wait behavior Unknown To investigate The most important rule is: Don't assume the SQL workload is identical simply because the stored procedure is identical. Different parameters can result in dramatically different: Row counts. Join choices. Memory grants. Sort requirements. Execution plans. Total duration. 2. Preserve the Exact Invocation One of the easiest ways to lose a performance regression is to reproduce it with different parameters. Capture the invocation before testing: Procedure name. Parameter values. Date range. Entity or partition identifier. Batch size. Pipeline run ID. Retry number. Number of parallel activities. Relevant timeout configuration. Then sanitize any business-sensitive values before sharing them outside your organization. The diagnostic principle is simple: Reproduce the same workload before trying to improve the workload. 3. Reproduce Safely Whenever possible, reproduce the issue using: A nonproduction database containing representative data. A controlled production troubleshooting window. The same stored procedure. The same parameter pattern. Comparable concurrency. For a controlled test, SQL execution statistics can help: SET STATISTICS IO ON; SET STATISTICS TIME ON; EXEC dbo.SampleProcedure @StartDate = '2026-01-01', @EndDate = '2026-01-31', @EntityID = 100; SET STATISTICS TIME OFF; SET STATISTICS IO OFF; Replace these synthetic names and values with the sanitized equivalent of the invocation you're investigating. Capture: Elapsed time. CPU time. Logical reads. Physical reads when relevant. Execution plan. Returned row count. The goal isn't simply to reproduce "slow." The goal is to understand why it is slow. 4. First Question: Is SQL Running or Waiting? This distinction changes the entire investigation. During the slow execution, examine the active request. SELECT r.session_id, r.request_id, r.status, r.command, r.start_time, r.cpu_time, r.total_elapsed_time, r.wait_type, r.wait_time, r.last_wait_type, r.wait_resource, r.blocking_session_id, r.reads, r.writes, r.logical_reads, r.row_count FROM sys.dm_exec_requests AS r WHERE r.database_id = DB_ID() ORDER BY r.total_elapsed_time DESC; sys.dm_exec_requests is supported for Azure SQL Database and exposes information about currently executing requests. Pay particular attention to the relationship between: cpu_time and: total_elapsed_time Suppose a request has: Very high elapsed time. Relatively little accumulated CPU time. A significant current wait. That's a strong reason to investigate waiting, rather than immediately treating the problem as insufficient CPU. Conversely: High elapsed time. High accumulated CPU. High logical reads. points more strongly toward expensive execution. 5. Identify Blocking Another request may be preventing the pipeline's SQL request from progressing. Start with: SELECT session_id, status, wait_type, wait_time, wait_resource, blocking_session_id, cpu_time, total_elapsed_time FROM sys.dm_exec_requests WHERE blocking_session_id <> 0 ORDER BY wait_time DESC; Blocking can explain a scenario where: Pipeline duration increases dramatically. Database CPU remains moderate. The SQL activity appears "active" for a long time. Microsoft documents sys.dm_exec_requests as one of the tools for identifying requests suspended on lock-related waits and tracing blocking behavior in Azure SQL Database. Don't confuse: "The SQL call took two hours." with: "SQL executed for two hours." Those statements aren't necessarily equivalent. 6. Look at the SQL That's Actually Running During an active incident, retrieve the request and its current SQL text: SELECT r.session_id, r.status, r.command, r.cpu_time, r.total_elapsed_time, r.wait_type, r.blocking_session_id, r.logical_reads, txt.text AS batch_text FROM sys.dm_exec_requests AS r CROSS APPLY sys.dm_exec_sql_text(r.sql_handle) AS txt WHERE r.database_id = DB_ID() ORDER BY r.total_elapsed_time DESC; sys.dm_exec_sql_text accepts the sql_handle exposed by sys.dm_exec_requests and returns the associated SQL batch text. This helps validate an important cross-service question: Is the database executing the statement we think the pipeline invoked? 7. Investigate Memory Grants Some operations need execution memory before they can proceed efficiently. Common examples include: Sorts. Hash joins. Hash aggregates. Some index operations. sys.dm_exec_query_memory_grants exposes queries that: Requested a memory grant and received one. Requested a memory grant and are still waiting. It is supported for Azure SQL Database. SELECT mg.session_id, mg.request_id, mg.dop, mg.request_time, mg.grant_time, mg.requested_memory_kb, mg.granted_memory_kb, mg.required_memory_kb, mg.used_memory_kb, mg.max_used_memory_kb, mg.query_cost, mg.timeout_sec, mg.resource_semaphore_id FROM sys.dm_exec_query_memory_grants AS mg ORDER BY mg.requested_memory_kb DESC; Interpret the important columns carefully: requested_memory_kb Memory requested by the query. granted_memory_kb Memory actually granted. required_memory_kb Minimum memory required for execution. used_memory_kb Memory currently being used. max_used_memory_kb Maximum used so far. grant_time NULL when the requested grant hasn't yet been granted. Microsoft specifically documents that queries waiting for memory grants appear in this DMV, and that grant_time remains NULL until the grant is provided. 8. Find Waiting Memory Grants During the active regression, focus specifically on requests that haven't received their grants: SELECT mg.session_id, mg.request_id, mg.request_time, mg.grant_time, mg.requested_memory_kb, mg.required_memory_kb, mg.granted_memory_kb, mg.timeout_sec, mg.dop, mg.query_cost FROM sys.dm_exec_query_memory_grants AS mg WHERE mg.grant_time IS NULL ORDER BY mg.request_time; If the affected session repeatedly appears here, you now have meaningful evidence supporting a memory-grant contention hypothesis. But that's still not enough to state: "Memory grants caused the pipeline regression." You should also establish: Whether the waiting session is actually the pipeline request. How long it remained waiting. Whether other statements were consuming large grants. Whether concurrency changed. Whether the execution plan requested unusually large memory. Why the query requested that amount of memory. That last question is particularly important. Memory-grant problems can be downstream symptoms of: Poor cardinality estimates. Large sorts. Large hash joins. Plan changes. Data growth. Parameter sensitivity. Microsoft's memory-grant troubleshooting guidance emphasizes that operations such as sorts and hash operations can require execution-memory reservations and that these grants exist for the lifetime of the query. Memory-grant contention is a diagnostic hypothesis until the evidence supports causality. 9. Pipeline Concurrency Is Database Concurrency This connection is easy to overlook. Suppose one stored-procedure invocation performs acceptably. Now imagine the orchestration layer starts: 2 copies concurrently. 5 copies concurrently. 10 copies concurrently. 20 copies concurrently. Each execution may individually be reasonable. Together, they can compete for: CPU. Workers. Memory grants. Buffer pool resources. I/O. Locks. This means: A pipeline concurrency change is also a database workload change. Even when: SQL code hasn't changed. Database configuration hasn't changed. Stored procedure code hasn't changed. As part of troubleshooting, compare: Single-execution performance. Typical production concurrency. Regression-period concurrency. Temporarily reducing pipeline concurrency can also be a valuable diagnostic experiment, provided the change is safe for the workload. 10. Capture the Live Execution Plan For a request that's still executing, Azure SQL Database supports sys.dm_exec_query_statistics_xml(), which returns Showplan XML containing transient execution statistics for an in-flight request. First identify the target session: SELECT session_id, request_id, status, command, cpu_time, total_elapsed_time, wait_type, logical_reads FROM sys.dm_exec_requests WHERE database_id = DB_ID() ORDER BY total_elapsed_time DESC; Then, for a known session: DECLARE @SessionID smallint = 123; SELECT qsx.session_id, qsx.request_id, qsx.query_plan FROM sys.dm_exec_query_statistics_xml(@SessionID) AS qsx; Replace 123 with the session being investigated. The live plan can help answer: Which operator is consuming time? How many rows are flowing through operators? Are estimates diverging significantly from runtime behavior? Are large joins or sorts involved? Where does execution appear to be spending time? Microsoft describes access to execution-plan runtime information as particularly useful when investigating long-running queries, because the information can be inspected without waiting for the query to finish. Use live-plan collection purposefully, especially on heavily loaded production systems. 11. Compare Historical Behavior in Query Store A live snapshot explains what's happening now. Query Store helps answer: What was happening when the query used to be fast? For example, find queries with multiple retained Query Store plans: SELECT TOP (50) q.query_id, COUNT(DISTINCT p.plan_id) AS plan_count, COUNT(DISTINCT p.query_plan_hash) AS distinct_plan_shapes, MIN(p.first_execution_time) AS first_plan_execution, MAX(p.last_execution_time) AS last_plan_execution FROM sys.query_store_query AS q JOIN sys.query_store_plan AS p ON q.query_id = p.query_id GROUP BY q.query_id HAVING COUNT(DISTINCT p.plan_id) > 1 ORDER BY plan_count DESC; Multiple plans aren't automatically evidence of a problem. Instead, investigate whether plan changes correlate with: Pipeline regressions. Duration changes. CPU changes. Logical-read changes. Memory behavior. Different parameter populations. 12. Compare Runtime Distributions, Not Just Averages Averages can hide regression patterns. Consider: Most executions take 10 seconds. A few take 45 minutes. The average won't fully describe the operational impact. For a known Query Store query_id, compare plans and runtime intervals: DECLARE @QueryID bigint = 123; SELECT p.plan_id, rsi.start_time, rsi.end_time, SUM(rs.count_executions) AS execution_count, CAST(AVG(rs.avg_duration) / 1000.0 AS decimal(18,2)) AS avg_duration_ms, CAST(MAX(rs.max_duration) / 1000.0 AS decimal(18,2)) AS max_duration_ms, CAST(AVG(rs.avg_cpu_time) / 1000.0 AS decimal(18,2)) AS avg_cpu_ms, CAST(AVG(rs.avg_logical_io_reads) AS decimal(18,2)) AS avg_logical_reads FROM sys.query_store_query AS q JOIN sys.query_store_plan AS p ON q.query_id = p.query_id JOIN sys.query_store_runtime_stats AS rs ON p.plan_id = rs.plan_id JOIN sys.query_store_runtime_stats_interval AS rsi ON rs.runtime_stats_interval_id = rsi.runtime_stats_interval_id WHERE q.query_id = @QueryID GROUP BY p.plan_id, rsi.start_time, rsi.end_time ORDER BY rsi.start_time DESC, p.plan_id; Replace 123 with the Query Store ID being investigated. Compare: Fast periods. Slow periods. Plans. Execution counts. CPU. Duration. Logical reads. This often produces a better picture than looking at lifetime averages. 13. Don't Force the Fastest Historical Plan Yet Suppose Query Store shows: Plan A took 30 seconds. Plan B takes 20 minutes. It might be tempting to immediately force Plan A. But first ask: How many times did Plan A execute? Which parameters used Plan A? Was the data distribution comparable? Was workload concurrency comparable? Did Plan A perform well repeatedly? Is the query parameter sensitive? A plan that was excellent for one parameter combination might be disastrous for another. The goal isn't to find the lowest historical duration. The goal is to find the plan behavior that's safe for the intended workload. If plan forcing is tested, define rollback criteria before deployment. 14. Test One Hypothesis at a Time Avoid simultaneously changing: Statistics. Indexes. Query code. Pipeline concurrency. Plan forcing. Compute tier. Doing everything together may improve performance, but you'll learn very little about why. Instead: Hypothesis: stale or inaccurate statistics Test: Appropriate statistics maintenance. Same parameters. Same concurrency. Then measure again. Hypothesis: memory-grant contention Test safely with: Reduced concurrency. Same parameter set. Same procedure. Same database configuration. Then compare: Grant wait behavior. Elapsed time. CPU time. Query plan. Hypothesis: plan regression Compare: Historical plans. Representative parameters. Runtime distributions. Only then evaluate targeted plan intervention. Hypothesis: poor cardinality Look for: Estimate-to-actual row differences. Parameter sensitivity. Implicit conversions. Sort/hash behavior. Excessive memory requests. This approach turns troubleshooting from guesswork into experimentation. 15. Correlation Is Not Root Cause This is perhaps the most important principle in cross-service troubleshooting. Suppose you see: A slow pipeline. A SQL memory-grant wait. Several concurrent activities. Those facts are correlated. They don't yet prove: "Memory contention caused the pipeline regression." A stronger conclusion requires a causal chain such as: The pipeline invokes the identified SQL request. That request repeatedly waits for execution memory during the regression. Competing queries hold substantial memory grants during the same period. Reducing the competing concurrency removes or materially reduces the grant wait. The same SQL invocation then returns toward its normal runtime. Repeating the workload reproduces the relationship. Now the evidence for causality is much stronger. This distinction matters because Azure SQL memory pressure can arise from several sources, including the chosen service objective, aggregate workload demand, and individual query memory demand. 16. Build a Cross-Service Evidence Package For difficult Synapse or Data Factory to Azure SQL regressions, both teams should be able to work from the same timeline. Capture: Pipeline evidence Pipeline run ID. Activity name. Activity start and end times. Sanitized parameters. Retry count. Timeout. Concurrent activities. Azure SQL evidence Session/request identification when captured live. Query Store query_id. Query Store plan_id. Runtime intervals. CPU time. Elapsed time. Logical reads. Wait type. Blocking session. Memory grant information. Execution plan. Investigation evidence Separate everything into: Facts Pipeline execution took longer than baseline. SQL request was identified. Request waited for memory. Multiple pipeline activities overlapped. A different plan appeared during the regression. Hypotheses Pipeline concurrency created memory-grant contention. Cardinality changes increased the requested memory grant. Parameter sensitivity caused a plan regression. Blocking contributed to runtime. Resource contention amplified an otherwise acceptable query. Experiments Document: What changed. Why it changed. Test duration. Result. Whether the hypothesis was strengthened or weakened. This prevents the pipeline and database teams from investigating two different incidents that simply happened at the same time. A Practical Decision Tree When a Synapse or Data Factory pipeline's Azure SQL activity suddenly becomes slow: 1. Can you identify the exact invocation? No Capture it before continuing. Yes Reproduce with equivalent parameters and concurrency. 2. Is SQL consuming significant CPU? Yes Investigate: Execution plan. Logical reads. Cardinality. Indexing. Parameter sensitivity. No Look at waits. 3. Is the request blocked? Yes Investigate: Blocking session. Transaction duration. Locking pattern. No Continue. 4. Is the request waiting for a memory grant? Yes Investigate: Requested versus granted memory. Other active grants. Sorts and hash operations. Cardinality estimates. Pipeline concurrency. No Investigate the actual current wait. 5. Did the execution plan change? Yes Compare: Runtime distributions. Parameter sets. CPU. Reads. Memory requirements. No Continue correlating waits, workload volume, and concurrency. 6. Does reducing concurrency improve the same invocation? Yes Resource competition becomes a stronger hypothesis. No Continue investigating query-specific behavior. Final Takeaway When a pipeline goes from minutes to hours, the fact that the Azure SQL activity is taking a long time doesn't automatically mean Azure SQL is spending all that time executing. The request might be spending much of its lifetime: Waiting for memory. Waiting behind another transaction. Waiting for another resource. Executing with a different plan. Processing a different parameter population. Competing with concurrent pipeline activities. A reliable investigation connects two perspectives: Pipeline context What exactly was invoked? With which parameters? At what time? At what concurrency? Database context Was the SQL request executing or waiting? How much CPU did it actually consume? What was it waiting for? Which plan did it use? How much memory did it request? What else was happening concurrently? sys.dm_exec_requests can identify active requests and their current execution state, while sys.dm_exec_query_memory_grants exposes statements that have requested or received execution memory. Azure SQL Database also supports obtaining transient plan information for in-flight requests through sys.dm_exec_query_statistics_xml(). Most importantly: Treat waits, memory grants, plan changes, and concurrency as evidence to test, not automatic root causes. That is how "the pipeline is slow" becomes a reproducible, evidence-backed performance diagnosis.107Views0likes0CommentsAzure SQL Performance Troubleshooting: When High Latency Is Not High CPU
When an application connected to Azure SQL Database becomes slow or starts timing out, one of the first questions is usually: Is the database running out of CPU? It's a reasonable starting point, but CPU is only one part of the performance story. Some Azure SQL performance problems occur while CPU, Data IO, and worker utilization appear healthy. The database may have plenty of compute capacity while queries spend most of their time waiting rather than executing. The key troubleshooting question is therefore not simply: "How much CPU is Azure SQL using?" Instead, ask: "Where is the elapsed time being spent?" Start With Resources, But Don't Stop There Resource utilization should still be the first checkpoint. A simple query using sys.dm_db_resource_stats can help identify whether Azure SQL is approaching CPU, Data IO, Log IO, memory, or worker limits: SELECT DB_NAME() AS database_name, AVG(avg_cpu_percent) AS avg_cpu_percent, MAX(avg_cpu_percent) AS max_cpu_percent, MAX(avg_data_io_percent) AS max_data_io_percent, MAX(avg_log_write_percent) AS max_log_write_percent, MAX(avg_memory_usage_percent) AS max_memory_percent, MAX(max_worker_percent) AS max_worker_percent FROM sys.dm_db_resource_stats; If CPU is consistently near 100%, investigate CPU consumption. If Log IO reaches its limit, investigate transaction-log generation. If workers are exhausted, investigate concurrency. But if none of these resources is saturated, don't conclude that Azure SQL is healthy. Move to wait analysis. Follow the Waits A useful simplified model is: Query elapsed time = CPU execution If a query runs for 10 minutes but uses only 30 seconds of CPU, most of its elapsed time occurred somewhere else. Common wait patterns can point the investigation in different directions: Wait Area to investigate PAGELATCH_* In-memory page contention PAGEIOLATCH_* Storage reads LCK_M_* Blocking WRITELOG Transaction log LOG_RATE_GOVERNOR Log throughput RESOURCE_SEMAPHORE Memory grants ASYNC_NETWORK_IO Client/result consumption The wait type is not automatically the root cause. Think of it as a sign telling you: Look in this direction next. PAGELATCH Does Not Mean Slow Storage One important distinction is: PAGELATCH versus: PAGEIOLATCH Despite their similar names, they represent different problems. PAGEIOLATCH is associated with waiting for data pages involved in physical I/O. PAGELATCH, however, is synchronization around pages that are already in memory. Consider a highly concurrent workload: Hundreds of sessions ↓ Same memory page ↓ Latch contention ↓ Sessions wait ↓ Application CPU may still have available capacity. This is why increasing vCores doesn't necessarily eliminate latch contention. Additional compute provides more workload headroom, but it doesn't automatically remove a serialization point around a hot page. Microsoft's I/O troubleshooting guidance also distinguishes PAGEIOLATCH and other I/O-related waits when diagnosing storage-performance problems. Microsoft Learn: Troubleshoot SQL Server I/O performance Query Frequency Matters Too Another common mistake is focusing only on individually expensive queries. Imagine a query that takes only 20 milliseconds but executes hundreds of thousands of times, often concurrently. Its impact is better thought of as: Workload Impact = Cost per execution × Execution frequency × A small metadata lookup or initialization query can become significant when hundreds of application instances execute it simultaneously. This is where Query Store becomes particularly useful. Query Store preserves query, execution-plan, and runtime history, allowing you to compare executions, duration, CPU, plans, and other performance characteristics over time. Microsoft Learn: Monitor performance using Query Store Instead of asking only: "What's my most expensive query?" also ask: "What changed in the workload?" When Nine Hours of Duration Is Only One Minute of CPU Now consider the opposite problem. Suppose Query Store shows something like: Elapsed time 9 hours SQL CPU time 1 minute Returned rows 750,000+ Dominant wait ASYNC_NETWORK_IO Would adding CPU solve this? Probably not. CPU represents only a tiny fraction of the elapsed time. ASYNC_NETWORK_IO commonly occurs when SQL Server has results available but the client application is not consuming them quickly enough. Microsoft documents several possible causes, including: large result sets; slow application processing; applications fetching rows slowly; network-related delays. Microsoft Learn: Troubleshoot ASYNC_NETWORK_IO Importantly: ASYNC_NETWORK_IO does not automatically mean the network is slow. The bottleneck might actually be the application. Measure Time to First Row A useful troubleshooting technique is to separate database response time from result-consumption time. Instead of measuring only: Query start → Application finished measure: T0 = Query submitted T1 = First row received T2 = Last row received T3 = Application processing completed You can then separate: Database response = T1 - T0 Result consumption = T2 - T1 Application For example: First row received: 2 seconds Last row received: 2 hours Processing completed: 2.5 hours Calling this a "2.5-hour SQL query" would be misleading. SQL started returning results after two seconds. Most of the time was spent transferring or processing them. Don't Forget Blocking Low CPU can also be caused by blocking. If many sessions are waiting behind a transaction, increasing CPU isn't going to solve the problem. During an active incident, check requests and their waits: SELECT r.session_id, r.blocking_session_id, r.status, r.wait_type, r.wait_time, r.wait_resource, r.cpu_time, r.total_elapsed_time, st.text FROM sys.dm_exec_requests AS r CROSS APPLY sys.dm_exec_sql_text(r.sql_handle) AS st WHERE r.blocking_session_id <> 0 ORDER BY r.wait_time DESC; This helps determine whether the application is experiencing a resource problem or simply waiting behind another transaction. Why Scaling Can Be Misleading Imagine this sequence: Application slow ↓ Scale database ↓ Performance improves It's tempting to conclude: "We needed more CPU." But scaling can change more than CPU availability. Depending on the operation and environment, it can alter resource availability or execution conditions. Therefore: A successful mitigation does not automatically prove the root cause. Always distinguish between: What made the symptoms disappear? and: What originally caused the symptoms? A Practical Troubleshooting Workflow When investigating Azure SQL performance, I use the following approach: 1. Define the exact incident window Preferably using UTC timestamps. 2. Check core resources Look at: CPU Data IO Log IO memory workers 3. Compare CPU time with elapsed time If: Elapsed ≈ CPU investigate computational workload. If: Elapsed >>> CPU investigate waits. 4. Identify dominant waits Ask what prevented SQL from continuing execution. 5. Check blocking Determine whether requests are waiting behind other transactions. 6. Use Query Store Compare healthy and problematic periods for: execution count; CPU; duration; logical reads; plans; wait behavior. Microsoft provides Query Store examples specifically for workload and performance investigation. Microsoft Learn: Tune performance with Query Store 7. Inspect the execution plan Look for inefficient access patterns, cardinality problems, excessive reads, repeated lookups, spills, scans, or plan changes. 8. Investigate the application Especially when SQL CPU is low but result-transfer waits are high. Look at: rows returned; fetch size; batch size; application processing; concurrency; downstream dependencies. 9. Compare healthy vs unhealthy periods Don't analyze an incident in isolation. Ask: What changed? Common Misdiagnoses "CPU isn't 100%, so SQL is healthy." Not necessarily. Queries might simply be waiting. "ASYNC_NETWORK_IO means we have a network problem." Not necessarily. The client may be consuming results slowly. "PAGELATCH means storage is slow." No. Don't confuse PAGELATCH with PAGEIOLATCH. "Scaling fixed the problem, so CPU was the root cause." Not necessarily. Mitigation and root cause are different concepts. "The slowest query must be the problem." Not always. A small query executed extremely frequently can generate larger cumulative impact. Final Thought: Follow the Time When Azure SQL becomes slow, avoid jumping directly from: Slow database → Add more vCores Instead, work through: High latency ↓ Resource utilization ↓ CPU vs elapsed time ↓ Wait statistics ↓ Query Store ↓ Execution plan ↓ Application behavior ↓ Root cause ↓ Targeted optimization Performance troubleshooting becomes much easier once you stop asking only: "How busy is Azure SQL?" and start asking: "Where did the time go?" Because sometimes the database isn't busy at all. It's waiting. References Monitor Performance by Using the Query Store Tune performance with the Query Store Troubleshoot slow queries resulting from ASYNC_NETWORK_IO Troubleshoot slow SQL Server performance caused by I/O issues278Views0likes0Comments
Azure Database creation using T-SQL or SSMS currently allows Unsupported characters in it's name.
If a Database created using SSMS or T-SQL has unsupported characters in it's name, then any Powershell/Azure CLI/Portal operation on it can fail. You may experience a few other kinds of unexpected behavior as well, with this specific database.3.2KViews1like0Comments