Forum Discussion

darklyndsea
Nov 02, 2026Copper Contributor
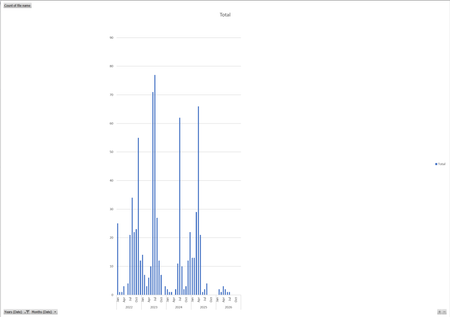
PivotChart is tall and narrow with lots of white space
Everything I know about PivotCharts is self-taught, so there are some gaps in my knowledge. Normally when I make a PivotChart, the plot area sizes itself so that it fits nicely within the chart area...
- Nov 04, 2026
Seems a known behavior in Excel when the chart area and plot area scaling do not automatically adjust to the available space. It usually happens when the chart was created from a PivotTable with many category labels (like months across several years) or when Excel’s default chart dimensions were constrained by the surrounding cells or container.
Try resizing manually:
- Click the chart border (not the plot area).
- Drag the corner handles to widen the chart horizontally.
- If the plot area doesn’t expand proportionally, right‑click the chart > Format Chart Area > Size & Properties > Lock aspect ratio (uncheck).
- Adjust until the bars fill the chart area evenly.

Kidd_Ip
Nov 04, 2026MVP
Seems a known behavior in Excel when the chart area and plot area scaling do not automatically adjust to the available space. It usually happens when the chart was created from a PivotTable with many category labels (like months across several years) or when Excel’s default chart dimensions were constrained by the surrounding cells or container.
Try resizing manually:
- Click the chart border (not the plot area).
- Drag the corner handles to widen the chart horizontally.
- If the plot area doesn’t expand proportionally, right‑click the chart > Format Chart Area > Size & Properties > Lock aspect ratio (uncheck).
- Adjust until the bars fill the chart area evenly.