Forum Discussion

PivotChart is tall and narrow with lots of white space
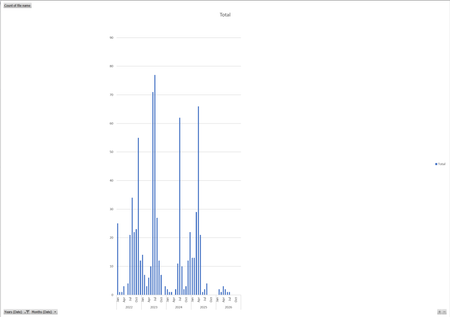
- Nov 04, 2026
Seems a known behavior in Excel when the chart area and plot area scaling do not automatically adjust to the available space. It usually happens when the chart was created from a PivotTable with many category labels (like months across several years) or when Excel’s default chart dimensions were constrained by the surrounding cells or container.
Try resizing manually:
- Click the chart border (not the plot area).
- Drag the corner handles to widen the chart horizontally.
- If the plot area doesn’t expand proportionally, right‑click the chart > Format Chart Area > Size & Properties > Lock aspect ratio (uncheck).
- Adjust until the bars fill the chart area evenly.


Yes—you can resize both the whole chart and the plot area inside it. They’re separate, which can explain why making the chart larger doesn’t always remove the white space.
First, select the chart’s outer border and drag a side handle to make it wider. You can also enter exact dimensions under Chart Format > Size.
If the outer chart is already wide enough, select Plot Area from the Current Selection dropdown on the Format tab. Drag its side handles outward to fill more of the chart. Legends, axis labels and PivotChart field buttons can also take up space; hide or reposition any you don’t need.
If it’s only the individual columns that look too thin, right-click a column, choose Format Data Series, and reduce Gap Width. That changes column thickness, not the chart’s overall proportions.