Forum Discussion
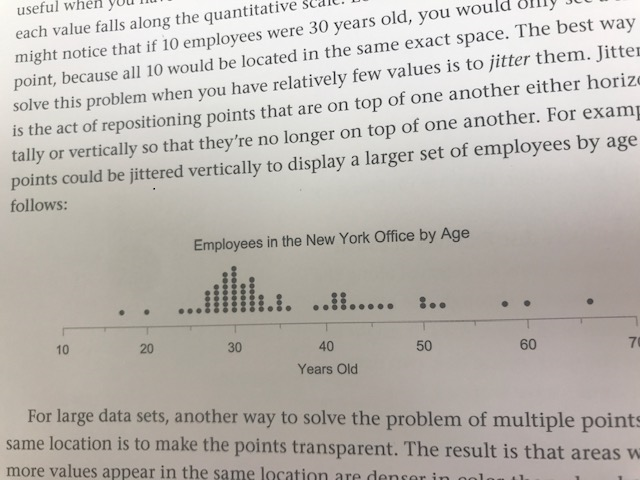
Jitter VERTICALLY
- Apr 30, 2020
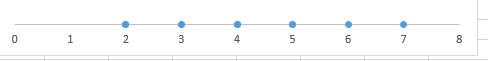
Jillian25 What your picture shows can be achieved with a number of regular line charts that only shows the data point markers. The line format is thus "No line" and you format all line markers to your liking with respect to size and colour.
In the attached example, I used your 12 values and plotted 8 individual series where each data point is one below its predecessor, but never less then zero.
Thank you so much Riny_van_Eekelen
Perfect!!!
- Riny_van_EekelenApr 30, 2020Platinum Contributor
Jillian25 You're welcome!