Forum Discussion
Excel Chart Several Y values against one X Value
Hello,
I'd like to draw a plot. for each X value there are multiple Y values. Is there a chart where i can plot X . In the plot i would like to see one J71 on the x-axis, and the Y values are markers lining up vertically. Similarly for J72 as the next X-value with its corresponding Y-values. If I use X-Y scatter the x values show up as 1,2,3.. but I'd like to see J71,J72....
I attached the excel sheet.
Thank you!
Sam
| J71 | 5 |
| J71 | 4 |
| J71 | 8 |
| J71 | 9 |
| J72 | 10 |
| J72 | 7 |
| J72 | 6 |
| J72 | 3 |
SamFares Perhaps like in the attached workbook.
6 Replies
- PeterBartholomew1Silver Contributor
Charting is often a matter of 'smoke and mirrors'
The picture shows error bars used to define the values and a separate series used to provide labels for the axis.
Edit: I have since used a named formula to calculate the x-position without showing it on the worksheet. Also added value labels at the centre of each bar.
 SamFaresBrass Contributor
- Ramiz_AssafIron Contributor
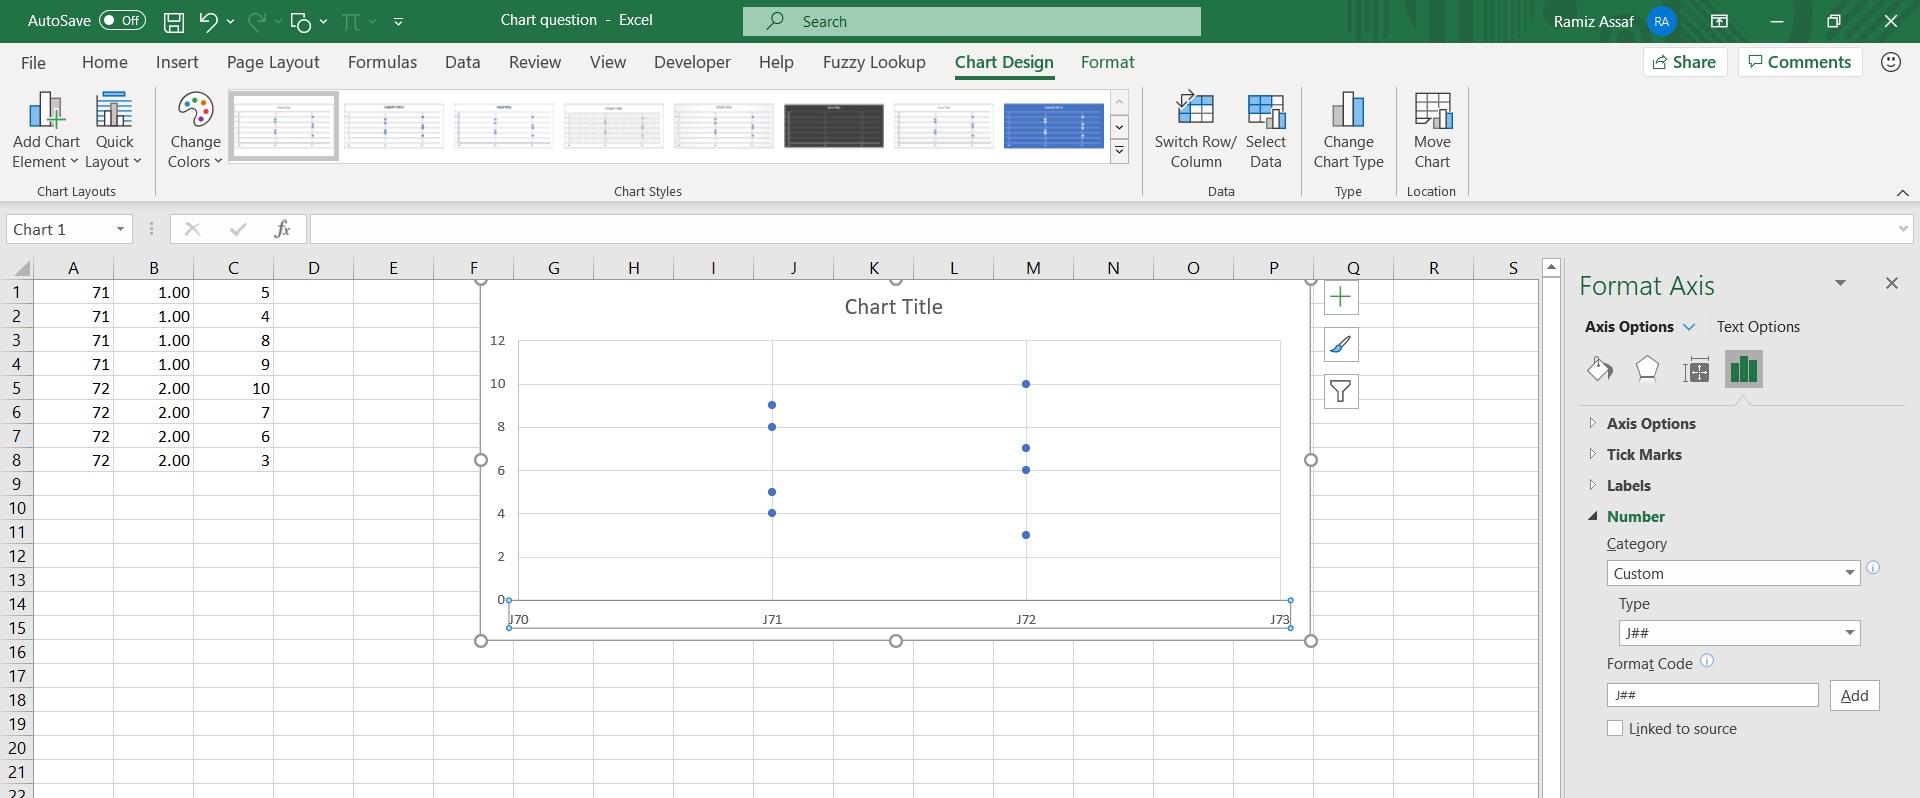
Another solution is use a J## label with the chart
create the values of the columns without the J, only 71 and 72
then plot a scatter plot.
in the Label option add J##, which means what ever is the number put a J in front of it
see the photo
- SamFaresBrass Contributor
Thanks a lot Ramiz_Assaf
Appreciate your help!
- Riny_van_EekelenPlatinum Contributor
- SamFaresBrass Contributor