Forum Discussion
SamFares
Sep 11, 2020Brass Contributor
Excel Chart Several Y values against one X Value
Hello, I'd like to draw a plot. for each X value there are multiple Y values. Is there a chart where i can plot X . In the plot i would like to see one J71 on the x-axis, and the Y values are ma...
- Sep 11, 2020
SamFares Perhaps like in the attached workbook.
Ramiz_Assaf
Sep 11, 2020Iron Contributor
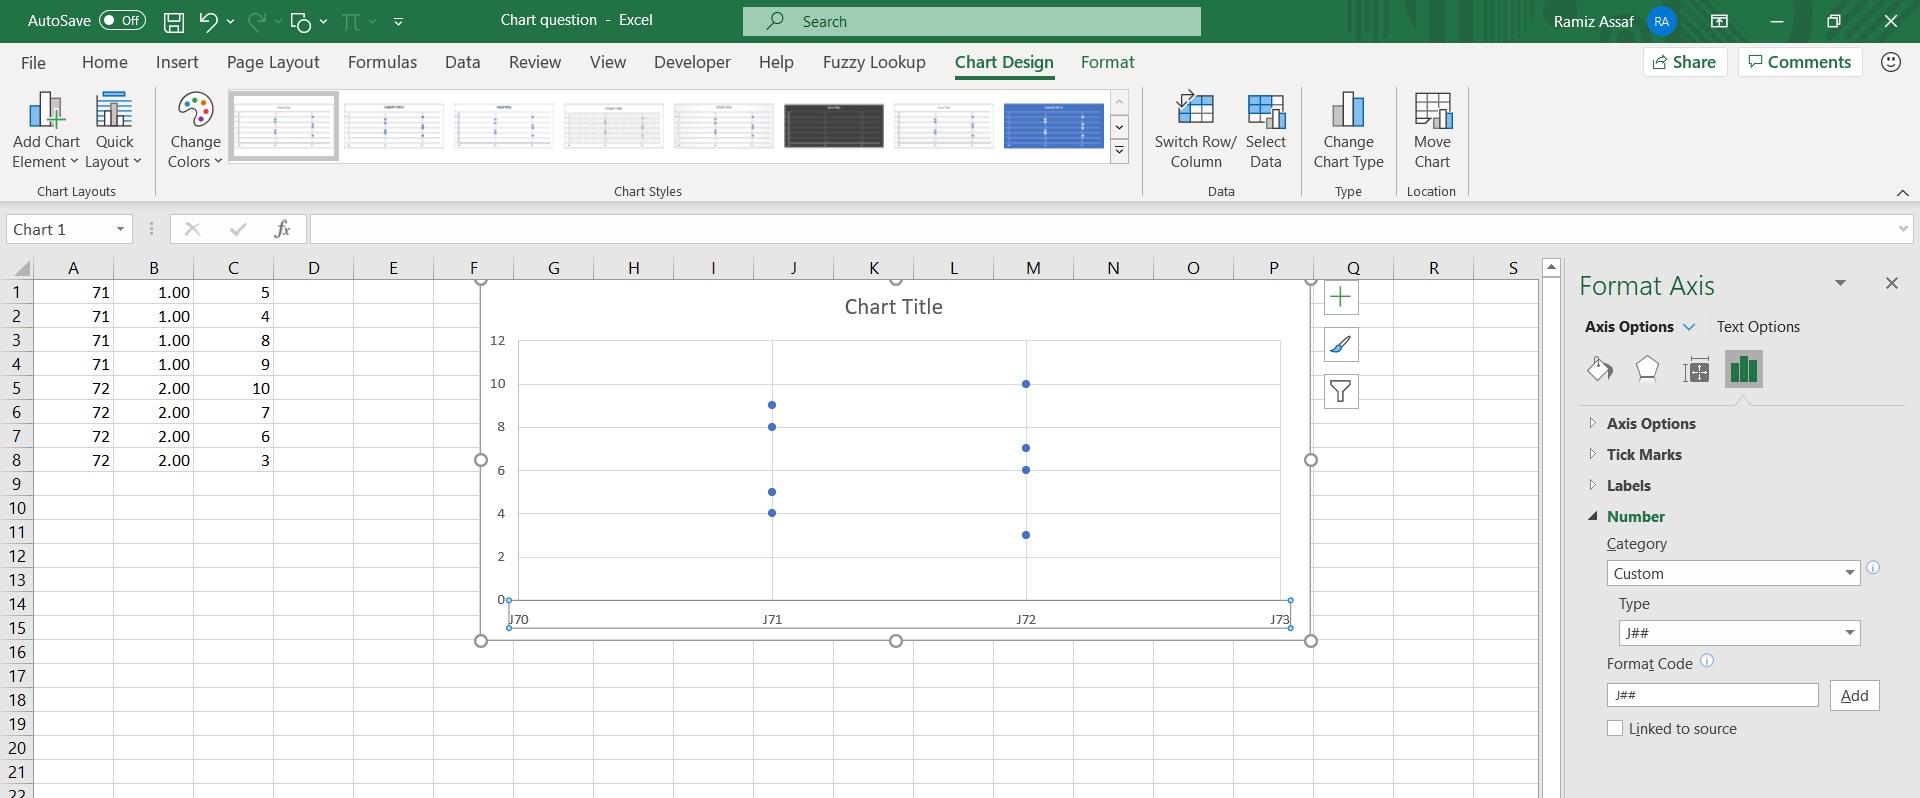
Another solution is use a J## label with the chart
create the values of the columns without the J, only 71 and 72
then plot a scatter plot.
in the Label option add J##, which means what ever is the number put a J in front of it
see the photo
SamFares
Sep 12, 2020Brass Contributor
Thanks a lot Ramiz_Assaf
Appreciate your help!