Forum Discussion
ZacPhil2
Mar 08, 2022Copper Contributor
Correlation Analysis
I am trying to use the Analysis ToolPak to create a correlational analysis graph but when I input my input range and output range and all that, then click OK, it says Input Range must contain at least one dataPoint and I'm not sure what this means or how to put in a data point so I can move on.
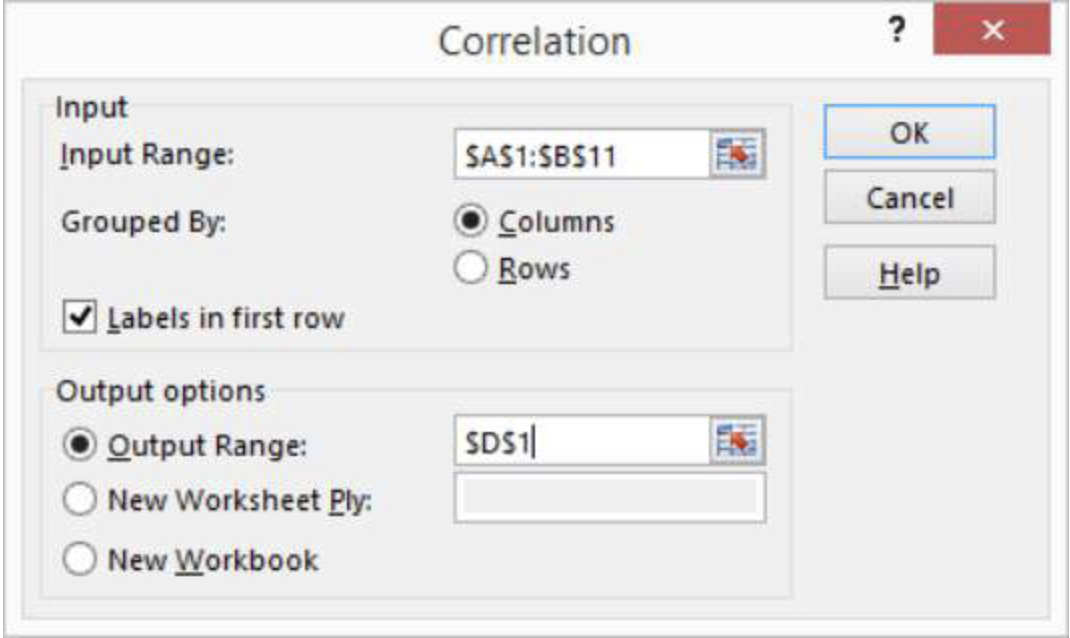
ZacPhil2, have you tried locking these cells within the correlation dialogue box? See example attached.