Forum Discussion

Chart data
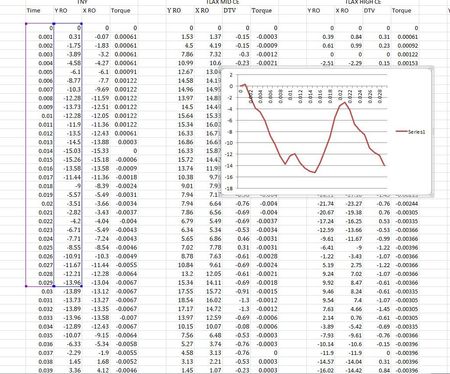

Yes, that can be done. It's one of the core techniques of dynamic charts in Excel.
What you need:
- A cell where the user indicates which data to show
- A formula that uses that cell input to build a dynamic range
- A chart that uses the dynamic range as the chart series source.
For 1: You may want to use a Spin Button or a Scroll Bar from the Developer ribbon > Insert dialog. If you use a Scroll bar, set it up so that a page change equals 30, the minimum is 1 and the maximum is the number of rows in your data set. The Scroll Bar writes its value into a spreadsheet cell. Give that cell a range name, like "SelectedBlock" so it is easier to read in formulas. (you could also let the user type in the start row of the data block into that cell manually)
For 2: Create two named ranges with these names and formula references. (Assuming your data starts in A6
graphX =OFFSET(Sheet1!$A$6,SelectedBlock-1,0,30,1)
graphY =OFFSET(graphX,0,1)
For 3: Create a new chart or use an existing chart to plug in the names in the series dialog. When you enter the names, you need to prepend it with the sheet name, like in the screenshot.
When the user clicks on the Scroll Bar slider, the value in the SelectedBlock cell will change. This will cause a recalculation of the graphX and graphY range names and the chart will adjust.
 Santhosh750Jul 22, 2019Copper Contributor
Thank you very much for responding to my Query. can you please add some pictures to the point 1. in your description? I am not able to figure out exactly how to setup scroll bars or spin buttons to my data.IngeborgHawighorst
- Jul 24, 2019
Santhosh750 First, you need to enable the Developer ribbon. On that ribbon you can find the "insert" drop-down, which has two sections, Form Controls and ActiveX Controls. Use only the Form Controls.
After you have inserted a control like a spin button or scroll bar, you can right-click and format the control to get to all the settings.