Forum Discussion
nicolasdaudin
Aug 20, 2021Copper Contributor
Calculate Monthly Average on a Pivot Table
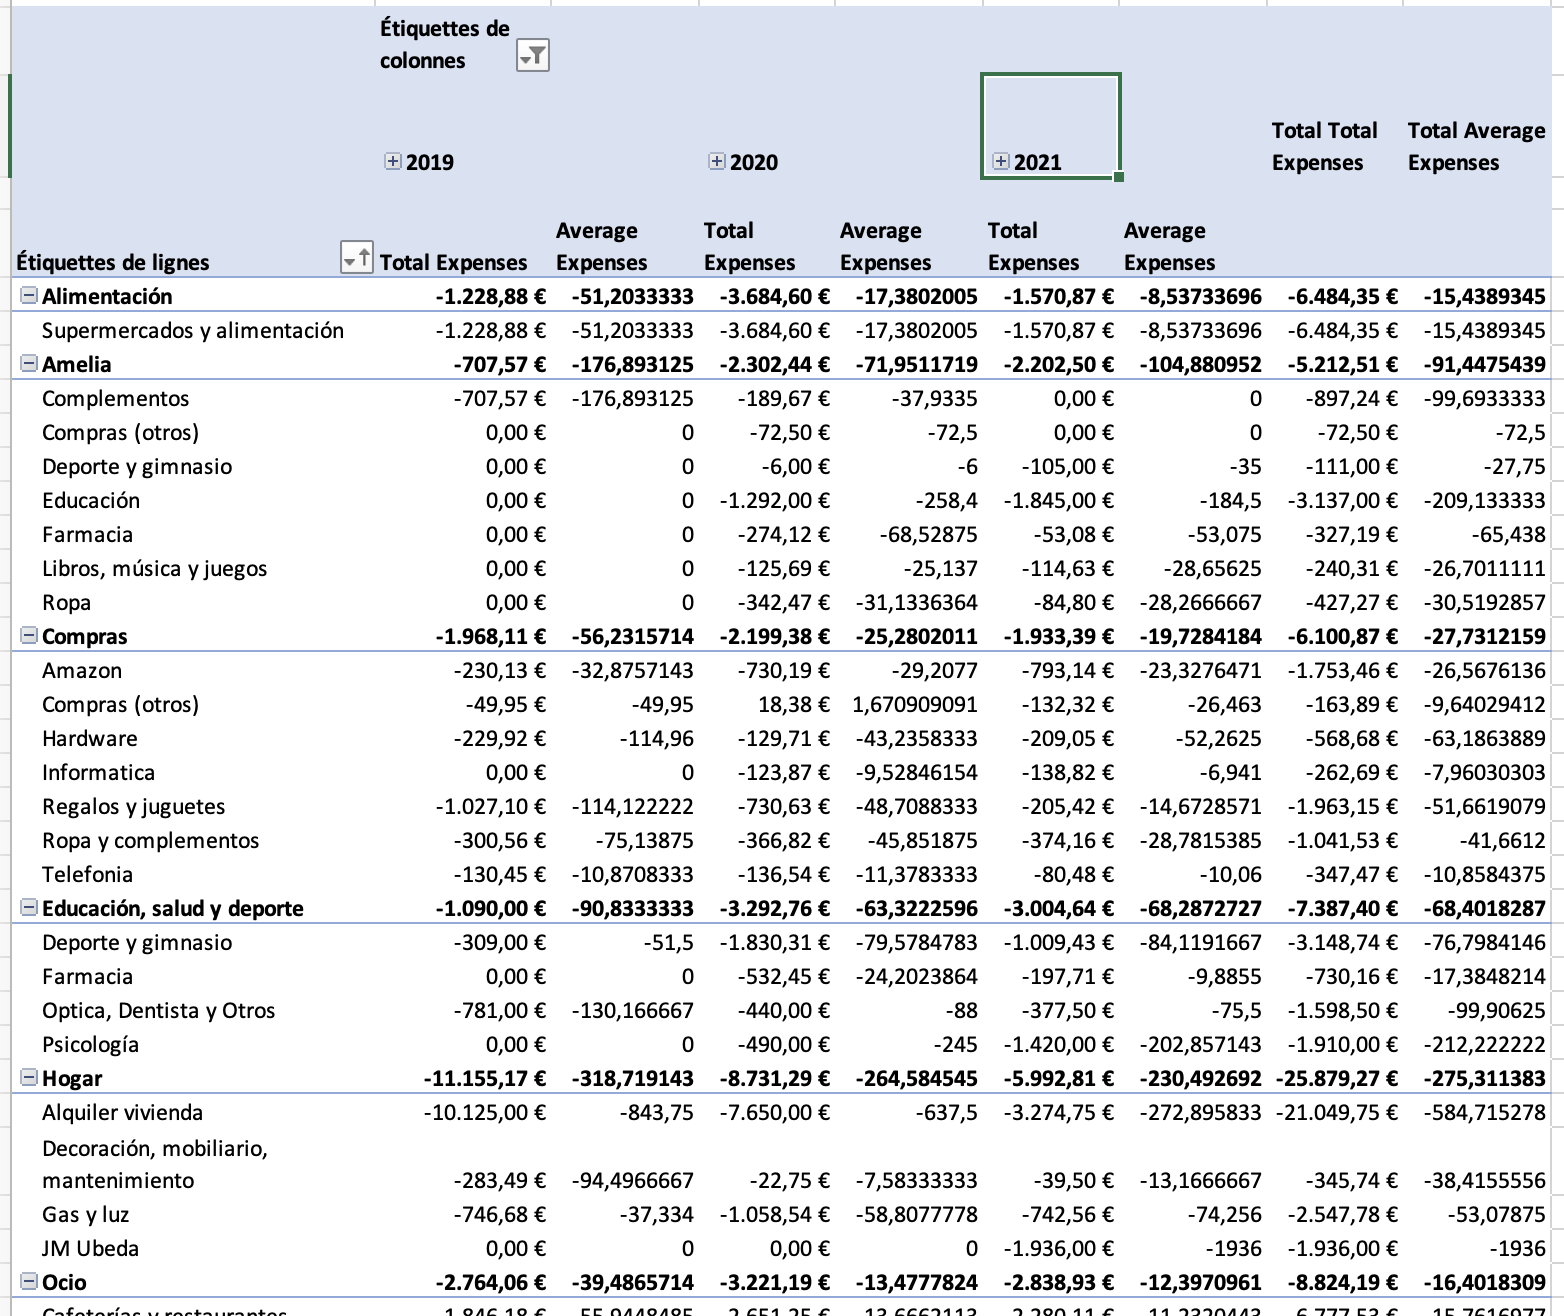
Hi, I have a table with all my daily expenses (that I extracted from my credit card reports). I made categories and subcategories for these expenses I created a Pivot Table to group these expenses ...
- Aug 25, 2021
That's for Windows:
- creating PivotTable you have an option to add data to data model
- in data model you have an option to add measures
- for above sample measure could be
which we may use in PivotTable.
I attached the file with the sample, you may try to open it. I'm not on Mac, but as I know it doesn't support such functionality. Perhaps something changes recently.
mathetes
Aug 21, 2021Gold Contributor
So my solution (calculate average monthly off to the side) DOES work on the Mac, which is also the environment in which I work.
SergeiBaklan
Aug 21, 2021Diamond Contributor
Not sure it's the same. For example, you have only one $100 expense in May. When average for year 2021 will be 100/8; average for 1H2021 is 100/6; average for 2Q2021 is 100/3 and for other quarters is 0/3. Finally average for May is 100/1 and for other months is zero.
- mathetesAug 21, 2021Gold ContributorIt all depends on how you're using the monthly averages for budget tracking and planning purposes. If, for example, I only have one expense for auto insurance--say $700 in May--but that covers the year's auto insurance, it still is legit to say that the average monthly expense is 700/12 and I might need to plan to accumulate cash at that rate to pay for next year's insurance.
As is often the case, not only does excel offer multiple ways to do the same thing; there are different meanings assigned to the same words: so what do we mean when we talk of "average monthly"? And those definitions of meaning affect the Excel method to resolve. nicolasdaudinAug 25, 2021Copper ContributorHi guys, first thanks to both of you Sergei and Mathetes!
By "average monthly" i mean the total spent during the year divided by the number of months of the year (12 for a finished year, less than 12 if the year is not over). My idea is to compare categories and their spendings. I want a monthly average, not an expense average (I just realized that this is what I get when using the average thing in the pivot table, for example one expense of 6 euros => average is 6 euros. )