updates
876 Topics
Addressing PHP2Shell CVE-2026-109618 and CVE-2026-109619: upgrade guidance and Azure WAF mitigations
Written in collaboration with yuvalpery and Gunjan Jain Introduction Today, two critical remote code execution (RCE) vulnerabilities were disclosed in PHP. We strongly recommend that customers upgrade to a patched version of PHP as soon as possible. Upgrading is the only way to fully remediate these vulnerabilities. Read more on the PHP official website. Microsoft has been part of the coordinated industry response to these vulnerabilities, working alongside the PHP Foundation, Wiz, security researchers, and other industry partners to help protect customers. Azure Web Application Firewall (WAF) has developed mitigations against known exploitation patterns to provide an additional layer of protection while customers apply the PHP security updates. These protections are intended to complement patching and are not a replacement for it. About the vulnerabilities: CVE-2026-109618 - RCE via OOM corruption CVE-2026-109619- RCE via stale global state Both vulnerabilities can be exploited over the network without privileges or user interaction, with a high potential impact on confidentiality, integrity, and availability. The vulnerabilities relate to PHP handling of memory when a request terminates abnormally, for example due to memory exhaustion or a fatal error. Under certain conditions, improper memory handling could allow an attacker to achieve remote code execution. Fixed versions: 8.5.12, 8.4.27, 8.3.36, 8.2.35. Refer to vendor guidancefor patching of different versions of PHP. Recommended action: upgrade PHP We recommend that customers: Upgrade all PHP deployments to a patched version, including virtual machines, containers, base images, and platform runtimes. We suggest prioritizing internet-facing workloads. Rebuild and redeploy container images that include their own PHP runtime, since updating the host does not update PHP inside an image. Migrate to a supported PHP branch if the branch currently in use no longer receives security fixes. Treat the Azure WAF mitigations below as a temporary, supplementary measure. They address a specific technique and do not remediate the underlying vulnerabilities. Azure WAF protection If you are unable to upgrade PHP to a patched version immediately, apply the following mitigations in the interim - Azure Front Door WAF: Apply the mitigation using custom rules for request-side mitigation and enable the managed rule for response-side mitigation. Application Gateway WAF: Apply the mitigation using custom rules for request-side mitigation and enable the rewrite rule for response-side mitigation. Application Gateway for Container WAF: Apply the mitigation using custom rules for request-side mitigation. See below sections for details. Mitigation using custom rules These custom rules can help reduce exposure to selected request patterns associated with exploitation techniques for these vulnerabilities. Depending on application traffic, the rules may result in false positives and affect legitimate requests. They are intended as temporary mitigations and do not replace the need to upgrade PHP. Learn more: Azure WAF custom rules for PHP2Shell mitigation. Request-side signals alone may not be sufficient to reliably identify certain exploitation attempts. Signals in the server response can provide additional evidence that malicious activity has occurred, enabling more targeted mitigation with higher confidence and lower false positives. For this vulnerability, Azure WAF identifies known malicious patterns in the session and removes the potentially malicious elements from the response before it reaches the client. This provides an additional layer of protection for supported exploitation scenarios, while patching PHP remains necessary to fully address the underlying vulnerability. Azure Front Door WAF: managed rule A managed rule to handle potential attack vector in response is currently rolling out for Azure Front Door WAF, expected to complete October 28. Customers who are unable to patch PHP immediately and require interim protection before the rollout completes, contact Microsoft Support to expedite enablement. Once the rule is available, its details are as follows: Rule group: MS-ThreatIntel-Response-CVEs Rule ID: 99006001 Default state: disabled. Customers need to enable the rule. Supported rulesets: DRS 2.0, 2.1 and 2.2. Unlike other WAF rules, this rule does not block or challenge any traffic. When the rule identifies malicious signals in the session that provides strong evidence of exploitation, it removes the potentially malicious elements from the response while leaving the remainder of the response unchanged. Mitigation for this rule takes effect only when the rule action is set to Block on anamoly. Please note that the response side mitigation does not generate WAF log entries or hit counts. Application Gateway WAF: rewrite rule Customers can apply an interim mitigation now using the HTTP header rewrite capability of Application Gateway, which is available on v2 SKUs. A WAF managed rule for Application Gateway is expected to roll out at a later date. Until then, we recommend the following rewrite rule: 1. Create a rewrite rule in a rewrite set associated with your routing rule(s). 2. Add a condition that evaluates the Set-Cookie response header against the following regular expression: ^PHPSESSID=(?:[a-zA-Z0-9\-]|%2[Cc])*(?:[^a-zA-Z0-9\-;%]|%(?!2[Cc]))+[a-zA-Z0-9\-]*[^;]+; 3. Set the action to delete the matching Set-Cookie response header. Alternatively, the header can be set to a replacement value of your choice. Please note that setting a value overwrites the entire header, including attributes such as Path=/;. Additional considerations: The rule applies only to a Set-Cookie header that matches the pattern. Other Set-Cookie headers in the same response are not affected. We recommend validating the rule on a non-production gateway before broader deployment. For further information, see Rewrite HTTP headers and URL with Azure Application Gateway. Application Gateway for Containers (AGC): For PHP workloads behind AGC, upgrading PHP is the recommended remediation. A WAF managed rule for AGC is expected to roll out at a later date. Summary Service Available protection Recommended action Azure Front Door WAF Custom rules, managed rule 99006001 rolling out, expected to complete by 28 October 2026; mitigation using high confidence signals without blocking traffic. Upgrade PHP to a patched version. If you are unable to patch, apply custom rules and contact Microsoft support if the interim protection is needed before the managed rule reaches your profile. Application Gateway WAF Custom rules, header rewrite mitigation available now; managed rule expected to roll out later. Upgrade PHP to a patched version. If you are unable to patch, apply custom and rewrite rule in the interim. Application Gateway for Containers Custom rules, header rewrite not supported; managed rule expected to roll out later. Upgrade PHP to a patched version. If you are unable to patch, apply custom rules. Conclusion Following PHP security guidance and upgrading to a patched version is the recommended and complete remediation. Azure WAF mitigations can help reduce exposure during the upgrade period, and we encourage customers to upgrades at the earliest opportunity. Changelog 10/21/2026 7:00 PM PST – Updated with additional guidance around custom rules15KViews1like3CommentsScale Data Collection Endpoint private connectivity with IP Endpoint Compression - Preview
Scale Azure Monitor Private Link with data collection endpoint IP compression As organizations expand their Azure Monitor deployments, private networking needs to scale with them. For enterprises running large, distributed environments, that can create an increasingly important challenge: how do you grow private monitoring without consuming private IP address space at the same rate? Azure Monitor is introducing private IP endpoint compression for data collection endpoints (DCEs) connected through Azure Monitor Private Link Scope (AMPLS). This capability is designed to reduce the private IP footprint by ~90%-95% associated with DCEs while preserving the Azure Monitor Private Link architecture and the security controls customers already use. The challenge: private monitoring at enterprise scale Organizations often centralize Azure Monitor connectivity through carefully governed hub-and-spoke networks. As these environments grow, they can include monitored resources, data collection rules (DCRs), DCEs, and Log Analytics workspaces distributed across multiple regions. When private connectivity is required, DCEs are connected through AMPLS. The associated private endpoint uses addresses from a customer-managed subnet. As more DCEs are added, this can increase the private IP footprint required for Azure Monitor connectivity and create challenges such as: Increased subnet-capacity planning Additional network-governance reviews Delays when onboarding workloads or regions Provisioning challenges when available subnet capacity becomes constrained More operational complexity in centralized DNS and hub-and-spoke environments As customers onboard more Azure resources to send telemetry over private networks, they need a scalable way to preserve valuable private IP address space without increasing the operational complexity of their network-isolated monitoring environment. Introducing DCE private IP endpoint compression DCE private IP endpoint compression changes how DCE service endpoints are represented behind an AMPLS private endpoint. Instead of having the private IP footprint scale directly with every DCE, the compressed architecture groups compatible DCE service endpoints regionally and allows them to use a smaller, bounded set of private IP configurations. Requests continue to be routed to the intended DCE based on the requested endpoint and the existing Azure Monitor authorization context. The result is a more scalable private-network architecture without introducing a new data collection model. What does this mean for customers? Large enterprises have limited, tightly managed, often fragmented private IPv4 spaces. Private endpoints require IP addresses from customers' private IPv4 subnets. With private IP endpoint compression, all DCEs in a region share 3 regional private IPs. For example, 20 DCEs drop from 60 private IPs to 3, which is 95% fewer. Private IP address use stops growing with every DCE you add. There are no changes to how DCEs, DCRs, AMPLS, Azure Monitor Agent or Log Analytics work. Use private address space more efficiently A smaller, bounded private IP footprint can preserve valuable subnet capacity for additional workloads and Azure services. This can be particularly useful for enterprises operating with constrained private IP address space or centralized network-allocation processes. Make network planning more predictable Instead of treating each additional DCE as a proportional increase in private IP requirements, network teams can plan capacity around the regional architecture. This approach makes the network planning more predictable for enterprise customers. Scale monitoring across more workloads and regions Reducing pressure on private IP address space can make it easier to expand monitoring across applications, subscriptions, and regions without repeatedly redesigning private endpoint subnets. Reduce operational friction A more compact endpoint representation can reduce the networking work associated with subnet capacity reviews, expansion planning, and Private Link onboarding. What stays the same? One of the goals of this design is to improve network scalability while preserving the Azure Monitor model customers already use. DCE private IP endpoint compression doesn't change: The role of AMPLS as the private Azure Monitor network boundary The role of the private endpoint connecting a virtual network to AMPLS AMPLS Open and Private Only access modes DCR collection, transformation, and routing logic Azure Monitor Agent configuration semantics Log Analytics tables, retention, or KQL query behavior The amount of telemetry ingested into Azure Monitor Application Insights data collection, which doesn't use DCEs Azure Monitor ingestion charges Azure Private Link data-processing charges based on data volume Customers should continue following their existing DNS, routing, network security, public network access, and AMPLS configuration requirements. Preparing for the controlled preview DCE private IP endpoint compression is currently intended for subscriptions participating in a controlled preview. For customers participating in the preview, we recommend starting with a nonproduction or limited deployment. Before expanding the deployment: Map your topology. Understand the virtual networks, peering, AMPLS resources, private endpoints, DCEs, DCRs, workspaces, DNS zones, and supporting subnets involved. Review DNS ownership. Pay particular attention to networks sharing Azure Monitor private DNS zones and use a deliberate AMPLS topology. Establish a baseline. Record your existing private endpoint IP configurations and DCE DNS responses. Confirm regional alignment. Review the relationship between monitored resources, DCE configuration access, ingestion endpoints, and destination workspaces. Review access modes. Confirm the appropriate use of AMPLS Open or Private Only access modes for your security requirements. Validate end to end. Verify DNS resolution, Azure Monitor Agent configuration access, DCR health, ingestion, transformation, and query behavior before expanding the deployment. Looking ahead Bottom line: DCE private IP endpoint compression is designed to make private Azure Monitor deployments easier to scale by reducing the relationship between DCE growth and private IP consumption, while preserving the Azure Monitor and AMPLS architecture customers use today. Customers interested in participating in the controlled preview can contact the author via email with their subscription need to be allowlisted for the preview. This preview is available only to allowlisted subscriptions. To request access, submit your Azure subscription ID through the DCE IP Endpoint Compression preview onboarding form. Wait for Microsoft to confirm that your subscription is preview-enabled before you create the test DCEs. IP compression applies automatically to newly created DCEs in preview-enabled subscriptions. There's no additional setting to enable when you create a DCE or associate it with AMPLS. We look forward to helping customers scale private Azure Monitor deployments while making more efficient use of their network address space. Resources Learn more about designing and configuring private connectivity for Azure Monitor: Scale Data Collection Endpoint (DCE) private connectivity with IP Endpoint Compression (Preview) - Azure Monitor | Microsoft Learn Use Azure Private Link to connect networks to Azure Monitor Learn how Azure Monitor Private Link Scope (AMPLS), private endpoints, and Azure Monitor resources work together to provide private connectivity. Design your Azure Monitor Private Link configuration Review network topology, DNS, AMPLS limits, hub-and-spoke architectures, and other considerations when planning Azure Monitor Private Link. Configure Azure Monitor Private Link Follow the configuration guidance for creating an AMPLS, connecting Azure Monitor resources such as Data Collection Endpoints (DCEs), and connecting the AMPLS to a private endpoint. Prevent IPv4 Exhaustion in Azure - Azure Architecture Center | Microsoft Learn87Views0likes0CommentsSecure Sensitive AI on Azure Confidential Computing with NVIDIA and Protopia
Your most valuable AI use cases often involve your most sensitive information: customer records, claims, clinical notes, and transaction histories. Dedicated infrastructure can offer control, but it can also limit access to flexible cloud capacity. The opportunity is to expand where that work can run without treating data protection as an afterthought. For a team exploring claims review or clinical-note analysis, the question is not simply whether a model can run in the cloud. It is where sensitive information could be exposed along the journey from application to model and back. Enterprises want to run their highest-value inference on the same scalable cloud they already run everything else on. The catch is that the highest-value inference is usually the most sensitive: customer records, claims and underwriting packets, clinical notes, transaction histories. Data policy keeps that work off shared, multi-tenant capacity and pins it to dedicated, single-tenant deployments. That is the isolation tax: the most valuable, most token-heavy workloads are exactly the ones kept off the infrastructure built to run them, so dedicated capacity sits underused and costs more than it should. Microsoft Foundry already gives this work an enterprise platform: a model catalog that now includes NVIDIA Nemotron, managed and serverless endpoints, and the governance regulated industries require. What has been missing is a way to run sensitive agentic workflows on that shared capacity while reducing the risk of data exposure. The trust dilemma on public cloud Azure Confidential Computing (ACC) addresses a fundamental trust challenge for AI workloads in multi-tenant cloud environments: the model, infrastructure, and data may each be owned or controlled by different parties. Model owners need to protect proprietary weights and intellectual property, and data owners need safeguards for sensitive information throughout processing. ACC provides the trusted foundation for addressing these requirements by helping protect models and their execution from unauthorized host access while enabling additional safeguards across the inference data path. The reference architecture brings together Azure Confidential Computing with NVIDIA H100 GPU capabilities and Protopia AI’s Stained Glass Transform to provide layered protection for sensitive AI workloads running at Azure scale. Confidential Computing: securing the model with NVIDIA Confidential Computing is designed to protect data and AI models while they are in use inside the enclave. The NVIDIA Hopper architecture introduced GPU-based confidential computing, extending the hardware trusted execution environment from the CPU to the GPU so that model weights, activations, and execution state remain within an attested boundary and are designed to be inaccessible to the host operating system, hypervisor, and infrastructure operator. NVIDIA device attestation provides cryptographic evidence about the GPU’s identity and security state before keys are released. For a model owner, these controls are designed to restrict access to model IP while the model runs. Enterprises should not have to choose between protecting their models and running them where compute is available and most convenient. NVIDIA has designed Confidential Computing to keep a model’s weights and execution within the GPU’s trusted execution environment, helping proprietary models run on shared infrastructure while limiting access to their IP. Combined with Protopia’s inference data protection on Azure, customers have a path designed to support sensitive AI workloads in the cloud they already trust. Bring confidential inference to Azure Azure brings confidential inference to production scale, surrounding the confidential GPU with the platform an enterprise needs to operate AI. The Azure NCCads H100 v5 series combines 4th-generation AMD EPYC confidential VMs with NVIDIA H100 Tensor Core GPUs to support confidential AI workloads. The trusted execution environment spans the AMD SEV-SNP CPU and the attached H100 in confidential mode, isolating GPU memory and the channel between CPU and GPU. When enabled and properly configured, Confidential Computing is designed to help limit access to unencrypted customer data within that boundary, including the cloud operator. Azure provides tools to help verify and operate the boundary: Microsoft Azure Attestation (MAA) can assess the confidential VM, while Azure Key Vault Managed HSM can be configured to release decryption keys after successful attestation. "Azure was the first cloud to bring Confidential Computing to NVIDIA H100 GPUs, so customers can protect their data in use, even from the cloud operator, while getting the performance they need for AI. Paired with Protopia’s Stained Glass Transform, this reference architecture protects data across the full inference path, helping regulated organizations bring their most sensitive agentic workloads to Azure.“ - Vikas Bhatia, Head of Product, Azure Confidential Computing, Microsoft Protecting the inference data path Confidential execution does not, by itself, cover every component of a managed inference service. Gateways, logs, traces, caches, and scheduler metadata can sit outside the trusted execution environment. Protopia AI’s Stained Glass Transform (SGT) converts sensitive inputs into protected representations inside the data owner’s trust boundary. The architecture is designed for downstream components to receive those representations, not the original inputs. An SGT-enabled model reasons over them directly, without a host-side decoder. Security teams should inspect the serving layer to verify that this pattern is implemented as intended. This distinction matters when reviewing a service: an attested GPU does not establish how a gateway or cache handles requests. Start with a map of the data flow, then check the controls at each boundary. “Sensitive AI should not automatically mean having to operate every part of the infrastructure yourself. Applying Stained Glass Transform inside the data owner's trust boundary, or within confidential execution on Azure, offers a way to securely deploy to the cloud without exposing sensitive data to the model hosting environment (other tenants or operator), and retaining the data owner's control over their sensitive enterprise data.” - Eiman Ebrahimi, Co-Founder and CEO, Protopia AI From customer boundary to confidential inference At the data owner’s trust boundary, the Stained Glass Proxy, an OpenAI-compatible sidecar, applies the Stained Glass Transform to the prompt and its context, with no changes to the upstream stack. In transit to Azure, the architecture sends the protected representation beyond the customer’s trust boundary rather than the original plaintext input, reducing the likelihood that sensitive plaintext is captured in downstream logs, caches, or interception points. In-transit encryption is used as standard. On Azure NCCads H100 v5 confidential VMs, the request reaches an SGT-enabled model endpoint. Configure and verify confidential execution, attestation, and key-release policies for the chosen serving stack. Across the serving path, verify that components outside the execution boundary handle protected representations rather than original sensitive inputs, including logs, caches, and traces. On return, the client receives a result intended to be interpretable within the data owner’s environment. Expand your options for sensitive AI For enterprises, the value comes down to expanding where sensitive AI workloads can run while maintaining strong protections for models and data. Azure Confidential Computing provides a trusted foundation for running sensitive AI workloads on Azure, helping protect models and data while in use and enabling organizations to take advantage of Azure’s scalable GPU infrastructure. Depending on the workload and deployment configuration, this approach may provide greater infrastructure flexibility and utilization while helping organizations manage performance, model quality, and cost. Learn more Azure Confidential GPU Options
Microsoft at OCP Global Summit 2026
At OCP Global Summit 2026, Microsoft will showcase how we’re advancing the infrastructure needed to scale AI, from silicon and systems to the datacenter. Visit Microsoft at booth C73 At Booth C73, get a closer look at Cobalt 200 and Maia silicon, advanced cooling, sustainability demonstrations, and security technologies, and hear from Microsoft leaders and experts through our keynote and sessions, panels, and workshops across the summit. Purpose-built silicon • Cobalt 200 • Maia 200 • Maia 300 • Azure Boost Cooling • 3rd Gen Azure Heat Exchange Unit Sustainability • DC Waste Heat Recovery • Circularity Server Reuse Security • Caliptra 2.2 and Platform Attestation • Baremetal Architecture Hardware Partitioning • Integrated HSM Fleet reliability • OCP RAS API demo • Debug and diagnostics Featured Sessions KEYNOTE Intelligence Infrastructure: Scaling AI for the Frontier Era October 13 · 9:15 AM - 9:35 AM · SJCC, Street Level, South Hall AI infrastructure depends on co-design across silicon, systems, software, and sites. This keynote examines how Microsoft brings those layers together to build scalable, reliable, and efficient infrastructure with security embedded throughout. It explores the path from technology development to a global fleet, how requirements change at scale, and how those lessons shape next-generation platforms. The session also considers sustainable scaling through closed-loop cooling and lower-carbon construction, the role of grid reliability and workforce development in host communities, and the challenges that call for ecosystem innovation. EXECUTIVE SESSION Powering the AI Era: Building Sustainable and Efficient Infrastructure at Cloud Scale October 12 · 2:30 PM - 2:50 PM · SJCC, Concourse Level, 210AE The explosive growth of generative AI is driving an unprecedented increase in demand for computing infrastructure. As AI workloads scale from training to widespread inference, every layer of the cloud stack is being challenged, from power grids and datacenters to servers, silicon, and software systems. Meeting this demand sustainably requires rethinking how computing infrastructure is designed, operated, and optimized. Microsoft Breakout Sessions, Panels, and Workshops Explore Microsoft daily sessions and hear from experts shaping the future of cloud and AI infrastructure. Tuesday, October 13 9:55 - 10:00 AM KEYNOTE Women in OCP (WOCP) - Community First, AI Forward Speakers: Sung Kim - BP Castrol, Shruti Sethi - Microsoft, Allison Boen - Alcatex and Shell Fluid, Anu Ramamurthy - Microchip Location: SJCC - Street Level - South Hall 1:15 - 1:35 PM PRESENTATION | OIF Workshop Enabling AI Scale-Up: Why Standards Matter and the Need for Industry Alignment Speakers: Fotini Karinou - Microsoft Location: SJCC - Lower Level - LL20BCD 1:45 - 2:00 PM PRESENTATION | Networking Switch Platform Architecture: A Unified Network Switch Platform Reference Design Speakers: Tao Ren - Meta, Ying Xie - Microsoft Location: SJCC - Concourse Level - 210AE 1:50 - 2:15 PM PANEL | AI Open Data Center Beyond the Build: Autonomous Robotics and the Future of Data Center Operations Speakers: Shashank Gupta - Fleet Data Centers, Eric Xu - Meta, Rob Lawson-Shanks - Molg, Evan Johnson - Microsoft; Moderator: Joel Chakkalakal - PHS West Location: SJCC - Concourse Level - 210CG 1:55 - 2:20 PM PRESENTATION | Manageability Workshop Redfish Aliasing Support and Redfish Streaming Telemetry Enhancements Speakers: Bill Scherer - HPE, Hari Ramachandran - Microsoft Corporation, Jeff Autor - Vertiv Location: SJCC - Lower Level - LL21BC 2:20 - 2:45 PM PANEL | AI Open Data Center Material Handling Automation for Next-Generation Datacenter Operations Speakers: Rachel Soukup - Google; Ben Wong - Meta; Amir Porter - Microsoft; Moderator: Evan Johnson - Microsoft Location: SJCC - Concourse Level - 210CG 2:20 - 2:45 PM PANEL | AI Computing Continuum Two Years of x86 Ecosystem Collaboration: Open Infrastructure, AI Readiness, and Developer Predictability Speakers: Jeff McVeigh - Intel, Stephen Watt - Red Hat, Andrew Wheeler - HPE, Martin Dixon - Google, Jon Lange - Microsoft; Moderator: Robert Hormuth - AMD Location: SJCC - Concourse Level - 211 2:35 - 2:45 PM PRESENTATION | IPEC Workshop IPEC Presentation Speakers: Yawei Yin - Microsoft Location: SJCC - Concourse Level - 230A 3:15 - 3:45 PM PANEL | AI Open Data Center Automation-Ready Infrastructure Design: From Light to Compute Speakers: Mike McKee-Hector - Microsoft, Dave Evans - Google, Ryan Olson - Meta; Moderator: Eric Xu - Meta Location: SJCC - Concourse Level - 210CG 3:50 - 4:05 PM PRESENTATION | Cooling Environments Building a Scalable Waste Heat Ecosystem: Datacenter Waste Heat, Offtakers, and Market Platforms Speakers: Maria Viitaniemi - Microsoft, Bharath Ramakrishnan - Microsoft Location: SJCC - Concourse Level - 220C 4:00 - 4:20 PM PRESENTATION | Manageability Workshop Using SPDM for PLDM Firmware Updates: Authorization Policy and Measurement Manifest Capabilities Speakers: Patrick Caporale - Lenovo, Brett Henning - Broadcom Inc., Scott Phuong - Microsoft Location: SJCC - Lower Level - LL21BC 4:10 - 4:45 PM PRESENTATION | Cooling Environments Heat Reuse Sub-Project Overview and Updates + Economics Tool Contribution Speakers: Aime Comella - DayOne; Jack Kolar - Dataquarium; Gemma Reeves - Alfa Laval; Bharath Ramakrishnan - Microsoft; Ahliana Byrd - Ascentra Innovations Location: SJCC - Concourse Level - 220C Wednesday, October 14 8:00 - 8:25 AM PANEL | AI Open DC: Power Distribution +/-400V / 800V On-Board Power Delivery Requirements Speakers: James Sun - Microsoft, Sachin Madhusoodhanan - Google, LJ (Jian) Lu - Google, Shengwen Xu - Meta; Moderator: Michelle Badal - Google Location: SJCC - Concourse Level - 210CG 8:15 - 9:10 AM PANEL | Systems Management OCP Hardware Fault Management Workstreams Status and Relationship Speakers: Theodros Yigzaw - NVIDIA; Vilas Sridharan - AMD; Janusz Jurski - Intel; Shubhada Pugaonkar - NVIDIA; Samer El-Haj-Mahmoud - Arm; Moderator: Drew Walton - Microsoft Location: Concourse Level - 211 8:15 - 8:35 AM PRESENTATION | SONiC Workshop SONiC Community Year in Review: Powering the Open Network for the AI Era Speakers: Yanzhao Zhang - Microsoft, Xin Liu - Microsoft Location: SJCC - Concourse Level - 230A 8:20 - 8:40 AM PRESENTATION | Storage Comprehensive Testing for OCP Datacenter NVMe SSD Specification Compliance Speakers: Timothy Sharp - Microsoft Corp, Nick Kriczky - Teledyne Lecroy, Rick Walsh - SANBlaze Location: SJCC - Concourse Level - 212 8:25 - 8:50 AM PANEL | Market Impact & Adoption PG25 at Scale: What We've Learned and Where We're Going Speakers: Keegan Yaroch - DOW Chemical, Paul Artman - AMD, Jacob Paugh - ChemTreat, Cam Turner - Microsoft; Moderator: Chris Campbell - Vertiv Location: SJCC - Lower Level - LL21DE 8:30 - 8:50 AM PRESENTATION | OCP Special Focus: Photonics Optical Scale-Up AI Systems: Architectures, Standards, and Resiliency Strategies Speakers: Fotini Karinou - Microsoft, Adrian Motamedi - Microsoft Location: SJCC - Concourse Level - 210AE 8:45 - 9:05 AM PRESENTATION | Cooling Environments Air vs. Liquid: Where Does Air Cooling Still Win for General Compute? Speakers: Jayesh Shah - Microsoft, Stewart Nguyen - Lenovo Location: SJCC - Concourse Level - 220C 9:30 - 9:45 AM SYMPOSIUM: POSTER AND PRESENTATION | FTS: Keynotes & Awards Poster Session Break Speakers: Samir Rajadnya - Microsoft, Oren Benisty - UniFabriX, Konstantin Tiutin - RIVVOR Inc., Timour Paltachev - Rivvor, Nazym Paltachev - rivvor, Sangsu Park - Samsung, Tushar Krishna - Georgia Institute of Technology, Seyyed Ali Ghorashi - Danovo Energy Solutions, Daniel Bauer - LoadCrest, Weipeng Zhang - LightXcelerate Inc, Manchen Hu - LightXcelerate, Xinyu Zhang - XPerf, Rakesh Sambaraju - Infraeo Inc., Xufu Ren - University of Cambridge, Yunqi Zhang - University of Cambridge, Shawn Yan - Vulcadi Inc, David Gyulnazaryan - Impleon, ROGER BASU - Coreshell Technologies, Inc, Fanny Oukhemanou - Syensqo, Taner Dosluoglu - weeteq, Patrick McCluskey - University of Maryland at College Park, Ibaad Gandikota - University of Maryland, Sang woo Ham - Lawrence Berkeley National Laboratory, Sam Abdel-Rahman - Infineon Technologies, Shuyu Zhang - UC Berkeley Location: SJCC - Lower Level - LL20BCD 9:45 - 10:00 AM PRESENTATION | Server Scaling Hyperscale Cloud Networking from 400G to 800G: System Integration Lessons and Implications for OCP Platforms Speakers: Lucy Yu - MSFT, Faye Yang - Microsoft Location: SJCC - Lower Level - LL21BC 9:50 - 10:10 AM PRESENTATION | SONiC Workshop SONiC BMC for Unified Management and Next-Generation Liquid-Cooled Networks Speakers: Judy Joseph - Microsoft, Roger Liao - Nexthop Systems Inc. Location: SJCC - Concourse Level - 230A 10:05 - 10:20 AM PRESENTATION | OCP Special Focus: Photonics System-Level Evaluation of XPO for High-Density Optical Interconnects in AI Infrastructure Speakers: Daniel Mohaghegh - Microsoft, Sunil Priyadarshi - Arista Networks Location: SJCC - Concourse Level - 210AE 10:05 - 10:25 AM PRESENTATION | Market Impact & Adoption Upgrading OCP S.A.F.E. and S.O.L.I.D. for the AI age Speakers: Zahra Lak - Microsoft, Jeff Andersen - Google Location: SJCC - Lower Level - LL21DE 10:10 - 10:30 AM PRESENTATION | Systems Management System-Level Manageability for GPU Platforms — Progress in the OCP System GPU Management Workstream Speakers: John Leung - Intel, Hari Ramachandran - Microsoft Corporation Location: SJCC - Concourse Level - 211 10:40 - 11:00 AM PRESENTATION | SONiC Workshop Democratizing DPU High Availability with a SONiC-Driven DASH HA Control Plane Speakers: Changrong Wu - Microsoft, Sudharsan Dhamal Gopalarathnam - NVIDIA Location: SJCC - Concourse Level - 230A 10:50 - 11:10 AM PRESENTATION | Server Accelerating High-Power Server Design Through Board-Level Electro-Thermal Co-Simulation of VRMs and PDNs Speakers: Steven Chien - Wiwynn Corporation, Zi Ping Wu - Microsoft Location: SJCC - Lower Level - LL21BC 11:30 AM - 1:00 PM PANEL | Meals & Breaks Women in AI Luncheon presented by Women in OCP (WOCP) - Sponsored by Lenovo & NVIDIA Speakers: Casey Moran - Lenovo, Cathie Deal - IREN, Shruti Koparkar - NVIDIA, Shruti Sethi - Microsoft; Moderator: Allison Boen - Alcatex and Shell Fluid Location: San Jose Marriott - Level 2 - Salon III & IV 11:45 AM - 12:00 PM Expo Hall Sessions | SONiC Open, Trusted, and Secure SONiC at Scale presented by Cisco Speakers: Will Eatherton - Cisco; Dina Papagiannaki - Microsoft Location: SJCC – Concourse Level – Expo Hall Theater 12:30 - 12:50 PM PRESENTATION | SONiC Workshop Beyond the T2 PIN: Pizza-Box Disaggregation for Next-Gen Regional Hubs Speakers: Kamini Santhanagopalan - Broadcom, Rita Hui - Microsoft Location: SJCC - Concourse Level - 230A 12:55 - 1:15 PM PRESENTATION | Systems Management Runtime SBOMs: Extending DMTF Redfish to Connect Build-Time and Live Software State Speakers: Harsh Bhuwania - Microsoft, Prashant Dewan - Microsoft Location: SJCC - Concourse Level - 211 1:20 - 1:40 PM PRESENTATION | SONiC Workshop 6–12x Route Programming Acceleration in SONiC: A Collaborative Profiling and Optimization Journey Speakers: Deepak Singhal - Microsoft, Amol Rawal - Nokia Location: SJCC - Concourse Level - 230A 1:20 - 1:50 PM PRESENTATION | Systems Management GPU & CPU Diagnostics and RAS Standardization Advances for Hyperscale Infrastructure Speakers: Rama Bhimanadhuni - Microsoft, Taniya Siddiqua - Advanced Micro Devices, Inc. Location: SJCC - Concourse Level - 211 1:35 - 1:55 PM PRESENTATION | AI Open DC: Power Distribution Designing Safe 800 VDC Systems: Protection, Fault Management, and Operations Speakers: Mike Tu - NVIDIA, Xianyong Feng - Microsoft Location: SJCC - Concourse Level - 210CG 3:15 - 3:35 PM PRESENTATION | Systems Management From Lab to Fleet: A Secure, Unified Debug Framework for Cloud Systems Speakers: Suresh Duthiraru - Microsoft, Rolf Kuehnis - Lauterbach Inc. Location: SJCC - Concourse Level - 211 3:15 - 3:55 PM PANEL | Storage OCP Storage Specifications Update and What Customers Care About Speakers: David Black - Dell Technologies, Timothy Sharp - Microsoft Corp., Chris Sabol - Google, Jeff Wolford - HPE, Vineet Parekh - Meta; Moderator: Ross Stenfort - SanDisk Location: SJCC - Concourse Level - 212 3:40 - 4:00 PM PRESENTATION | SONiC Workshop Extending Community SONiC for Advanced Optics Telemetry Aligned with OCP Standards Speakers: Rajan Pai - Credo, Prince George - Microsoft Location: SJCC - Concourse Level - 230A 3:54 - 5:00 PM SYMPOSIUM: PRESENTATION ONLY | FTI Workshop: Short Reach Optical Interconnects Scale-up optical reliability and GPU/system resiliency to optical link flaps Speakers: Eduard Roytman - Microsoft, Lenin Patra - Marvell, Ashwin Gumaste - NVIDIA, Greg Link - Microsoft, Jeffrey Hutchins - Ranovus Location: SJCC - Lower Level - LL21BC 4:00 - 4:20 PM PRESENTATION | Storage Adopting high-capacity HDDs, navigating throughput and IOPS Limits using SAS/NVME interfaces for the AI Cloud Speakers: Hariharan Kumar - Microsoft, Balaji Natrajan - Microsoft Location: SJCC - Concourse Level - 212 4:10 - 4:30 PM PRESENTATION | Systems Management Operating OpenBMC at Hyperscale: What Works, What Breaks, and What Needs to Change Speakers: Thirupathaiah Annapureddy - Microsoft, Hari Ramachandran - Microsoft Corporation Location: SJCC - Concourse Level - 211 4:30 - 4:50 PM PRESENTATION | SONiC Workshop FIPS 140-3 Support in SONiC Speakers: Kenneth Cheung - Arista Networks, Qi Luo - Microsoft Location: SJCC - Concourse Level - 230A 4:30 - 5:00 PM PANEL | AI Clusters Scale-across Networking: Panel discussion on routing and transport equipment implications Speakers: Jeff Rahn - Meta, Yawei Yin - Microsoft, Xiguang - Henry Wu - Broadcom, Tad Hofmeister - Google; Moderator: Vijay Vusirikala - Arista Networks Location: SJCC - Concourse Level - 220B 4:35 - 5:00 PM PRESENTATION | Systems Management From Scale to Security: Evolving GPU Management Standards in 2026 Speakers: Krishna Sugumaran - AMD, Sujoy Sen - Google, Akkiah (Choudary) Maddukuri - Microsoft, Qian Wang - NVIDIA, Balaji Vembu - Meta Location: SJCC - Concourse Level - 211 Thursday, October 15 8:00 - 8:20 AM PRESENTATION | AI Clusters MX v1.1: Advancing Open Standards for Low-Precision AI with MicroXcaling formats Speakers: Partha Maji - Microsoft Location: SJCC - Concourse Level - 220B 8:00 - 8:25 AM PANEL | Sustainability Updates from an exciting year with the OCP Sustainability Project, DCF Sustainability Project & Roadmap ahead Speakers: Alexander Rakow - Schneider Electric, Sung Kim - BP Castrol, Shruti Sethi - Microsoft, Priya Chhiba - Google Location: SJCC - Lower Level - LL21DE 8:20 - 8:40 AM PRESENTATION | Security Integrated HSM: Bringing Silicon-Level Key Security to the Server Tray Speakers: Craig Barner - Marvell, Vishal Soni - Microsoft, Mohan Kumar - Oracle Cloud Infrastructure Location: SJCC - Concourse Level - 212 8:45 - 9:05 AM PRESENTATION | Test & Validation AI-Native Hardware Validation: Building a Local-Context Agentic Test and Debug Platform Speakers: Wenxi Yan - Microsoft Location: SJCC - Lower Level - LL20BCD 8:50 - 9:05 AM PRESENTATION | Sustainability Performance-Normalized Embodied Rack Carbon Intensity for Next-Generation Hardware Speakers: Kali Frost - Microsoft Location: SJCC - Lower Level - LL21DE 9:10 - 9:30 AM PRESENTATION | Networking ESUN: Open Ethernet for the AI Scale-Up Era Speakers: Pratik Marolia - Microsoft, Manoj Wadekar - Meta Location: SJCC - Concourse Level - 210AE 9:10 - 9:30 AM PRESENTATION | Test & Validation From Spec to Sign-off - How Microsoft is transforming the platform validation workflow leveraging AI-powered, agent-driven solutions. Speakers: Rahul Shah - Microsoft, Vikram Vemulapalli - Microsoft Location: SJCC - Lower Level - LL20BCD 9:10 - 9:30 AM PRESENTATION | Rack & Power Scaling Hyperscale Power Delivery: Managing Aggregated and Cascaded Power Shelf Architectures for High-Density GPU Systems Speakers: Praveen Kumar Velpuri - Microsoft, Yang Hsiung - Microsoft Location: SJCC - Concourse Level - 230A 9:45 - 10:20 AM PANEL | Server: Composable Memory Systems Addressing Memory Wall challenge for AI and General Compute platforms (CMS Sub-Project Technical Update) Speakers: Anjaneya "Reddy" Chagam - Microsoft Corporation, Grant Mackey - XCENA, Mohamad El-Batal - Seagate, Samir Rajadnya - Microsoft Location: SJCC - Lower Level - LL21BC 9:45 - 10:10 AM PANEL | AI Clusters USB to Rule Them All: One Manageability Interface for AI Platforms Speakers: MARIUSZ ORIOL - NVIDIA, Bharat Pillili - Microsoft, Samer El-Haj-Mahmoud - Arm, Mohan Kumar - Oracle Cloud Infrastructure, Supreeth Venkatesh - AMD; Moderator: Kasper Wszolek - NVIDIA Location: SJCC - Concourse Level - 220B 10:45 - 11:30 AM PANEL | Cooling: Cold Plate Pushing the Single-Phase Cold Plate Limit: Design Practice, Field Learnings, and the Runway Before Two-Phase Scales Speakers: Weihua Tang - Google, REMCO VAN ERP - Corintis, Oscar Farias Moguel - Microsoft, Yin Hang - Meta; Moderator: Joel Chakkalakal - Guardian Data- LLC Location: SJCC - Concourse Level - 220C 10:50 - 11:05 AM PRESENTATION | Networking Scaling AI Beyond the Cloud Boundary: High-Capacity Interconnects Between Hyperscalers and GPUaaS NeoClouds Speakers: Krithika Moorthy - Cisco, Anish Narsian - Microsoft Location: SJCC - Concourse Level - 210AE 10:50 - 11:05 AM PRESENTATION | Security Upgrading OCP S.A.F.E. and S.O.L.I.D. for the AI age Speakers: Zahra Lak - Microsoft, Jeff Andersen - Google Location: SJCC - Concourse Level - 212 11:00 - 11:25 AM PRESENTATION | Test & Validation Product Intercept learnings and Compliance measurement for Diagnostics Standardization Speakers: Rajat Madhusudan - Microsoft, Jennifer Lee - Intel Location: SJCC - Lower Level - LL20BCD 11:15 - 11:30 AM PRESENTATION | Sustainability Enabling Scalable Waste Heat Recovery: Operational Realities, Design Principles, and Value from the Datacenter Perspective Speakers: Emily Matys - Microsoft Location: SJCC - Lower Level - LL21DE 12:30 - 12:45 PM PRESENTATION | Security Baremetal Security Architecture Speakers: Bharat Pillili - Microsoft, Darpana Munjal Loodu - Microsoft Location: SJCC - Concourse Level - 212 12:30 - 12:50 PM PRESENTATION | Rack & Power Mitigating AI Training Power Oscillations: Utility Requirements and In-Rack Power Filtering Speakers: Bo Wen - Microsoft, Xianyong Feng - Microsoft Location: SJCC - Concourse Level - 230A 1:15 - 1:30 PM PRESENTATION | Sustainability From Silicon to System: Embedding Power Efficiency as a Core Design Principle for Scalable AI and Compute Infrastructure Speakers: Devang Soparkar - Microsoft, Nilanjan Palit - Intel Location: SJCC - Lower Level - LL21DE 1:45 - 2:00 PM PRESENTATION | Open Platform Firmware (OPF) Dynamic Platform Abstraction for BMC Firmware via Host-Delivered Libraries Speakers: Sarathy Jayakumar - AMD, Rama Bhimanadhuni - Microsoft Location: SJCC - Lower Level - LL20BCD 1:55 - 2:10 PM PRESENTATION | Sustainability Closing the Loop: Structural Steel Reuse in Hyperscale Datacenter Construction — A Scalable Blueprint from Microsoft's Newport Imperial Park Datacenter (CWL01) Speakers: John O’Sullivan - Microsoft, Anjali Bhagat - Microsoft Location: SJCC - Lower Level - LL21DE 1:55 - 2:10 PM PRESENTATION | Security Package-Aware Integrity: From Source-Agnostic Publication to Full-System Attestation Speakers: Felipe Zimmerle da Nobrega Costa - KonaSense, Dhananjay Phadke - Microsoft Location: SJCC - Concourse Level - 212 2:15 - 2:30 PM PRESENTATION | Networking MRC: A Purpose-Built RDMA Transport for AI Training Networks Speakers: Abdul Kabbani - Microsoft, Wael Noureddine - Microsoft Location: SJCC - Concourse Level - 210AE 2:45 - 3:00 PM PRESENTATION | Security BMC-Mediated Platform Composite Attestation via Redfish Speakers: Xiling Sun - Microsoft, Roksana Golizadeh Mojarad - Microsoft Location: SJCC - Concourse Level - 212 2:45 - 3:10 PM PANEL | Sustainability Product Category Rule-style Specification for Life Cycle Assessment on Datacenter ICT-Equipment: Collaborative Progress & Draft publication Speakers: Lisa Rivalin - Meta, Stephan Benecke - Google, Ines Sousa - Microsoft, Vincenzo Ferrero - Amazon; Moderator: Chris Eckstein - Fraunhofer Location: SJCC - Lower Level - LL21DE 2:45 - 3:15 PM PANEL | Open Platform Firmware (OPF) Scaling Memory Safe Security Across Firmware Stack Speakers: Giri Mudusuru - Microsoft, Tim Lewis - Insyde Software, Bertrand Achard - Google, Raj Kapoor - AMD, Oleg Ilyasov - American Megatrends (AMI); Moderator: Murugasamy Nachimuthu - Oracle Location: SJCC - Lower Level - LL20BCD 2:45 - 3:05 PM PRESENTATION | AI Open Data Center The Future of Fuel Cells in Datacenters - High Temperature Fuel Cells. Speakers: Afshin Majd - Microsoft, Priya Chhiba - Google, Alberto Ravagni - Net Zero Innovation Hub Location: SJCC - Concourse Level - 210CG 3:05 - 3:20 PM PRESENTATION | Security Caliptra Subsystem 2.2: USB 2.0 and OCP Streaming Boot Speakers: Caleb Whitehead - Microsoft, Bart Vertenten - NXP Semiconductors Location: SJCC - Concourse Level - 212 3:25 - 3:40 PM PRESENTATION | Security Architectural Masking for PQC: Adam’s Bridge 3.0 Leveraging NTT Linearity Speakers: Mojtaba Bisheh-Niasar - Microsoft, Kiran Upadhyayula - Microsoft Location: SJCC - Concourse Level - 212 3:35 - 4:00 PM PANEL | Sustainability Increasing Rigor in Data Center Carbon Disclosure Speakers: Andrea Desimone - Schneider Electric, Lalit Joshi - Microsoft, Malcolm Hegeman - Google, Miranda Gardiner - iMasons Climate Accord; Moderator: Nalintip Suwannakarn - Meta Location: SJCC - Lower Level - LL21DE 3:45 - 4:00 PM PRESENTATION | Security Beyond Static Identity: Enabling Secure Certificate Refresh in Silicon Roots of Trust Speakers: Emre Karabulut - Microsoft, VISHAL MHATRE - Microsoft Location: SJCC - Concourse Level - 212 Offsite Microsoft Workshops 8:00 AM - 3:00 PM WORKSHOP RAS Workshop (at capacity) Hyperscalers, silicon vendors, and ecosystem partners will collaborate on RAS, Debug, Diagnostics, and Manageability initiatives, focused on aligning current requirements, sharing implementations and tools, and discussing the future direction of key specifications and workstreams. Location: MTV Campus 8:30 AM - 2:00 PM; 2:00 - 5:00 PM WORKSHOP Caliptra and BoF Workshops (at capacity) Members of the open-source silicon security community will collaborate on hardware root of trust technologies and secure silicon initiatives through discussions on ongoing technical work, ecosystem collaboration, implementation experiences, roadmap planning, community engagement, and related open-source security efforts Location: MTV Campus Learn more Infrastructure for the frontier era: Scaling intelligence through open industry collaboration Advancing hardware security with open-source Integrated HSM technology Powering Azure Infrastructure from Grid to Chip Advancing AI fleet reliability through industry collaboration Networking for the AI Era: Building for Scale, Efficiency, and Openness1.4KViews0likes0CommentsRun an Ollaya decision model on Azure Container Apps
Many AI calls are not really conversations. A support message needs an intent. A workflow needs a route. A policy check needs a yes or no. An agent needs to select its next action from a known list. These are bounded decisions, but they are often sent to a general-purpose LLM. The LLM reads the request, generates an answer token by token, and then the application validates and parses the response. That is useful when the task needs reasoning or language generation. It is more machinery than necessary when the only valid answer is one of 60 labels. On September 15, 2026, TypeSafe released Jev, its first public System One Model, in early access. Jev has helped bring attention to models built specifically for decisions: structured state goes in, and typed choices with probabilities come out. Ollaya approaches the same problem from a self-hosted direction. It is a model runtime that can serve open decision models, including the winnow:e4b model used here. Jev and Ollaya are not connected products. Jev is a hosted model from TypeSafe; Ollaya provides a way to run decision models in infrastructure you control. They are related by the kind of work they target. What decision models are good at A decision model scores predefined options rather than generating open-ended text: Decision model Traditional LLM Selects from allowed choices Generates text Returns a probability for each decision Usually returns one generated answer Has a bounded, typed output Needs schema constraints and validation Supports confidence thresholds Often needs a separate confidence strategy Fits classification, routing, scoring, policy, and prioritization Fits generation, summarization, coding, and open-ended reasoning That narrower interface creates several practical benefits: Predictable outputs: the application receives an allowed value rather than text that must be repaired or parsed. Lower decision latency: there is no autoregressive output sequence to generate. Token savings: a decision can be returned without generating output tokens. Useful uncertainty: calibrated probabilities let the application act, reject, or escalate. Smaller infrastructure: a specialized model can fit on hardware that would be modest for a general LLM. Decision models are not replacements for every LLM call. They make sense when the possible outcomes are known before the request arrives. An LLM remains the better tool when the output itself is language, code, or open-ended reasoning. Why Azure Container Apps serverless GPU Azure Container Apps serverless GPUs make self-hosted inference feel much closer to consuming a managed API. You bring the container and model; Azure manages the underlying GPU infrastructure. The Consumption GPU profile provides: NVIDIA T4 or A100 GPUs without managing GPU nodes or a Kubernetes cluster. Automatic scaling with the option to scale to zero. Per-second GPU billing while replicas are running. Container Apps networking, identity, ingress, logging, and revision management. A private inference path where the model and request data stay inside your Azure environment. That last point matters for data-sensitive decisions. In the Ollaya-only configuration, text is sent to an internal Ollaya endpoint rather than an external model API. The model, API, persistent cache, and operational controls remain in the application's Azure environment. Serverless does not remove the need to think about cold starts. A model still needs to be loaded into VRAM. For low or sporadic traffic, scaling to zero can avoid idle GPU cost. For latency-sensitive traffic, a warm minimum replica avoids making a user wait for the model to load. Azure Files can retain the model layers across revisions so a new deployment does not download the full model again. The T4 is also an important part of this experiment. It is not the largest GPU available, but the goal is not to run the largest model. The goal is to match the hardware to a model designed for the task. A focused decision model on a T4 can compete with a hosted API when the workload is a bounded classification rather than text generation. The experiment I deployed winnow:e4b through Ollaya on an Azure Container Apps Consumption-GPU-NC8as-T4 workload profile. An authenticated API exposed the classifier while Ollaya remained on internal-only ingress. A second path sent the same requests to GPT-5.4 Nano through Azure OpenAI using managed identity. The evaluation used the complete 2,974-record test partition from Amazon MASSIVE 1.1. It contains 18 scenarios and 60 intents. Both providers received the same records, labels, and descriptions. The benchmark measured latency at concurrency 1 and throughput at concurrency 8. Providers and modes ran sequentially so one measurement did not load the service used by another. This was not a direct benchmark of Jev; it tested the same decision-model pattern with an open model that could run inside the Azure environment. What the results showed The benchmark ran on September 30, 2026. Provider Successful Intent accuracy Macro-F1 p50 p95 Winnow on T4 2,974 / 2,974 75.59% 76.40% 946 ms 960 ms GPT-5.4 Nano 2,974 / 2,974 79.12% 78.07% 1,369 ms 2,489 ms Nano led intent accuracy by 3.53 percentage points. Winnow was 30.9% faster at p50 and 61.4% faster at p95. This is the useful T4 result: a smaller GPU running the right specialized model matched and beat the hosted endpoint on response latency, though not on accuracy. At concurrency 8, Nano delivered 1.367 requests per second compared with Winnow's 1.120. Nano also had 25 requests fail after eight retries because the deployment exceeded its token-rate limit. Winnow completed all 2,974 requests, but its single loaded runner serialized work and increased queue time. The token comparison shows what the decision-only path removes: Provider, both benchmark passes Input tokens Cached input tokens Output tokens Winnow on T4 9,252,872 0 0 GPT-5.4 Nano 8,501,200 7,564,800 122,759 Winnow returned every decision without generating output tokens. Nano generated 122,759 output tokens across the latency and throughput passes. The rows do not represent equivalent billing models: Winnow consumes self-hosted GPU time, while Nano is metered by hosted token usage. The comparison isolates the generated tokens that a bounded decision did not need. Winnow also returned calibrated probabilities. At a 0.90 threshold, it accepted 53.73% of the records and was correct on 94.43% of those accepted decisions. An application could handle that high-confidence group locally and send only the uncertain remainder to an LLM or human reviewer. In brief A decision model is useful when software needs a bounded answer rather than generated language. In this experiment, Winnow on a serverless T4 traded some accuracy for lower latency, zero generated output tokens, private inference, and an explicit confidence signal. The practical design is often a combination: use the decision model for fast, high-confidence choices and reserve LLM calls for uncertain or open-ended work. Try it with the template The Azure Developer CLI template packages the Container Apps environment, T4 workload profile, authenticated API, internal Ollaya service, persistent model cache, GPU readiness checks, and benchmark. It supports two deployment modes: Mode What it deploys ollaya-only Private Winnow inference on a serverless T4 plus the authenticated API full The Ollaya deployment, GPT-5.4 Nano, and the comparison benchmark Read the deployment guide Inspect every benchmark prediction and retry Review the shared MASSIVE taxonomy712Views0likes0CommentsScaling distributed AI infrastructure with Azure’s ExpressRoute and AI Points of Presence (AI PoPs)
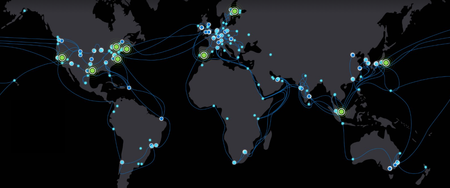
Rethinking connectivity for distributed AI infrastructure AI is changing more than the applications organizations build. It is reshaping where the infrastructure powering those applications is deployed. For years, cloud computing has been anchored by hyperscale regions that combine compute, storage, networking, security, and operations at massive scale. That model remains foundational to Microsoft Azure. At the same time, rapid AI growth is creating a more distributed infrastructure landscape. GPU capacity is increasingly being deployed across regions, providers, facilities, and operating environments wherever the right mix of power, space, cooling, and specialized infrastructure is available. That shift creates a practical challenge: how do organizations bring new GPU capacity online quickly while still giving AI workloads the Azure services, governance, security, and operational consistency they require? Microsoft’s approach: extending Azure to distributed AI infrastructure Microsoft is taking a platform approach to distributed AI infrastructure. For customers, Azure ExpressRoute offers the private connectivity experience for connecting remote sites and infrastructure to Azure. Behind that experience, AI PoPs provide Microsoft with a standardized infrastructure architecture for integrating distributed third-party GPU capacity into the Azure network and operating environment. Rather than building a unique network and operational integration for every external GPU deployment, Microsoft can use AI PoPs to onboard and aggregate GPU capacity wherever the GPUs may be, while customers continue to connect through familiar Azure networking products such as ExpressRoute. Azure ExpressRoute provides the private connectivity foundation for these customer-managed environments, enabling external GPU infrastructure to connect privately with Azure without traversing the public internet. Combined with the AI PoP architecture, this creates a repeatable model for integrating distributed GPU capacity with Azure, giving customers greater flexibility in where compute comes from while maintaining Azure as the platform connecting their AI environment. Based on current Microsoft deployment and provisioning data, Azure’s AI PoP operating model is already connecting and provisioning hundreds of thousands of GPUs across North America, Europe, and Asia Pacific, giving select preview customers a consistent Azure experience for using distributed AI infrastructure. The aim is simple: bring AI capacity to market faster, wherever it is located, while expanding the range of GPU providers and deployment locations. Customers receive a more consistent Azure experience regardless of where that capacity is located. Figure 1. Global deployment of Microsoft’s AI PoP infrastructure Microsoft is expanding AI PoPs to more than 10 planned sites across North America, Europe, and Asia over the next 12 months. Connecting distributed GPUs for faster connectivity and simpler operations for our customers AI workloads depend on more than chips. They need data, orchestration, identity, monitoring, security, and reliable high-bandwidth connectivity. ExpressRoute provides customers with private, high-bandwidth connectivity to Azure. Behind the scenes, AI PoP infrastructure helps Microsoft integrate and operate distributed third-party GPUs at scale. Together, this architecture can help customers: Connect privately to Azure: Use Azure ExpressRoute for private connectivity from remote sites and distributed infrastructure to Azure. Access distributed GPU capacity: Take advantage of GPU capacity across an expanding ecosystem of infrastructure providers without requiring customers to consume AI PoPs as a separate service. Use familiar Azure services: Connect workloads with Azure storage, orchestration, AI services, security, and operational tooling. Maintain a consistent Azure experience: Use established Azure networking and cloud services even as the physical GPU infrastructure becomes more distributed. For customers, this means less bespoke connectivity work and more focus on putting AI capacity to use. AI PoPs is part of the Microsoft infrastructure that enables Azure to integrate third-party GPU capacity into this experience, with ExpressRoute as a customer-facing service. For infrastructure providers, it creates a clearer path for integrating specialized GPU environments with the Microsoft Cloud. One Azure operating model, wherever AI capacity runs As GPU capacity becomes more distributed, customers should not have to adopt a new connectivity model for every provider or location. Azure ExpressRoute provides the customer connectivity experience, while AI PoPs give Microsoft a repeatable infrastructure architecture for integrating third-party GPU capacity into the Azure network and operating environment. That distinction matters as AI infrastructure spreads across regions and providers. Customers need flexibility in where capacity comes from, along with a reliable way to operate that capacity as part of a broader cloud environment. Microsoft is extending this model across regions to support Azure-connected AI capacity. The key principles behind the model are shown below (Figures 2–4). Figure 2. Example of aggregating capacity across multiple locations A single AI PoP can connect multiple GPU facilities and providers. Instead of treating each deployment as a unique project, new capacity can be onboarded through an established framework. This simplifies expansion, enables Microsoft to bring new capacity online faster, and makes it easier to scale as demand grows. Figure 3. Private connectivity to Azure services through Azure ExpressRoute and AI PoPs GPU capacity alone does not create an AI platform. Training and inference environments also depend on data, applications, orchestration, security, monitoring, and AI services. When GPU infrastructure sits outside Azure, the network becomes the critical bridge between compute and the Azure services it depends on. For customer-managed deployments, Azure ExpressRoute provides private connectivity between external infrastructure and Azure without sending traffic over the public internet. AI PoPs build on this connectivity model to provide a consistent approach for integrating distributed GPU environments with Azure services. Figure 4. AI PoPs deliver a consistent operating model Whether capacity is supplied by Microsoft, partners, or customers, AI PoPs are designed to provide a consistent connectivity and management experience. Standardization simplifies deployment, improves repeatability, and reduces the redesign required when introducing new providers or locations. Together, these design principles can reduce onboarding time, expand infrastructure choice, and provide a consistent Azure-connected experience. Looking ahead Demand for AI infrastructure continues to accelerate. Microsoft’s focus is not only on adding capacity, but also on making capacity available wherever it exists through a secure, reliable, and operationally consistent cloud platform. The next phase will focus on onboarding additional GPU providers, strengthening automation, and expanding Microsoft's ability to integrate distributed AI infrastructure with Azure. As AI PoP infrastructure scales behind Azure, customers can continue to use established Azure products such as ExpressRoute to privately connect remote sites and workloads, while gaining access to a broader ecosystem of distributed GPU capacity. As AI infrastructure becomes increasingly distributed, the ability to onboard capacity quickly, operate consistently across environments, and deliver a seamless Azure experience will become a meaningful differentiator. AI PoPs are one way Microsoft is helping shape that future.1.6KViews1like0CommentsMeet the Hosted Skills Canvas: Build, Run, and Debug in GitHub Copilot
Build, run, and debug event-driven AI apps right inside GitHub Copilot. The new Azure Functions Hosted Skills canvas brings instructions, triggers, and live results into one workspace—so you can spend less time switching tools and more time building. 874Views2likes0Comments
Catalyst: Frontier stories of AI Infrastructure innovation
In the Catalyst series, we explore the transformative power of AI by showcasing visionary companies driving scientific and industry breakthroughs powered by Azure and NVIDIA. This video series spotlights how innovation ignites action and how today’s visionaries are shaping tomorrow with the power of AI and cloud innovation. Building resilience against extreme weather Tomorrow.io turns space-based data into AI-driven forecasting powered by Azure and NVIDIA at a global scale. Its high-performance AI models deliver real-time weather intelligence that helps governments and enterprises anticipate disruption, optimize operations, and act faster in the face of severe events. Expanding access in preventative healthcare Powered by Microsoft Azure and NVIDIA, Helfie uses multimodal AI to transform smartphone selfies into intelligent health screening at scale. By combining advanced models with real-time inference, it delivers rapid biometric insights that help identify risks earlier and expand access to remote and underserved communities. How AI is mapping the tree of life Powered by Azure and NVIDIA to build the world’s largest biological databases, Basecamp Research is decoding the complexity of biology to accelerate scientific breakthroughs. Building the next frontier of data Powered by Microsoft Azure and NVIDIA, Global Objects is digitizing the real world by creating high-fidelity digital twins of over 5 million physical items. These photorealistic 3D models are transforming immersive content creation across Hollywood, gaming, robotics, and cultural preservation. Changing how doctors diagnose diseases with AI Powered by Microsoft Azure and NVIDIA, Pangaea Data is closing care gaps by identifying untreated and under-treated patients across rare and hard-to-diagnose diseases faster, earlier, and more accurately. Learn more The Catalyst series explores how organizations are using AI infrastructure to tackle some of their most complex technical and business challenges, from accelerating scientific discovery to advancing autonomous systems and transforming core industries. Learn more about Catalyst. Learn more about Azure AI infrastructure.256Views2likes0CommentsConnect Azure Functions to more services with managed connectors
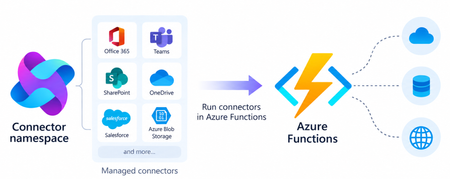
Azure Functions can already connect to many Azure services through triggers and bindings. With managed connectors, your functions can access about 1,700 connectors across services such as Microsoft 365, Microsoft Teams, Dataverse, SharePoint, OneDrive, and third-party systems. Connector triggers deliver events from these services to your function, while typed connector clients let your code take actions against them. You get this broader integration surface without writing the webhook registration code or managing the OAuth tokens required to connect to each service. Focus on your function's business logic and let Azure Connector Namespace handles the connection. Azure Functions integration with Connector Namespace is currently in public preview. It supports .NET isolated, Python, and Node.js. Review the managed connectors overview for current language, hosting plan, and regional availability. To demonstrate how connector triggers and actions work together, this article follows a .NET sample that automates RFP intake across SharePoint, Azure Content Understanding, and Teams. From an uploaded RFP to Teams notification Consider an organization that receives requests for proposals (RFPs) in a shared SharePoint document library. Someone must read each document, identify the requested capabilities, determine which subject-matter experts should respond, and notify the right team. The automated RFP intake sample turns that process into an event-driven workflow: A customer uploads an RFP to a SharePoint document library. A SharePoint connector trigger invokes an Azure Function when the file is created. The function uses a typed SharePoint connector client to retrieve the file contents. Azure Content Understanding extracts the document’s text and layout. The function applies deterministic rules to identify the customer, required capabilities, and recommended subject-matter experts. The function uses a typed Teams connector client to post the results as an Adaptive Card in a channel. Connector Namespace manages the SharePoint and Teams connections. The function controls file processing, document analysis, routing rules, error handling, and notification content How the sample works The .NET sample demonstrates both parts of the connector programming model: a connector trigger receives an event from SharePoint, and typed connector clients provided by the Connector SDKs to perform actions against SharePoint and Teams. The function starts when the SharePoint When a file is created trigger detects a new RFP. It declares the trigger using the ConnectorTrigger attribute and receives a typed payload containing the file’s properties: [Function("OnNewFile")] public async Task OnNewFile( [ConnectorTrigger] SharePointOnlineOnNewFileItemsTriggerPayload payload, CancellationToken cancellationToken) { // Process the newly uploaded file. } Because the trigger provides file properties rather than its contents, the function uses a typed SharePoint client to retrieve the document: byte[] response = await _sharePoint.GetFileContentAsync( Uri.EscapeDataString(siteAddress), fileIdentifier, cancellationToken: cancellationToken); byte[] document = SharePointFileContent.Decode(response); The SharePoint and Teams clients are registered through dependency injection. Each client uses the runtime URL of its Connector Namespace connection and authenticates with DefaultAzureCredential: services.AddSingleton( new SharePointOnlineClient( new Uri(sharePointRuntimeUrl), credential)); services.AddSingleton( new TeamsClient( new Uri(teamsRuntimeUrl), credential)); The function sends the document to Content Understanding’s prebuilt-layout analyzer, which extracts its text and structure. It then applies deterministic C# rules to identify the customer and required capabilities and map those capabilities to predefined subject-matter expert roles. Finally, the function creates an Adaptive Card containing the results and posts it to the configured Teams channel with the typed Teams client: await _teams.PostCardToConversationAsync( postAs, postIn, request, cancellationToken); Connector Namespace handles the SharePoint and Teams connections, while the function controls the document analysis, routing logic, error handling, and notification content. Try the sample The RFP intake sample includes the function code, Bicep infrastructure, Azure Developer CLI configuration, and supporting scripts. Its README explains how to test the workflow locally and deploy it to Azure. Common connector patterns Managed connectors are useful when a function must react to events or perform operations in external systems. Common patterns include: Event to action: React to an event in one service and take an action in another. Event to enrich to action: Retrieve additional information related to an event before acting. Event to document analysis to action: Extract text and structure from a document, apply application rules, and send the result through another connector. Event to AI to action: Analyze event data with an AI service and write the result back through a connector. Extend an existing function app: Add connector-based integrations alongside HTTP, timer, queue, Service Bus, Event Grid, or Durable Functions workloads. The RFP sample combines several of these patterns. A SharePoint event starts the workflow, a SharePoint action retrieves the document, Content Understanding extracts its contents, application code enriches the result, and a Teams action sends the notification. Closing thoughts Managed connectors extend the external systems that can trigger your functions and the services your function code can act on. This brings services such as SharePoint, Teams, Microsoft 365, and many third-party systems into the Azure Functions programming model without requiring you to build the underlying webhook and OAuth infrastructure. Choose Azure Functions with managed connectors when you want this broader integration surface in a code-first application and need custom branching, application libraries and SDKs, other Functions bindings, document or AI processing, or application-specific logic between the trigger and action. If the workload primarily orchestrates connector operations, involves little custom code, and would benefit from a visual designer, Azure Logic Apps is usually the simpler choice. Resources Documentations Overview of managed connectors in Azure Functions Azure Functions connector samples Azure Connector Namespace overview Content Understanding prebuilt-layout analyzer Connector SDK GitHub repos .NET SDK Python SDK Node.js SDK423Views0likes0Comments