troubleshooting
125 Topics101 of Troubleshooting SQL Server on Linux
Based on our extensive experience with customers using SQL on Linux, we have compiled a guide outlining fundamental troubleshooting steps and available tools to assist in resolving SQL on Linux issues. This guide aims to make it easier for SQL DBAs who have primarily worked on Windows operating systems over the years. In this article, we will normalize three checks in Linux that we typically perform in Windows to start troubleshooting issues with SQL Server: System logs SQL Server logs Task Manager Note: The screenshots in the below examples are taken from RHEL and Ubuntu machines, and while the Linux flavors are different, the commands are similar in both environments. System logs: It contains the log messages that the system processes and applications, and these messages are written as plain text log files. The rsyslog service keeps various log files in the /var/log directory. You can open these files using native commands such as tail , head , more , less , cat , and so forth, depending on what you are looking for. In RHEL and SLES, they are called messages, while in Ubuntu, you would find them as syslog. RHEL and SLES: The primary system log file is located at /var/log/messages . Ubuntu: The main system log file is /var/log/syslog . Log files and journals are crucial to a system administrator's work. They reveal a great deal of information about a system and are instrumental during troubleshooting and auditing. For example, in RHEL, to display boot and other kernel messages, view /var/log/messages : [server]$ cat /var/log/messages Use grep and other filtering tools to gather more specific events from a file. You can also use tail to view files as they are updated. [server]$ tail -f /var/log/messages Check the /var/log/secure file to view users and their activities: [server]$ tail -f /var/log/secure Similarly in Ubuntu, we have /var/log/syslog What does the syslog or messages file contain? how do we read them? These log files contain events and messages generated by the kernel, applications, and users that log into the system. The logs are written in the below format. The timestamp indicates the time when a log entry was created in the format MMM dd HH:mm:ss. Notice that this format does not include a year. Hostname is the host or system that originally create the message. Application is the application that created the message. Message contains the actual details of an event. Since the message/syslog could contain thousands/millions of lines as log entries, using 'cat' command alone might not be the right choice at times. I suggest using grep for filtering text through the files. Using tail -f command allows you to read the current log file in real time. You may combine it with 'grep' to filter on desired text. An alternate method to validate the system events is via the journald Systemd-journald : journald is a component of systemd responsible for handling logging. It captures logs, records them, and makes them easy to find. Unlike traditional syslog implementations, journald offers features like structured logging, indexing for fast search, access control, and signed messages. The systemd-journald service does not keep separate files, as rsyslog does. The idea is to avoid checking different files for issues. Systemd-journald saves the events and messages in a binary format that cannot be read with a text editor. You can query the journal with the journalctl command. journald stores logs in memory (RAM) without persistent storage (by default), while the Traditional syslog (e.g., /var/log/messages) persists log data to flat files. To show all event messages, use: [server]$ journalctl To view journal entries for today, use: [server]$ journalctl --since today To check for messages related to the sql server service for the past hour, you can run: journalctl --unit mssql-server.service --since "1 hour ago" SQL Server Error logs: The error log contains informational messages, warnings, and information about critical events. The error log also contains information about user-generated messages and auditing information such as logon events (success and failure).In Linux the default SQL Errorlog location is /var/opt/mssql/log (Keep in mind that you will require superuser permissions to traverse these folders and logs.) This is also the default location for XEvents, dump files and trace files. Comparing Error and System Logs Output You can use both the SQL Server error log and the system logs to identify the cause of problems. For example, while monitoring the SQL Server error log, you may encounter error messages that do not contain cause information. By comparing the dates and times for events between these logs, you can narrow the list of probable causes. Consider the following scenario: We receive an alert indicating that the application is unable to connect to SQL following a maintenance activity over the weekend. We log into the server to verify if SQL Server is operational. Upon inspection, we find that the SQL process is not running. We then check the status and attempt to start the SQL Server to see if it comes online. On restarting SQL Server, we observe the following information in the error logs. Next, we need to examine the system event logs, specifically the messages file in RHEL & SLES or the syslog file in Ubuntu, where events are recorded.We can use the following command to retrieve service logs from the recent boot: journalctl --unit mssql-server.service --boot --no-pager By validating the messages or syslog file within the same timeframe, we gather additional information. From the logs, we identify a permission issue on a specific folder or file that is preventing SQL Server from starting. Granting the necessary permissions should resolve the issue. Task Manager: Where is the Task Manager in Linux? There are command-line utilities that provide similar information to what we see in Windows. We will explore the top and htop utilities top The first line of numbers on the dashboard includes the time, how long your computer has been running, the number of people logged in, and what the load average has been for the past one, five, and 15 minutes. The second line shows the number of tasks and their states: running, stopped, sleeping, or zombie.The next 3 lines describe CPU, Memory utilization, Swap Memory of the server. The column details of the process are tabulated as below. To get into the details of a particular process, (In our case SQL Server) we can use the PID to get the further details of the SQL and the tasks that SQL is currently running. To get the child PID of SQLServer, use this short command and run the top command on the pid. pidof sqlservr | cut -d' ' -f1 top -p (pid output of the above command) We can also get them into single command as shown below, top -p $(pidof sqlservr | cut -d' ' -f1) We see the utilization of various tasks within SQL Server, that are consuming the resources. Another utility that provides similar information is htop . The key difference is that htop offers a more user-friendly experience with its use of colors and graphs, compared to the top command. While top and htop provide valuable information, there are additional command-line tools such as vmstat , System Activity Information ( sar ), iostat , and others. I suggest running these commands on your test machines and monitoring the output to become familiar with checking performance metrics on a Linux server. References: SLES: https://documentation.suse.com/sles/12-SP5/html/SLES-all/cha-util.html# RHEL:https://docs.redhat.com/en/documentation/red_hat_enterprise_linux/7/html/performance_tuning_guide/sect-red_hat_enterprise_linux-performance_tuning_guide-performance_monitoring_tools-built_in_command_line_tools Ubuntu: https://manpages.ubuntu.com/manpages/jammy/man1/top.1.html#2.%20summary%20display I hope this serves as a helpful introduction to basic troubleshooting for SQL on Linux.3.5KViews1like0CommentsEffectively troubleshoot latency in SQL Server Transactional replication: Part 1
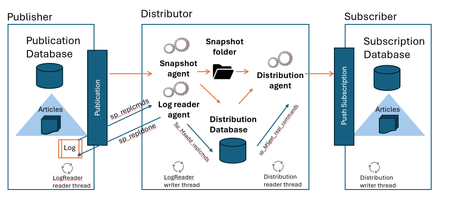
Are you struggling with latency issues in SQL Server Transactional replication? This article provides clear, step-by-step instructions to effectively troubleshoot and resolve these challenges. Dive into proven techniques and best practices that will help you enhance your SQL Server's performance and ensure seamless data replication. Don't let latency slow you down—master the art of SQL Server troubleshooting today! I hope you find this teaser engaging! If you need any adjustments or additional content, feel free to let me know. Thanks to Collin Benkler, Senior Escalation Engineer in Microsoft for SQL Server for his valuable feedbacks.8.5KViews5likes4Comments
SQL Server Database Mail Failure Troubleshooting & Two Common Issues
This blog discusses troubleshooting steps to investigate the failure of SQL Server Database Mail service on sending email. It also discusses 2 special scenarios with SQL Server Database Mail that commonly cause mail sending failure General Troubleshooting Steps to Narrow Down RCA Special Scenarios: Scenario 1: Implicit SSL/TLS mode is not supported for SQL Server DB Mail. If your SMTP server requires implicit TLS, then SQL Server DB Mail will not be able to send email using this SMTP server. Scenario 2: SQL DB Mail failure caused by SMTP mail server requesting TLS 1.2. In this case, TLS 1.2 needs to be enabled at DB Mail server. Commonly Used Protocols and Port ======================== protocol No encryption TLS/SSL TLS/SSL Plain port Explicit port Implicit port FTP 21 21 990 SMTP 25 or 587 25 or 587 465 IMAP 143 143 993 POP3 110 110 995 Telnet 23 23 992 HTTP 80 - 443 General Troubleshooting Steps to Narrow Down RCA ===================================== Check SQL DB Mail errors from DMV and logs /*List all DB Mail event log*/ SELECT * FROM msdb.dbo.sysmail_event_log ORDER BY log_date DESC /*List all failed items */ SELECT er.log_id AS [LogID], er.event_type AS [EventType], er.log_date AS [LogDate], er.description AS [Description], er.process_id AS [ProcessID], er.mailitem_id AS [MailItemID], er.account_id AS [AccountID], er.last_mod_date AS [LastModifiedDate], er.last_mod_user AS [LastModifiedUser], fi.send_request_user, fi.send_request_date, fi.recipients, fi.subject, fi.body FROM msdb.dbo.sysmail_event_log er LEFT JOIN msdb.dbo.sysmail_faileditems fi ON er.mailitem_id = fi.mailitem_id ORDER BY [LogDate] DESC Check and ensure DB Mail has been enabled sp_configure 'show advanced options', 1; GO RECONFIGURE; GO sp_configure 'Database Mail XPs', 1; GO RECONFIGURE GO Check and ensure the SQL Server service account has permission to call the Database mail’s executable file (DatabaseMail.exe) Example: Install Path:\Program Files\Microsoft SQL Server\MSSQL1.SQL2019\MSSQL\Binn\DatabaseMail.exe Check DB Mail account profile’s security configuration options and port number you have chosen for further troubleshooting purpose The Port Number you have chosen for this account Whether or not you have checked the box “this server requires a secure connection(SSL)” The type of SMTP authentication you have chosen Steps: Open SSMS, select Management, right-click Database Mail, and select Configure Database Mail -> Manage Database Mail accounts and profiles > Next. Telnet Port and IP of SMTP Server. In SQL DB Mail server, telnet the SMTP server to see if SQL machine can communicate with the IP and port of your SMTP (the port number configured in your profile). Most SMTP servers use port 25. If the telnet is not successful, it means the network communication from DB Mail server to SMTP server has caused the problem. If the DB Mail server can communicate with other server without issue, then the problem lies on the network traffic with SMTP server Open CMD as administrator and run below command to telnet your target server IP and port telnet [domain name or ip] [port] For example, to verify connection to 192.168.0.10 on port 25, issue the command: telnet 192.168.0.10 25 Configure TELNET in your server: Windows 7, 8. 10: Open Windows Start menu > Type "Control Panel" > Press Enter > “Programs” > "Programs and Features" > Turn Windows features on or off > Select "Telnet Client" > Press “OK" Windows Server 2012, 2016: Open “Server Manager” > “Add roles and features” > click “Next” until reaching the “Features” step > tick “Telnet Client” > click “Install” > when the feature installation finishes, click “Close”. Run Testing Script to Send email. If telnet to the IP and port from DB Mail server to SMTP server is successful, it means the network from DB server to SMTP server is good. We will need to test and see if we can send DB Mail via PowerShell or other scripts (rule out impact of DB Mail service and see if we could directly send email to your SMTP server to isolate the issue further). Also, we suggest to test and see if we can switch to a public SMTP server for the same DB Mail profile as well as switch to different DB Mail profile to narrow down whether it is profiler issue, SMTP server issue, or SQL Server DB Mail service issue. Below is a sample PowerShell Script to send DB mail $UserCredential = Get-Credential enter this: user:test@chimex.onmicrosoft.com password:yourpassword Send-MailMessage -to "youremail" -from "test@chimex.onmicrosoft.com" -subject "powershell" -body "powershell" -BodyAsHtml -smtpserver smtp.office365.com -usessl -Credential $UserCredential If step 6 is not able to be directly tested in your environment, kindly collect a network monitor trace when you reproduce the issue (failed to send DB Mail) If you do not see clear evidence to find RCA in the network trace for client or SMTP server reset, based on the symptom, you may need to collect a TTT debug trace for dbmail.exe and work with Microsoft support. Special Scenarios: =============== Scenario 1: Implicit TLS mode is not supported for SQL Server DB Mail. If your SMTP server requires implicit TLS, then SQL Server DB Mail will not be able to send email with this SMTP server. You can consider the options of switching to a different SMTP Server (such as a public one) that support STARTTLS or making modification in your SMTP server to support STARTTLS If your DB Mail profile has enabled SSL encryption, then STARTTLS would be required in the secured communication between your DB Mail server and SMTP Server. For SQL Server Database Mail architecture, as our service relies on .Net System.Net.Mail (SmtpClient class) and System.Net.Mail does not support “Implicit SSL/TLS“mode, SQL Server Database Mail does not support it as well. In the past, port 465 can be used to support “Implicit SSL/TLS“mode (SMTP over SSL). Now it is no longer supported. (more details , kindly refer SmtpClient.EnableSsl Property (System.Net.Mail) | Microsoft Docs ) More Details with STARTTLS and “Implicit SSL/TLS” --------------------------------------------------------------------- “STARTTLS” is an email protocol command that would turn an insecure network connection into a secured one. If email client server has enabled/request SSL or TLS encryption, then STARTTLS would be required for SQL Server DB Mail service to successfully send email. “Implicit SSL/TLS” is another mode for secured client to server communication. The major two differences between “STARTTLS” and “Implicit SSL/TLS” are summarized as below (while there are a couple of other differences) : With the “Implicit SSL/TLS” mode, email client server connects to the SMTP server and TLS/SSL encryption is switched on implicitly as soon as the connection is established while under “STARTTLS” mode, client explicitly requests TLS/SSL encryption to be switched on after initial TCP handshake. With “Implicit SSL/TLS” mode, if the connection is not able to be built with encrypted security mode, the email will be prevented from being sent. However, with “STARTTLS”, if the SMTP mail server not able to support TLS encryption as requested by email client server, the email client server will negotiate with the SMTP server and agree to downgrade to an unencrypted connection. Thus, with “STARTTLS”, you can use the same port for encrypted and plain text mail. Scenario 2: SQL DB Mail failure caused by SMTP mail server requesting TLS 1.2. In this case, TLS 1.2 needs to be enabled at DB Mail server. Multiple DB Mail cases have seen its failure being caused by client DB Mail server not supporting TLS 1.2 while the SMTP mail server is requesting TLS 1.2. Unfortunately, most often the error observed in Database Mail Log Viewer (sysmail_event_log) is very generic as below. From network monitor trace, you may not see any STARTTLS traffic as the connection can be reset by DB mail server after initial handshake. The mail could not be sent to the recipients because of the mail server failure. (Sending Mail using Account 2 (2022-03-14T16:58:54). Exception Message: Cannot send mails to mail server. (Failure sending mail.). ) If Schannel errors are detected in Windows system event logs around the same time when DB Mail failure happens, you are suggested to use below troubleshooting steps to see if the failure is related to TLS 1.2 requested by SMTP server. Use the first 7 steps mentioned earlier to narrow down other issues that can play a role in the scene. Check system event log for any Schannel errors (or any errors) from the same time as the database mail failure occurred Below are a few examples but there could be others. Any Schannel error occurring at the same time as the database mail failure should be cautiously checked. {timestamp},Error,{servername},36887,Schannel,A fatal alert was received from the remote endpoint. The TLS protocol defined fatal alert code is 70. {timestamp},Error,0,36871,Schannel,{servername},A fatal error occurred while creating a TLS client credential. The internal error state is 10013. If Schannel errors are spotted at the same time when DB Mail fails which can easy to be reproduced, check and ensure your SQL Server and Windows has the necessary hotfixes to support TLS 1.2 (refer link https://support.microsoft.com/en-us/topic/kb3135244-tls-1-2-support-for-microsoft-sql-server-e4472ef8-90a9-13c1-e4d8-44aad198cdbe ) Check registry settings in DB Mail server and make sure the needful ones are present. Reboot is needed for the change to take effects. (Please first take a backup of your registry key and store them in another machine before you make any change! ) [HKEY_LOCAL_MACHINE\SOFTWARE\WOW6432Node\Microsoft\.NETFramework\v2.0.50727] "SystemDefaultTlsVersions"=dword:00000001 "SchUseStrongCrypto"=dword:00000001 [HKEY_LOCAL_MACHINE\SOFTWARE\WOW6432Node\Microsoft\.NETFramework\v4.0.30319] "SystemDefaultTlsVersions"=dword:00000001 "SchUseStrongCrypto"=dword:00000001 [HKEY_LOCAL_MACHINE\SOFTWARE\Microsoft\.NETFramework\v2.0.50727] "SystemDefaultTlsVersions"=dword:00000001 "SchUseStrongCrypto"=dword:00000001 [HKEY_LOCAL_MACHINE\SOFTWARE\Microsoft\.NETFramework\v4.0.30319] "SystemDefaultTlsVersions"=dword:00000001 "SchUseStrongCrypto"=dword:00000001 [HKEY_LOCAL_MACHINE\SYSTEM\CurrentControlSet\Control\SecurityProviders\SCHANNEL\Protocols\TLS 1.2] [HKEY_LOCAL_MACHINE\SYSTEM\CurrentControlSet\Control\SecurityProviders\SCHANNEL\Protocols\TLS 1.2\Client] "DisabledByDefault"=dword:00000000 "Enabled"=dword:00000001 [HKEY_LOCAL_MACHINE\SYSTEM\CurrentControlSet\Control\SecurityProviders\SCHANNEL\Protocols\TLS 1.2\Server] "DisabledByDefault"=dword:00000000 "Enabled"=dword:00000001 DISCLAIMER : THIS CODE AND INFORMATION IS PROVIDED "AS IS" WITHOUT WARRANTY OF ANY KIND, EITHER EXPRESSED OR IMPLIED, INCLUDING BUT NOT LIMITED TO THE IMPLIED WARRANTIES OF MERCHANTABILITY AND FITNESS FOR A PARTICULAR PURPOSE.47KViews2likes0CommentsTSQL Scripts for Troubleshooting Common Issues with SQL Server
This blog provides TSQL samples for troubleshooting common SQL Server issues as listed below. You can modify the parameters (i.e. database name, table name, keyword name, duration, etc.) based on customized environment settings and requirements. (Test these scripts before implementing in PROD environment. Please be aware of all potential risks for implementing the script in your PROD environment.) 1. Performance Troubleshooting(blocking, high CPU, memory, idle, query execution) 2. Deadlock and Database Object ID mapping 3. HA (Clustered SQL Server) 4. Backup & Transaction Log Related Issue 5. Query Store (QDS) 6. Database Encryption (TDE) 7. Tool (Profiler trace and X-event) Performance Troubleshooting ========================= (blocking, high CPU, memory, idle, query execution) 1.List all active sessions and its queries that contain your target table name or specific TSQL structure (input your target key word) SELECT sqltext.TEXT, req.session_id, req.status, req.command, req.cpu_time,req.database_id, req.total_elapsed_time FROM sys.dm_exec_requests req CROSS APPLY sys.dm_exec_sql_text(sql_handle) AS sqltext where sqltext.text like '%Your Target Key Word%' 2.List all sleeping user sessions that have been idle for over 15 minutes with detailed queries (You can customize the session’s status and idle time) SELECT CURRENT_TIMESTAMP as currenttime, datediff(minute,last_batch,GETDATE()) as 'idletime_in_minute' ,sp.status,sp.spid,sp.login_time,sp.program_name,sp.hostprocess,sp.loginame,text FROM sys.sysprocesses sp CROSS APPLY sys.dm_exec_sql_text(sp.sql_handle) AS QT where sp.status = 'sleeping' and datediff(minute,last_batch,GETDATE()) >15 and spid>50 3.List top 10 high CPU queries that currently running in this SQL instance SELECT s.session_id,r.status,r.blocking_session_id 'Blk by',r.wait_type,wait_resource,r.wait_time / (1000 * 60) 'Wait M',r.cpu_time,r.logical_reads,r.reads,r.writes,r.total_elapsed_time / (1000 * 60) 'Elaps M',Substring(st.TEXT,(r.statement_start_offset / 2) + 1, ((CASE r.statement_end_offset WHEN -1 THEN Datalength(st.TEXT) ELSE r.statement_end_offset END - r.statement_start_offset) / 2) + 1) AS statement_text, Coalesce(Quotename(Db_name(st.dbid)) + N'.' + Quotename(Object_schema_name(st.objectid, st.dbid)) + N'.' + Quotename(Object_name(st.objectid, st.dbid)), '') AS command_text,r.command,s.login_name, s.host_name,s.program_name,s.last_request_end_time,s.login_time, r.open_transaction_count FROM sys.dm_exec_sessions AS s JOIN sys.dm_exec_requests AS r ON r.session_id = s.session_id CROSS APPLY sys.Dm_exec_sql_text(r.sql_handle) AS st WHERE r.session_id != @@SPID ORDER BY r.cpu_time desc 4. List top 10 high memory usage queries that currently running in this SQL instance SELECT mg.session_id,mg.granted_memory_kb,mg.requested_memory_kb,mg.ideal_memory_kb,mg.request_time,mg.grant_time,mg.query_cost,mg.dop,st.[TEXT],qp.query_plan FROM sys.dm_exec_query_memory_grants AS mg CROSS APPLY sys.dm_exec_sql_text(mg.plan_handle) AS st CROSS APPLY sys.dm_exec_query_plan(mg.plan_handle) AS qp ORDER BY mg.required_memory_kb DESC 5. List detailed memory usage for each memory clerk DBCC MEMORYSTATUS 6. List memory usage for plan cache and its maximum size based on current setting. By removing the WHERE condition, you will get a full list for all memory cache clerks’ information select name, type, buckets_count from sys.dm_os_memory_cache_hash_tables where name IN ( 'SQL Plans' , 'Object Plans' , 'Bound Trees' ,'Extended Stored Procedures') select name, type, pages_kb, entries_count from sys.dm_os_memory_cache_counters where name IN ( 'SQL Plans' , 'Object Plans' , 'Bound Trees' ,'Extended Stored Procedures') 7. List progressive (on-going) execution plan for a specific session (Starting with SQL 2016) For SQL 2016 and 2017, please first run below TSQL in the query session of which the execution plan you wish to extract later set statistics profile on Run below query to extract the on-going execution plan for your target session (input the SPID in the bracket) SELECT * FROM sys.dm_exec_query_statistics_xml(59); 8.List all block header queries that currently detected in this SQL instance declare @blocker varchar(100),@sql varchar(100) print convert(varchar(20), getdate(),120) select distinct blocked into #blocker from sysprocesses where blocked <> 0 DECLARE blocker CURSOR FOR select spid from sysprocesses where spid in (select * from #blocker) and blocked = 0 OPEN blocker FETCH NEXT FROM blocker INTO @blocker WHILE @@FETCH_STATUS = 0 BEGIN set @sql='DBCC inputbuffer(' + @blocker + ')' execute (@sql) set @sql= 'select * from sysprocesses where spid=' + @blocker execute (@sql) FETCH NEXT FROM blocker INTO @blocker END CLOSE blocker DEALLOCATE blocker drop table #blocker 9.Kill all sleeping sessions that has been idle over 1 hour (You can customize the idle duration) DECLARE user_spid INT DECLARE CurSPID CURSOR FAST_FORWARD FOR SELECT SPID FROM master.dbo.sysprocesses (NOLOCK) WHERE spid>50 AND status='sleeping' -- only sleeping threads AND DATEDIFF(HOUR,last_batch,GETDATE())>=1 -- thread sleeping for 1 hours AND spid<>@@spid -- ignore current spid OPEN CurSPID FETCH NEXT FROM CurSPID INTO user_spid WHILE (@@FETCH_STATUS=0) BEGIN PRINT 'Killing '+CONVERT(VARCHAR,@user_spid) EXEC('KILL '+@user_spid) FETCH NEXT FROM CurSPID INTO user_spid END CLOSE CurSPID DEALLOCATE CurSPID GO 10.Kill all block headers. This script will continuously scan every 5 seconds for all block header sessions and kill all block headers Use master go while 1=1 Begin declare @blocker varchar(100),@sql varchar(100) print convert(varchar(20), getdate(),120) select distinct blocked into #blocker from sysprocesses where blocked <> 0 DECLARE blocker CURSOR FOR select spid from sysprocesses where spid in (select * from #blocker) and status='sleeping' OPEN blocker FETCH NEXT FROM blocker INTO @blocker WHILE @@FETCH_STATUS = 0 BEGIN set @sql='DBCC inputbuffer(' + @blocker + ')' execute (@sql) set @sql= 'kill ' + @blocker execute (@sql) FETCH NEXT FROM blocker INTO @blocker END CLOSE blocker DEALLOCATE blocker drop table #blocker waitfor delay '0:0:05' End Deadlock and Database Object ID mapping =================================== Below are 3 examples to map the issued object based on the ID to its source database, index or schema. 1. Key type wait resource waitresource=KEY: 6:12345678990 (987654321a9b) database_id = 6 hobt_id = 12345678990 hash value = (987654321a9b) We can use below TSQL to check the database name based on DATABASE ID select db_name(6) Use below TSQL to check the schema, object, and index details related to this key USE DatabaseName GO SELECT sc.name as schema_name, so.name as object_name, si.name as index_name FROM sys.partitions AS p JOIN sys.objects as so on p.object_id=so.object_id JOIN sys.indexes as si on p.index_id=si.index_id and p.object_id=si.object_id JOIN sys.schemas AS sc on so.schema_id=sc.schema_id WHERE hobt_id = 12345678990 2. Object Wait resource type waitresource=OBJECT: 6:1234567890:4 database_id = 6 Object ID = 1234567890 We can use below TSQL to check the specific object name based on the waitresource details select OBJECT_NAME(1234567890,6) 3. Page Wait Resource Type waitresource=“PAGE: 6:3:70133 ” = Database_Id : FileId : PageNumber database_id=6 data_file_id = 3 page_number = 70133 HA (Clustered SQL Server) =================== List the latest error encountered by local AG replica for connection timeout select r.replica_server_name, r.endpoint_url, rs.connected_state_desc, rs.last_connect_error_description, rs.last_connect_error_number, rs.last_connect_error_timestamp from sys.dm_hadr_availability_replica_states rs join sys.availability_replicas r on rs.replica_id=r.replica_id where rs.is_local=1 List the current redo rate, redo queue size, log send rate, log send queue size for current AG replica SELECT CURRENT_TIMESTAMP as currenttime,drs.last_commit_time,ar.replica_server_name, adc.database_name, ag.name AS ag_name, drs.is_local, drs.is_primary_replica, drs.log_send_queue_size, drs.log_send_rate, drs.redo_queue_size, drs.redo_rate FROM sys.dm_hadr_database_replica_states AS drs INNER JOIN sys.availability_databases_cluster AS adc ON drs.group_id = adc.group_id AND drs.group_database_id = adc.group_database_id INNER JOIN sys.availability_groups AS ag ON ag.group_id = drs.group_id INNER JOIN sys.availability_replicas AS ar ON drs.group_id = ar.group_id AND drs.replica_id = ar.replica_id Restart endpoint Check SQL AG endpoint name SELECT * FROM sys.endpoints Restart AG endpoint on this local replica ALTER ENDPOINT <Your AG Endpoint Name> STATE=STOPPED ALTER ENDPOINT <Your AG Endpoint Name> STATE=STARTED Backup & Transaction Log Related Issue ================================ List all backup history and backup file details for the past 7 days (You can modify the date) SELECT CONVERT(CHAR(100), SERVERPROPERTY('Servername')) AS Server, msdb.dbo.backupset.database_name, msdb.dbo.backupset.backup_start_date, msdb.dbo.backupset.backup_finish_date, msdb.dbo.backupset.expiration_date, CASE msdb..backupset.type WHEN 'D' THEN 'Database' WHEN 'L' THEN 'Log' END AS backup_type, msdb.dbo.backupset.backup_size, msdb.dbo.backupmediafamily.logical_device_name, msdb.dbo.backupmediafamily.physical_device_name, msdb.dbo.backupset.name AS backupset_name, msdb.dbo.backupset.description FROM msdb.dbo.backupmediafamily INNER JOIN msdb.dbo.backupset ON msdb.dbo.backupmediafamily.media_set_id = msdb.dbo.backupset.media_set_id WHERE (CONVERT(datetime, msdb.dbo.backupset.backup_start_date, 102) >= GETDATE() - 7) ORDER BY msdb.dbo.backupset.database_name, msdb.dbo.backupset.backup_finish_date List all databases’ data and log file path and logical name USE master; SELECT name 'Logical Name', physical_name 'File Location' FROM sys.master_files; List each database’ transaction log size usage and space DBCC SQLPERF(LOGSPACE) List VLF size and counts for all databases as well as detailed size for your target database select * from sys.dm_db_log_info(5); /*input here your DB ID to get detailed size for existing VLFs on this database*/ SELECT [name], s.database_id, COUNT(l.database_id) AS 'VLF Count', SUM(vlf_size_mb) AS 'VLF Size (MB)', SUM(CAST(vlf_active AS INT)) AS 'Active VLF', SUM(vlf_active*vlf_size_mb) AS 'Active VLF Size (MB)', COUNT(l.database_id)-SUM(CAST(vlf_active AS INT)) AS 'In-active VLF', SUM(vlf_size_mb)-SUM(vlf_active*vlf_size_mb) AS 'In-active VLF Size (MB)' FROM sys.databases s CROSS APPLY sys.dm_db_log_info(s.database_id) l GROUP BY [name], s.database_id ORDER BY 'VLF Count' DESC GO For the purpose of shrinking transaction log file, check the log_reuse_wait_desc type for all database select name,database_id,log_reuse_wait, log_reuse_wait_desc from sys.databases Please refer this link for how to fix each of the log_reuse_wait_desc type when it is not “NOTHING” https://docs.microsoft.com/en-us/sql/relational-databases/system-catalog-views/sys-databases-transact-sql?view=sql-server-ver15 Database Corruption Issue Force repair of database with REPAIR_ALLOW_DATA_LOSS option (data loss expected and sometimes can cause more damage. Please refrain from using this method unless as for a last resort. More details for fixing database corruption, please refer this link https://docs.microsoft.com/en-us/sql/t-sql/database-console-commands/dbcc-checkdb-transact-sql?view=sql-server-ver15) Alter database YourDBName set single_user with rollback immediate; DBCC CHECKDB('YourDBName', REPAIR_ALLOW_DATA_LOSS); Alter database YourDBName set multi_user with rollback immediate; Query Store (QDS) ================= 1.List a database’s query store status select * from sys.database_query_store_options 2. List all databases that have query store configured select name as 'DATABASE NAME', CASE is_query_store_on when 1 then 'ENABLED' else 'OTHER' END AS 'QUERY STORE STATE' from sys.databases where is_query_store_on = 1 order by 1 ; Database Encryption (TDE) ====================== Check if the DMK exist in master database USE master GO SELECT * FROM sys.symmetric_keys WHERE name = '##MS_DatabaseMasterKey##' Check if the certificate is created in master database. A certificate is equivalent to an asymmetric key USE master GO select * from sys.certificates Check if the database is encrypted/progress (encryption_state = 3 encrypted; =2 in progress) USE master GO SELECT db_name(database_id) [TDE Encrypted DB Name], c.name as CertName, encryptor_thumbprint , dek.* FROM sys.dm_database_encryption_keys dek INNER JOIN sys.certificates c on dek.encryptor_thumbprint = c.thumbprint Check if the DMK in the master database is now encrypted by the SMK (is_master_key_encrypted_by_server = 1) select is_master_key_encrypted_by_server, * from sys.databases where database_id = db_id(N'master') Tool (Profiler trace and X-event) ======================= Import SQL Profiler trace into SQL Server database tables USE DatabaseName GO select * into Sample from fn_trace_gettable('c:\trace\YourFolderToStoreTheTrace\YourTraceFile.trc',default) where eventclass in (10, 12) For event class ID, check the list in this link https://docs.microsoft.com/en-us/sql/relational-databases/system-stored-procedures/sp-trace-setevent-transact-sql?view=sql-server-ver15 Use XELoader to process X-event and import the data into SQL database table for data analysis purpose. XELoader can be downloaded from this opensource link https://github.com/suresh-kandoth/XELoader Use CMD script to load the X-event files into SQL Server database Sample script: C:\XELoader\6.2>XELoader.exe -D"C:\Users\yixin\Desktop\xeloader\xevent" -SYourServerName\InstanceName -dYourDBName Use TSQL query to check aggregated data result Sample TSQL: SELECT sum(c_duration) as SUM_DURAION,sum(c_signal_duration) as SUM_SIGNAL_DURATION,c_wait_type from [xel].[wait_info] group by c_wait_type order by SUM_DURAION desc DISCLAIMER : THIS CODE AND INFORMATION IS PROVIDED "AS IS" WITHOUT WARRANTY OF ANY KIND, EITHER EXPRESSED OR IMPLIED, INCLUDING BUT NOT LIMITED TO THE IMPLIED WARRANTIES OF MERCHANTABILITY AND FITNESS FOR A PARTICULAR PURPOSE.14KViews1like0CommentsCommon Causes and Troubleshooting Solutions for SQL AG Data Synchronization Latency
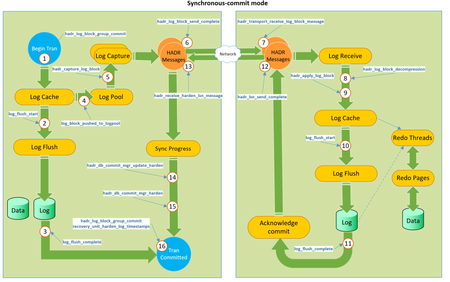
This article summarizes the common causes , solutions and troubleshooting mechanism for SQL Availability Group (AG) data synchronization latency between primary and secondary for both synchronous-commit and asynchronous-commit mode. The latency commonly happens at log harden phase or log redo phase. And sometimes, both. If it happens at log harden phase, you will likely to see HADR_SYNC_COMMIT wait type in your primary that waiting for your synchronous-commit secondary replica's acknowledgement. Also, your primary is likely to encounter latency on committing transactions sent from application because of this wait. If latency happens purely at log redo phase, you are likely to see a relatively low redo rate in your issued secondary replica with high value of redo queue. The key point is to first narrow down the actual phase of workflow (attached at the bottom of this article as also mentioned in a few other blogs thanks to great work of Simon Su )in data synchronization that induces the latency. For experienced DBA, if you have already narrowed down the latency to be caused by extensive HADR_SYNC_COMMIT wait type in your primary for your synchronous-commit secondary replica, you can refer to this article for resolving this bottleneck : https://techcommunity.microsoft.com/t5/sql-server/troubleshooting-high-hadr-sync-commit-wait-type-with-always-on/ba-p/385369 If you wish to capture detailed traces to narrow down the bottleneck, except for performance monitor counters where you can check log send and redo efficiency, blocking chain and its block header on primary replica, SQL AG dedicated X-events in both primary and issued secondary are also required to see the data synchronization workflow latency. We have an automatic tool "AGLatency Report Tool" to help you analyze the AG X-event data thanks to the great work of Simon Su . You can find this tool in this link with its user manual and the AG X-event script in this link Below are the common causes and its solution/troubleshooting mechanism for SQL AG Data Synchronization Latency: Long-running active transactions in read-only secondary replica ---- > When there is a long-running transaction in readable secondary replica, there can be blocking for the local redo thread in secondary replica when accessing the same data. High network latency / low network throughput ----> When the network transmission between primary and the issued secondary is slow or instable, the log send rate will be slow and impact the amount of data being transmitted to secondary(refer doc https://docs.microsoft.com/en-us/previous-versions/sql/sql-server-2012/dn135335(v=sql.110)?redirectedfrom=MSDN) Flow control induced high log send queue size and low log send rate ---- > When your SQL AG's performance triggered flow control gate for specific SQL AG databases or at SQL AG replica level, there would be temporary termination and limitation of sending log data from primary to secondary. Flow control can be commonly caused by server overloading or slow network. We need to resolve the conditions in your environment that cause the flow control if we have constantly observed flow control gate being entered by your AG. You can check below performance monitor counters to see if your SQL AG Database or SQL AG replica has ever triggered flow control gate: AG Replica level Availability Replica : Flow Control Time , Availability Replica : Flow Control/sec , AG Database Level Database Replica: Database Flow Control Delay Database Replica: Database Flow Controls/Sec (For Flow Control Gate details as discussed below, please refer this link Monitor Performance for AlwaysOn Availability Groups | Microsoft Docs) AlwaysOn Availability Groups is designed with flow control gates on the primary replica to avoid excessive resource consumption, such as network and memory resources, on all availability replicas. These flow control gates do not affect the synchronization health state of the availability replicas, but they can affect the overall performance of your availability databases, including RPO. After the logs have been captured on the primary replica, they are subject to two levels of flow controls, as shown in the table below. Level Number of Gates Number of messages Useful Metrics Transport 1 per availabiltiy replica 8192 Extended event database_transport_flow_control_action Database 1 per availability database 11200 (x64) 1600 (x86) DBMIRROR_SEND Extended event hadron_database_flow_control_action FLOW CONTROL GATES Once the message threshold of either gate is reached, log messages are no longer sent to a specific replica or for a specific database. These can be sent once acknowledgement messages are received for the sent messages to bring the number of sent messages below the threshold. In addition to the flow control gates, there is another factor that can prevent the log messages from being sent. The synchronization of replicas ensures that the messages are sent and applied in the order of the log sequence numbers (LSN). Before a log message is sent, its LSN also checked against the lowest acknowledged LSN number to make sure that it is less than one of thresholds (depending on the message type). If the gap between the two LSN numbers is larger than the threshold, the messages are not sent. Once the gap is below the threshold again, the messages are sent. Blocked REDO thread ---- When there are other issues or performance bottlenecks in secondary replica, the REDO thread can be blocked and cause latency of data synchronization. Refer document https://techcommunity.microsoft.com/t5/sql-server/alwayson-minimizing-blocking-of-redo-thread-when-running/ba-p/383963 Shared REDO Target ----- This issue only happens when you have multiple secondary replicas. When one secondary replica is very slow in finishing the redo process, it will limit the other secondary replicas in proceeding further on the maximum allowable LSN with the redo process. Trace flag 9559 can be used to mitigate the issue. (refer doc https://docs.microsoft.com/en-us/archive/blogs/alwaysonpro/recovery-on-secondary-lagging-shared-redo-target) Running out of parallel redo threads in secondary replica --- When secondary replica is running out of parallel redo threads, you can use TF3478 to allow maximal number of parallel redo thread to increase with total number of CPUs. By default, A SQL Server instance uses up to 100 threads for parallel redo for secondary replicas. Each database uses up to one-half of the total number of CPU cores, but not more than 16 threads per database. If the total number of required threads for a single instance exceeds 100, SQL Server uses a single redo thread for every remaining database. Disk or I/O subsystem latency -- > when the disk or I/O subsystem in the secondary replica has critical bottleneck, the redo rate will be impacted and quite small in secondary replica. We are less likely to see it in your secondary before it hit on primary if your secondary replica is not readable and has comparable hardware for SQL database files' storage as that in primary and dedicated for this SQL AG's usage. However, if your secondary replica has high volume of read-only workload, it can bring extra IO overhead to your IO subsystem. Frequent database backup and VM snapshot can be another potential cause of extra I/O overhead.26KViews3likes0CommentsGMSA is used for SQL service and it fails to start
GMSA is used for SQL service and its failing to start with error “the request failed, or the service did not respond in a timely fashion. Consult the event log or other applicable error logs for details”. In this post we would like to explain one of the interesting issues that we encountered where SQL Server uses a gMSA as its service account. Troubleshooting: When we tried to start SQL server using GMSA account, we found the SQL Server could not start due to timeout. One reason could be that the service account is not properly set or could not be authenticated with domain controllers. When we checked Windows Services applet (Services.msc) we found that it was in “Starting” state. SQL Server Services running under the context of a gMSA service account, gMSA service relies on KDS service, however the "Microsoft Key Distribution Service" service is not started on the domain controller. Here is an actual explanation about how GMSA account needs Microsoft Key Distribution Service is . During startup, Windows enumerates all automatic services and tries to start them. When Windows tries to start a service that is configured to use a group Managed Service Account (gMSA), the Service Control Manager (SCM) tries to log on by using the account information for the service. The logon request is sent to the Local Security Authority process (lsass.exe, LSASS) that is running on the computer. LSASS receives the request. While handling the request, LSASS tries to do a Lightweight Directory Access Protocol (LDAP) search for the msDS-ManagedPassword attribute. When the LDAP request is performed on a domain controller, the LDAP query can be sent back to the local server, where it is handled by a different thread in LSASS, which is the same process that issued the query. The LDAP server thread calls in to the Microsoft Key Distribution Service Provider (kdscli.dll), where it tries to find server components: Microsoft Key Distribution Service (KdsSvc), RPC endpoint from the RPC endpoint mapper (EPM). Because the KdsSvc service is set to be triggered as soon as one of these RPC queries occurs, the service should start (in theory). However, because the SCM is currently blocked from starting a service and it can only start one service at a time, KdsSvc never gets started, and SCM hangs. From domain controller side, we observed the issue of starting the KDS service. When manually starting KDS service, we can see following error: C:\>net start kdssvc The Microsoft Key Distribution Service service is starting. The Microsoft Key Distribution Service service could not be started. A system error has occurred. System error 1064 has occurred. An exception occurred in the service when handling the control request Also, we observed that Domain Controller is in Computer Container instead of Domain Controllers OU. Cause: This issue occurs because KDS assumes that the Domain Controllers are in the Domain Controllers OU instead of other OUs or Computer Container. We moved the Domain Controller (DC) back to Domain Controllers OU, then started the KDS service. C:\>net start kdssvc The Microsoft Key Distribution Service service is starting. The Microsoft Key Distribution Service service was started successfully. SQL service is now able to start with both service accounts. Issue has been resolved. Please refer: https://support.microsoft.com/en-za/help/4294429/service-using-gmsa-account-doesn-t-start-on-windows-server-2012-r2-dc Resolution: Move Domain Controller (DC) back to a Domain Controller OU and start KDS service. Recommendation: From AD perspective, we always recommend not to move DCs out of domain controllers OU, because default Domain Controller has many different user rights assigned. If you move it to other OUs or Container this may cause unexpected errors. When the service is up and running, we can move the DC out to different OUs, and this won’t cause the issue. However, later when machine is rebooted, this service will not start correctly due to the described behavior. Please refer: https://support.microsoft.com/en-us/help/3094486/kds-doesn-t-start-or-kds-root-key-isn-t-created-in-windows-server-2012 Failback Option: The failback option for the SQL Server service is to use the NT Service\MSSQLSERVER account. Author: Saniya Samreen – ARR Support Engineer, SQL Server on Azure VM Microsoft Reviewer: Joseph Pilov – Escalation Engineer, SQL Server, Microsoft13KViews0likes0Comments
Memory Grants: The mysterious SQL Server memory consumer with Many Names
First published on MSDN on Jan 01, 2013 The Memory Consumer with Many NamesHave you ever wondered what Memory grants are? What about QE Reservations? And Query Execution Memory? Workspace memory? How about Memory Reservations?As with most things in life, complex concepts often reduce to a simple one: all these names refer to the same memory consumer in SQL Server: memory allocated during query execution for Sort and Hash operations (bulk copy and index creation fit into the same category but a lot less common).47KViews3likes0Comments
SQL Server Unconstrained Delegation failing after 10 hours
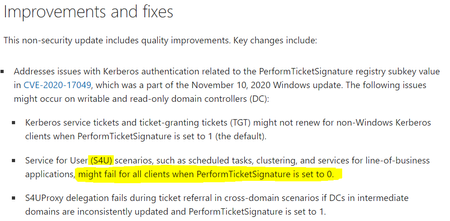
After the Windows updates from November 2020, you might be facing some issues running Bulk Inserts or working with linked servers, if you keep an open session for more than 10 hours. Some recent changes were done on the Windows side when it comes to the way S4U (Unconstrained delegation) Kerberos tickets work.5KViews7likes0Comments
How to troubleshoot “SQL Server is terminating because of fatal exception c06d007e”
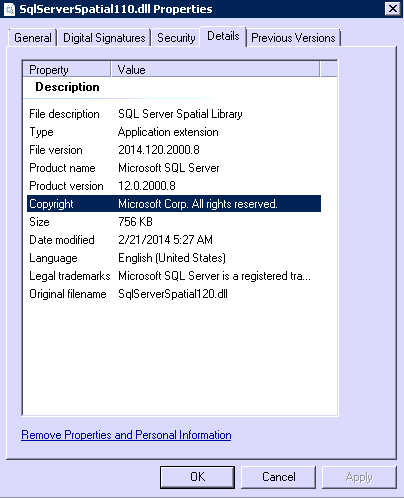
Case 1, with Dump generated Issue definition: ======== Customer have SQL 2008/2012/2014 running on the same server, and then applied the SP4 for SQL Server 2012 in Windows update. But after this customer saw some issue from application side, then you rollback the update. And then Customer applied the SP3 for SQL Server 2012, but after that the SQL Server service can’t startup with following message and dump generated. Customer also tried to repair SQL Server many times, it doesn’t work. 2018-02-22 18:31:43.52 Server Error: 17311, Severity: 16, State: 1. 2018-02-22 18:31:43.52 Server SQL Server is terminating because of fatal exception c06d007e. This error may be caused by an unhandled Win32 or C++ exception, or by an access violation encountered during exception handling. Check the SQL error log for any related stack dumps or messages. This exception forces SQL Server to shutdown. To recover from this error, restart the server (unless SQLAgent is configured to auto restart). 2018-02-22 18:31:43.53 Server Using 'dbghelp.dll' version '4.0.5' 2018-02-22 18:31:43.53 Server **Dump thread - spid = 0, EC = 0x0000000000000000 2018-02-22 18:31:43.53 Server ***Stack Dump being sent to E:\Program Files\Microsoft SQL Server\MSSQL11.MSSQLSERVER\MSSQL\LOG\SQLDump0094.txt 2018-02-22 18:31:43.53 Server * ******************************************************************************* 2018-02-22 18:31:43.53 Server * 2018-02-22 18:31:43.53 Server * BEGIN STACK DUMP: 2018-02-22 18:31:43.53 Server * 02/22/18 18:31:43 spid 11352 2018-02-22 18:31:43.53 Server * 2018-02-22 18:31:43.53 Server * ex_handle_except encountered exception C06D007E - Server terminating Issue analysis and troubleshooting thinking ======== In the live meeting with customer, we first checking the setup log. And we saw that the SP4 has been applied, but after a while there is another setup folder generated reporting the failed error message: Exception type: Microsoft.SqlServer.Chainer.Infrastructure.ChainerInvalidOperationException Message: The NT service 'SQLSERVERAGENT' could not be started. HResult : 0x84b20001 FacilityCode : 1202 (4b2) ErrorCode : 1 (0001) Data: HelpLink.EvtType = 0xAE7B8BF3@0xF762992B@1202@1 DisableWatson = true Stack: at Microsoft.SqlServer.Configuration.SetupExtension.RunPatchAllInstanceAction.RestoreServiceStates() at Microsoft.SqlServer.Configuration.SetupExtension.RunPatchAllInstanceAction.ExecuteAction(String actionId) at Microsoft.SqlServer.Chainer.Infrastructure.Action.Execute(String actionId, TextWriter errorStream) at Microsoft.SqlServer.Setup.Chainer.Workflow.ActionInvocation.ExecuteActionHelper(TextWriter statusStream, ISequencedAction actionToRun, ServiceContainer context) Then we get the dump file from customer and performed a detailed analysis . This callstack seems that we have issue while Initialize Server Components(InitServerComponents), and then we get the detailed component name “SqlServerSpatial110.dll” # Child-SP RetAddr Call Site 00 00000000`01bf9cf8 000007fe`fd3810ac ntdll!ZwWaitForSingleObject+0xa 01 00000000`01bf9d00 00000000`ff6af3ee KERNELBASE!WaitForSingleObjectEx+0x79 02 00000000`01bf9da0 00000000`ff6af874 sqlservr!CDmpDump::DumpInternal+0x20e 03 00000000`01bf9e40 00000000`ff6af919 sqlservr!CDmpDump::DumpFilter+0x64 04 00000000`01bf9f10 00000000`74d712e3 sqlservr!`CDmpDump::Dump'::`1'::filt$0+0x19 05 00000000`01bf9f40 00000000`7769bf9d msvcr100!__C_specific_handler+0x97 06 00000000`01bf9fb0 00000000`776704ca ntdll!RtlpExecuteHandlerForException+0xd 07 00000000`01bf9fe0 00000000`77673c1f ntdll!RtlDispatchException+0x45a 08 00000000`01bfa6c0 000007fe`fd39a06d ntdll!RtlRaiseException+0x22f 09 00000000`01bfb070 00000000`ff6af8ec KERNELBASE!RaiseException+0x39 0a 00000000`01bfb140 000007fe`cd6bd4c4 sqlservr!CDmpDump::Dump+0x4c 0b 00000000`01bfb180 000007fe`cd6bdf06 sqllang!SQLDumperLibraryInvoke+0x2e4 0c 00000000`01bfb420 000007fe`cd684b6b sqllang!CImageHelper::DoMiniDump+0x426 0d 00000000`01bfb610 000007fe`cd683f6a sqllang!stackTrace+0xbdb 0e 00000000`01bfd050 000007fe`e0312a75 sqllang!stackTraceCallBack+0xca 0f 00000000`01bfd090 00000000`775abc20 sqldk!ex_handle_except+0x125 10 00000000`01bfd2e0 00000000`776a9035 kernel32!UnhandledExceptionFilter+0x160 11 00000000`01bfd3c0 00000000`77687398 ntdll!RtlUserThreadStart$filt$0+0x45 12 00000000`01bfd3f0 00000000`7769bf9d ntdll!__C_specific_handler+0x8c 13 00000000`01bfd460 00000000`776704ca ntdll!RtlpExecuteHandlerForException+0xd 14 00000000`01bfd490 00000000`77673c1f ntdll!RtlDispatchException+0x45a 15 00000000`01bfdb70 000007fe`fd39a06d ntdll!RtlRaiseException+0x22f 16 00000000`01bfe520 000007fe`ccb7bc0b KERNELBASE!RaiseException+0x39 17 00000000`01bfe5f0 000007fe`cdb8e40f sqllang!__delayLoadHelper2+0x199 18 00000000`01bfe6a0 000007fe`cdb49a75 sqllang!_tailMerge_SqlServerSpatial110_dll+0x3f 19 (Inline Function) --------`-------- sqllang!InitializeSpatialNativeImpl+0x26 1a 00000000`01bfe710 00000000`ff69af2a sqllang!SQLLangInitComponents+0x275 1b 00000000`01bfe770 00000000`ff69c094 sqlservr!InitServerComponents+0x8a 1c 00000000`01bfe7d0 00000000`ff693c48 sqlservr!sqlservr_main+0x3b4 1d 00000000`01bfea20 000007fe`fe32a82d sqlservr!sqlservr_main_thread+0x178 1e 00000000`01bffd30 00000000`775259cd sechost!ScSvcctrlThreadA+0x25 1f 00000000`01bffd60 00000000`7768383d kernel32!BaseThreadInitThunk+0xd 20 00000000`01bffd90 00000000`00000000 ntdll!RtlUserThreadStart+0x1d Looked at the DLL being loaded szDll : 0x7fecdeef9c0 : "SqlServerSpatial110.dll" [Type: char *] Then we checked the SqlServerSpatial110.dll both in C:\Windows\System32 and C:\Windows\SystemWOW64. System32 WOW64: And then we checked this SqlServerSpatial110.dll properties in another working server as below. Then we got the root cause that the current server SqlServerSpatial110.dll original filename is SqlServerSpatial120.dll(it is SQL 2014). But in this case, somehow is has been changed, but we don’t know why, we only get to the result. Then we tried to copy the correct one from another server to current server(system32 and systemWOW64 respectively). But this doesn’t work. After we restart the SQL Server it failed again, with same error. Then we come up with another solution, we can rename the current SqlServerSpatial110.dll to SqlServerSpatial110.dll.old and then launch the repair again. This worked. After repairing, we can see the new SqlServerSpatial110.dll has been created automatically with correct SP3 version(same with the current SQL Server version) Root cause: ======== Somehow, SqlServerSpatial110.dll has been changed. Resolution: ======== Rename the SqlServerSpatial110.dll under C:\Windows\System32 and C:\Windows\SystemWOW64 Launch the repair for SQL Server 2012. This resolved this issue successfully. Case 2, there is no dump generated Issue definition: ======== After you patch the SQL Server 2016, 9 instances failed to start due to the following error. 2020-02-22 18:43:17.14 Server Error: 17311, Severity: 16, State: 1. 2020-02-22 18:43:17.14 Server SQL Server is terminating because of fatal exception c06d007e. This error may be caused by an unhandled Win32 or C++ exception, or by an access violation encountered during exception handling. Check the SQL error log for any related stack dumps or messages. This exception forces SQL Server to shutdown. To recover from this error, restart the server (unless SQLAgent is configured to auto restart). 2020-02-22 18:43:17.14 Server Using 'dbghelp.dll' version '4.0.5' 2020-02-22 18:43:17.14 Server **Dump thread - spid = 0, EC = 0x0000000000000000 2020-02-22 18:43:17.14 Server * ******************************************************************************* 2020-02-22 18:43:17.14 Server * 2020-02-22 18:43:17.14 Server * BEGIN STACK DUMP: 2020-02-22 18:43:17.14 Server * 02/22/20 18:43:17 spid 8832 2020-02-22 18:43:17.14 Server * 2020-02-22 18:43:17.14 Server * ex_handle_except encountered exception C06D007E - Server terminating 2020-02-22 18:43:17.22 Server Stack Signature for the dump is 0x00000001A124A749 2020-02-22 18:43:17.22 Server Unable to create dump because SQLDUMPER library is not available. 2020-02-22 18:43:17.22 Server SQL Server shutdown has been initiated Issue analysis: ======== Based on the log, this issue should happened when loading some DLL. But as there no dump generated due to Unable to create dump because SQLDUMPER library is not available(from the following analysis, we can also see that dbgheko.dll not loaded yet). So we captured a process monitor, and then analyze the process monitor log. From the process monitor log, we can’t get the callstack which can help us to identify the DLL. So we are not able to find the DLL from the callstack, but we can compare the DLL which has already been loaded with a working server, and find out all the non-loaded DLL, and maybe we can find more clue. Compared the working server loaded DLL and this problematic server. All the yellow-mark DLL are non-loaded DLL in the problematic SQL. Working Server: <<<<<<<<<<<<<<< SQLNCLIRDAR11.RLL 0x18261ee0000 0x38000 c:\Program Files\Microsoft SQL Server\140\Shared\1033\SQLNCLIRDAR11.RLL Microsoft Corporation 2011.0110.5069.066 ((SQL11_OLEDB_AAD).160321-0812 ) 3/21/2016 11:56:15 PM instapi140.dll 0x7ffc21c80000 0x13000 c:\Program Files\Microsoft SQL Server\140\Shared\instapi140.dll Microsoft Corporation 2017.0140.3238.01 ((SQLServer2017-CU14).190913-2228) 9/14/2019 6:36:59 AM sqlnclirda11.dll 0x59e10000 0x359000 c:\Program Files\Microsoft SQL Server\140\Shared\sqlnclirda11.dll Microsoft Corporation 2011.0110.5069.066 ((SQL11_OLEDB_AAD).160321-0812 ) 3/21/2016 11:57:40 PM BatchParser.dll 0x7ffbf7990000 0x2c000 C:\Program Files\Microsoft SQL Server\MSSQL14.MSSQLSERVER\MSSQL\Binn\BatchParser.dll Microsoft Corporation 2017.0140.3238.01 ((SQLServer2017-CU14).190913-2228) 9/14/2019 6:36:47 AM dbghelp.dll 0x59c70000 0x196000 C:\Program Files\Microsoft SQL Server\MSSQL14.MSSQLSERVER\MSSQL\Binn\dbghelp.dll Microsoft Corporation 6.12.0002.633 (debuggers(dbg).100201-1211) 2/2/2010 4:15:44 AM ftimport.dll 0x60000000 0x25000 c:\Program Files\Microsoft SQL Server\MSSQL14.MSSQLSERVER\MSSQL\Binn\ftimport.dll Microsoft Corporation 12.0.7031.9999 11/1/2006 12:27:20 PM hkcompile.dll 0x7ffbf86f0000 0x162000 C:\Program Files\Microsoft SQL Server\MSSQL14.MSSQLSERVER\MSSQL\Binn\hkcompile.dll Microsoft Corporation 2017.0140.3238.01 ((SQLServer2017-CU14).190913-2228) 9/14/2019 6:47:36 AM hkengine.dll 0x7ffbf7fe0000 0x70b000 C:\Program Files\Microsoft SQL Server\MSSQL14.MSSQLSERVER\MSSQL\Binn\hkengine.dll Microsoft Corporation 2017.0140.3238.01 ((SQLServer2017-CU14).190913-2228) 9/14/2019 6:51:33 AM hkruntime.dll 0x7ffbf8860000 0x2d1000 C:\Program Files\Microsoft SQL Server\MSSQL14.MSSQLSERVER\MSSQL\Binn\hkruntime.dll Microsoft Corporation 2017.0140.3238.01 ((SQLServer2017-CU14).190913-2228) 9/14/2019 6:52:55 AM MSFTE.DLL 0x49980000 0x3ae000 C:\Program Files\Microsoft SQL Server\MSSQL14.MSSQLSERVER\MSSQL\Binn\MSFTE.DLL Microsoft Corporation 12.0.6828.0 8/28/2006 7:15:55 PM opends60.dll 0x7ffbf8cb0000 0x9000 C:\Program Files\Microsoft SQL Server\MSSQL14.MSSQLSERVER\MSSQL\Binn\opends60.dll Microsoft Corporation 2017.0140.3238.01 ((SQLServer2017-CU14).190913-2228) 9/14/2019 6:36:08 AM qds.dll 0x7ffbf8b80000 0x12e000 C:\Program Files\Microsoft SQL Server\MSSQL14.MSSQLSERVER\MSSQL\Binn\qds.dll Microsoft Corporation 2017.0140.3238.01 ((SQLServer2017-CU14).190913-2228) 9/14/2019 9:38:39 AM sqlevn70.rll 0x17cc64a0000 0x310000 c:\Program Files\Microsoft SQL Server\MSSQL14.MSSQLSERVER\MSSQL\Binn\Resources\1033\sqlevn70.rll Microsoft Corporation 2017.0140.3238.01 ((SQLServer2017-CU14).190913-2228) 9/14/2019 6:36:13 AM xplog70.RLL 0x183ea3d0000 0x4000 C:\Program Files\Microsoft SQL Server\MSSQL14.MSSQLSERVER\MSSQL\Binn\Resources\1033\xplog70.RLL Microsoft Corporation 2017.0140.1000.169 ((SQLServer).170822-2340) 8/23/2017 7:50:34 AM xpstar.rll 0x183e93a0000 0xd000 c:\Program Files\Microsoft SQL Server\MSSQL14.MSSQLSERVER\MSSQL\Binn\Resources\1033\xpstar.rll Microsoft Corporation 2017.0140.1000.169 ((SQLServer).170822-2340) 8/23/2017 7:50:29 AM secforwarder.dll 0x7ffbf8b40000 0xa000 C:\Program Files\Microsoft SQL Server\MSSQL14.MSSQLSERVER\MSSQL\Binn\secforwarder.dll Microsoft Corporation 2017.0140.3238.01 ((SQLServer2017-CU14).190913-2228) 9/14/2019 6:45:38 AM SqlAccess.dll 0x7ffbf7f60000 0x75000 C:\Program Files\Microsoft SQL Server\MSSQL14.MSSQLSERVER\MSSQL\Binn\SqlAccess.dll Microsoft Corporation 2017.0140.3238.01 ((SQLServer2017-CU14).190913-2228) 9/14/2019 6:37:39 AM sqldk.dll 0x7ffbf8cc0000 0x4fc000 C:\Program Files\Microsoft SQL Server\MSSQL14.MSSQLSERVER\MSSQL\Binn\sqldk.dll Microsoft Corporation 2017.0140.3238.01 ((SQLServer2017-CU14).190913-2228) 9/14/2019 9:35:28 AM sqllang.dll 0x7ffbf9af0000 0x2782000 C:\Program Files\Microsoft SQL Server\MSSQL14.MSSQLSERVER\MSSQL\Binn\sqllang.dll Microsoft Corporation 2017.0140.3238.01 ((SQLServer2017-CU14).190913-2228) 9/14/2019 9:44:02 AM sqlmin.dll 0x7ffbfc280000 0x31fe000 C:\Program Files\Microsoft SQL Server\MSSQL14.MSSQLSERVER\MSSQL\Binn\sqlmin.dll Microsoft Corporation 2017.0140.3238.01 ((SQLServer2017-CU14).190913-2228) 9/14/2019 9:38:05 AM SQLOS.dll 0x7ffbff480000 0x7000 C:\Program Files\Microsoft SQL Server\MSSQL14.MSSQLSERVER\MSSQL\Binn\SQLOS.dll Microsoft Corporation 2017.0140.3238.01 ((SQLServer2017-CU14).190913-2228) 9/14/2019 6:45:34 AM SQLSCM.dll 0x7ffbf7e30000 0x13000 C:\Program Files\Microsoft SQL Server\MSSQL14.MSSQLSERVER\MSSQL\Binn\SQLSCM.dll Microsoft Corporation 2017.0140.3238.01 ((SQLServer2017-CU14).190913-2228) 9/14/2019 6:40:48 AM sqlservr.exe 0x7ff7869e0000 0x7f000 C:\Program Files\Microsoft SQL Server\MSSQL14.MSSQLSERVER\MSSQL\Binn\sqlservr.exe Microsoft Corporation 2017.0140.3238.01 ((SQLServer2017-CU14).190913-2228) 9/14/2019 9:35:24 AM sqlTsEs.dll 0x7ffbf91c0000 0x92f000 C:\Program Files\Microsoft SQL Server\MSSQL14.MSSQLSERVER\MSSQL\Binn\sqlTsEs.dll Microsoft Corporation 2017.0140.3238.01 ((SQLServer2017-CU14).190913-2228) 9/14/2019 9:35:33 AM svl.dll 0x7ffbf8b50000 0x2e000 C:\Program Files\Microsoft SQL Server\MSSQL14.MSSQLSERVER\MSSQL\Binn\svl.dll Microsoft Corporation 2017.0140.3238.01 ((SQLServer2017-CU14).190913-2228) 9/14/2019 6:57:13 AM xplog70.dll 0x7ffc2ea50000 0x14000 c:\Program Files\Microsoft SQL Server\MSSQL14.MSSQLSERVER\MSSQL\Binn\xplog70.dll Microsoft Corporation 2017.0140.3238.01 ((SQLServer2017-CU14).190913-2228) 9/14/2019 6:55:14 AM xpsqlbot.dll 0x7ffbf7cd0000 0x8000 C:\Program Files\Microsoft SQL Server\MSSQL14.MSSQLSERVER\MSSQL\Binn\xpsqlbot.dll Microsoft Corporation 2017.0140.3238.01 ((SQLServer2017-CU14).190913-2228) 9/14/2019 6:38:05 AM xpstar.dll 0x7ffbf7c60000 0x6e000 c:\Program Files\Microsoft SQL Server\MSSQL14.MSSQLSERVER\MSSQL\Binn\xpstar.dll Microsoft Corporation 2017.0140.3238.01 ((SQLServer2017-CU14).190913-2228) 9/14/2019 6:47:53 AM Non_working Server <<<<<<<<<<<<<<< HKRUNTIME.DLL 0x7fffea270000 0x2d0000 \Device\CSVVolume137\MSSQL13.KCOM1S130EDAM01\MSSQL\BINN\HKRUNTIME.DLL 1/1/1970 8:00:00 AM OPENDS60.DLL 0x7ffffe550000 0x9000 \Device\CSVVolume137\MSSQL13.KCOM1S130EDAM01\MSSQL\BINN\OPENDS60.DLL 1/1/1970 8:00:00 AM QDS.DLL 0x7fffeac80000 0xdc000 \Device\CSVVolume137\MSSQL13.KCOM1S130EDAM01\MSSQL\BINN\QDS.DLL 1/1/1970 8:00:00 AM SQLEVN70.RLL 0x7fffe5180000 0x2f0000 \Device\CSVVolume137\MSSQL13.KCOM1S130EDAM01\MSSQL\BINN\RESOURCES\1033\SQLEVN70.RLL 1/1/1970 8:00:00 AM SQLBOOT.DLL 0x7fffeb230000 0x2e000 \Device\CSVVolume137\MSSQL13.KCOM1S130EDAM01\MSSQL\BINN\SQLBOOT.DLL 1/1/1970 8:00:00 AM SQLDK.DLL 0x7fffe97b0000 0x4c8000 \Device\CSVVolume137\MSSQL13.KCOM1S130EDAM01\MSSQL\BINN\SQLDK.DLL 1/1/1970 8:00:00 AM SQLLANG.DLL 0x7fffddf90000 0x25c7000 \Device\CSVVolume137\MSSQL13.KCOM1S130EDAM01\MSSQL\BINN\SQLLANG.DLL 1/1/1970 8:00:00 AM SQLMIN.DLL 0x7fffe0560000 0x24fa000 \Device\CSVVolume137\MSSQL13.KCOM1S130EDAM01\MSSQL\BINN\SQLMIN.DLL 1/1/1970 8:00:00 AM SQLOS.DLL 0x7fffff390000 0x7000 \Device\CSVVolume137\MSSQL13.KCOM1S130EDAM01\MSSQL\BINN\SQLOS.DLL 1/1/1970 8:00:00 AM SQLSERVR.EXE 0x7ff7c29d0000 0x68000 \Device\CSVVolume137\MSSQL13.KCOM1S130EDAM01\MSSQL\BINN\SQLSERVR.EXE 1/1/1970 8:00:00 AM SQLTSES.DLL 0x7fffe5470000 0x88b000 \Device\CSVVolume137\MSSQL13.KCOM1S130EDAM01\MSSQL\BINN\SQLTSES.DLL 1/1/1970 8:00:00 AM We can see HKRUNTIME already loaded in our problematic SQL, so the next most possible DLL should be the HKEngine.dll HKCompile.dll. Then check them in your environment, they do have some problem in those DLLs, for example the size/the modified date. Then we rename those DLL, for example HKEngine.dll.Old, and then run repair SQL Server, and after that we confirmed 1 instance start successfully. Solution: ======== HKEngine.dll HKCompile.dll has some problem when SQL Server trying to load them. So rename them and then run SQL Repair, and new DLL will be generated, then SQL Server start successfully.23KViews1like1Comment