reporting
77 Topics
Microsoft Perception helps IT drive outcomes and scale
Attackers now move in hours. The Microsoft Digital Defense Report 2026 notes that new vulnerabilities can be weaponized in under a day, and roughly 40,000 CVEs were published in the first half of 2026 alone, a pace on track to roughly double. Unpatched vulnerabilities can leave organizations exposed, making timely identification, prioritization, and remediation essential to endpoint security. Security teams often focus on identifying and prioritizing risk, while IT teams manage the deployment of fixes across devices. IT teams roll out fixes at scale but need the context for which risks matter most. The workflows between these two teams are often fragmented across tickets and manual handoffs. And yet, IT is increasingly being asked to protect more: more devices, more apps, and now AI agents. As Hayete Gallot, Executive Vice President of Microsoft Security, wrote when introducing Project Perception, "approaches built for a world of human actors cannot keep pace" with AI, agents, and machine-speed attacks. At Microsoft Ignite, we are introducing Microsoft Perception capabilities specifically for IT in Microsoft Intune to help teams scale to meet this expanding set of responsibilities. These capabilities shift IT from chasing tickets and reconciling lists to reviewing plans, approving change, and proving outcomes. What Microsoft Perception means for IT Microsoft Perception is an agentic security system in which red, blue, and green team agents drive security outcomes across the security lifecycle, with humans in the loop. In October, we extended Perception to secure the agentic insider specialized agents. Perception and Microsoft Agent 365 now share a unified agent registry, giving IT and security a consistent view of agents and risk. We now expand the power of Perception to IT. Perception connects critical workflows and closes the gap between security teams that prioritize risk and IT teams that deploy change. For IT pros, Perception brings three connected capabilities into Intune: Plain language exploration converts tenant endpoint data into actionable insights conversationally – no multi-step queries and cross exports needed. The Vulnerability Remediation Agent in Intune turns prioritized risk into exposure reduction plans ready for approval. Custom reports track progress and verify outcomes in a repeatable manner. By bringing shared security context and a path to remediation directly into Intune, these capabilities help IT meet expanding responsibilities, prioritize fixes, and move faster from understanding risk to acting on it. With fewer disconnected steps between security and IT, teams can shift from chasing tickets to reviewing plans, approving change, and proving outcomes. Putting shared security context and a path to remediation directly into Intune helps to move from understanding which risks matter most to acting on them faster, with fewer disconnected steps between security and IT. Get actionable insights: Ask, and get the deeper data story It is now incredibly easy to ask deep questions that would otherwise require hand stitching exports. Just ask, “Which non-compliant devices on each OS version have not checked in during the last 30 days?” or “Which devices are still running a vulnerable app version or are missing the latest security update?” Perception returns a table, shows how it arrived at the results, and flags when results are partial. Simply open Perception in the Intune admin center, begin a new chat, and describe the required outcome. Perception writes and runs the queries, combines results across data sources, and explains each step with citations. Review the queries behind the answer without having to write them or look up an API. To act, add the affected devices or users to a new or existing group and follow through with familiar Intune tools. Data exploration and actions runs as you: you see only the data your role-based permissions allow you to access and act on. Better AI answers also depend on better data. Intune platform improvements are moving device data closer to near real time, with faster app inventory and policy reporting on Windows giving Perception a more current picture of your environment to reason from. More current device data can help to provide insights based on recent information, while timestamps show how current is the underlying data. See risk the way Security sees it In Microsoft Defender, Perception green team agents produce the risk prioritization that tells teams what to fix first. Those rankings and their reasoning aren't locked in another team's console. IT administrators with access to Perception in Microsoft Defender can also review these risk prioritizations and their supporting context. The Posture Prioritization Agent, now generally available, scores each exposure on likelihood, potential impact, asset criticality, exploitability, reachability, and how many resources are affected. It looks for single fixes that reduce risk across several assets, and for each item it explains why it matters and which critical assets are involved. The Risk Reduction Agent, in public preview, puts that analysis into action through the Reduce exposure risk playbook. When a permanent fix is ready, it coordinates patching through Intune while IT keeps control of deployment. When patching isn't immediately possible, it can shield the vulnerability with targeted, temporary protection, then track progress toward closure. Risk scoring now extends to agents, too. Many agents run on endpoints IT manages, contained by controls IT owns, such as execution containers and software compliance policies in Intune. Dynamic Agent Risk combines signals from identity, data, endpoints, cloud, network, runtime, and the agent’s own activity. It scores how securely each agent is configured, what it can reach, its potential impact if something goes wrong, and whether its actions are drifting from the intent of its task. The score updates as behavior changes rather than being set once at onboarding. When an agent’s risk rises, IT can see why and tighten those controls instead of waiting on a ticket from the SOC. Whether the risk is a vulnerable app or a drifting agent, admins arrive in Intune knowing which fix matters most. Act intelligently: the Vulnerability Remediation Agent The Vulnerability Remediation Agent in Intune combines Microsoft Defender vulnerability intelligence with Intune device and app context to build prioritized, tenant-specific remediation plans. For every plan, the agent weighs severity and exploit likelihood, and classifies each fix as either an OS update or an app update. OS updates can be expedited at any time; app updates are matched to managed, catalog, or WinGet apps. The agent ranks plans with reasoning. Rather than handing IT a list of CVEs, it focuses on the most impactful vulnerability reduction recommendations. Each recommendation is centered on an action, and one remediation action may address multiple CVEs across affected devices. One agent, two ways in As a standalone agent in Intune, the vulnerability reduction agent gives IT an independent path to act on risk. Admins can review prioritized Defender recommendations, generate remediation plans, and execute them in a single pane, without waiting for a request from the security team. When a broader initiative flags a critical OS update, that fix surfaces as a priority the next time the admin runs the agent. The agent also works hand in hand with the Risk Reduction Agent from Perception in Defender. When the Risk Reduction Agent identifies an app or OS vulnerability that needs remediation, IT can run the Vulnerability Remediation Agent in Intune. It combines that context and priority with the tenant’s Intune environment to build a specific, actionable plan grounded in the organization’s device state. IT receives the plan ready for review before any action is taken. Agentic, but governed Faster remediation must be balanced with IT oversight. The agent proposes remediation plans, while administrators retain control over deployment decisions. Admins review and can change every target, exclusion, and safeguard, and nothing runs without a human decision. Approved plans roll out through deployment rings, starting with a ring 0 pilot with success thresholds before moving to ring 1. Admins can act only on devices within their role and scope tags. Every run is logged, including agent activity, run results, and when each suggestion was applied. Turn answers into proof with custom reports An answer is useful once. A report is useful every day. When an investigation is worth repeating, it can be saved as a custom report, with data views and advanced visualizations in one place. The report keeps the recipe behind the answer: the queries, API calls, and analysis steps. Each time it is opened from Custom reports in the Perception pane, it automatically reruns that recipe on the latest data and displays the results. Cards can be added to place related views side by side, such as devices by platform and by OS version. That turns one-off investigations into repeatable checkpoints. A Windows upgrade report refreshes and older versions phase out. A remediation rollout report monitors key insights and helps administrators monitor deployment progress, changes in exposure, and understand which devices have received fixes. Custom reports help IT support deceisions with current, traceable data. How Perception in Intune changes IT work IT scales to meet expanding responsibilities. As IT takes responsibility for more devices, apps, agents, and containers, these capabilities connect the work of finding, prioritizing, addressing, and verifying exposure. Data exploration scopes exposure without exports, risk scores identify the most important fix, the Vulnerability Remediation Agent turns that priority into a plan to close CVEs, and shielding covers vulnerabilities that cannot yet be patched. Custom reports confirm that exposure has closed, helping teams extend their reach across the environment. Prioritize remediation with greater context. Prioritized recommendations put the most important fix first, one action can close several CVEs, and tenant-specific plans move straight from insight to deployment. The work itself changes. IT moves from chasing tickets and reconciling lists to reviewing plans, approving change, and proving outcomes. Security and IT share context, scope, and accountability in one connected workflow, while safe ring-based rollouts keep users productive. AI should do more than provide answers. It should help IT teams turn security insights into informed remediation decisions and measurable progress. Get started Microsoft Perception in Intune, including data exploration, custom reports, and the Vulnerability Remediation Agent, is available in public preview for Intune customers onboarded to Microsoft Perception. If you already use Microsoft Perception, reach out to your account representative to connect with the Intune team. If you are not yet a Perception customer, express your interest in the Intune public preview at aka.ms/IntunePerceptionPreview, and we will reach out if we are able to onboard you. To learn more about Microsoft Perception: What's new with Microsoft Perception at Ignite 2026. To see it in action at Microsoft Ignite, join these sessions: Code Session BRK404 What’s New in Intune: Secure, Patch, and Scale BRK328 What’s New in Intune: Trusted device and app foundation for AI BRK322 Stay ahead of endpoint risk with AI-powered discovery and remediation BRK391 Manage and Govern AI Agents on Windows as Your Trusted Execution Layer BRK405 Trust, Enforced: How Windows delivers security for the AI era BRK339 Local agents are here. Can you find and secure them? BRK323 Project Perception Roadmap: New Capabilities, Use Cases & What's Next Stay up to date! Bookmark the Microsoft Intune Blog and Intune Customer Success Blog and follow us on LinkedIn or @MSIntune and @IntuneSuppTeam on X to continue the conversation.712Views0likes0CommentsRegistry Inventory in Microsoft Intune: Verifying What’s on Your Devices
By: Madison Cooks, Product Manager | Microsoft Intune IT admins need a reliable way to confirm how Windows devices are configured, especially when troubleshooting, validating compliance, or investigating security posture. Policy assignment alone doesn’t always show what’s present on the device and getting registry visibility at scale has often required custom discovery or remediation scripts that take time to build, test, and maintain. With Microsoft Intune’s July (2607) release, device inventory will include Windows registry data, helping IT admins verify a device’s actual configuration, not just the policy assigned. With a new Device inventory property for registry keys, you define the keys you care about in the properties catalog, and Intune collects them for you. There’s no collection logic to build or keep running. This makes registry-based configuration checks easier to operationalize across managed Windows devices, so teams can spend less time maintaining scripts and more time acting on the data. Figure 1: Microsoft Intune device inventory profile creation screen showing the Properties picker with the Registry category selected for inventory data collection. What registry data you collect Registry data collection is configured through the existing properties catalog. For each entry, provide a registry key path and, when needed, a value name. For every targeted device, the device agent attempts collection and reports: Registry key path Value name Value type Value data Microsoft Intune device inventory profile configuration page showing registry key collection settings, including registry path, collection pattern options, and value name fields. The initial release supports the following collection patterns designed for common admin scenarios that use HKEY_LOCAL_MACHINE (HKLM) paths. Single value Specify a registry path and value name to collect one value from that path. For example, collect Secure Boot certificate servicing status from HKLM\SYSTEM\CurrentControlSet\Control\SecureBoot by using values such as UEFICA2023Status, UEFICA2023Error, or UEFICA2023ErrorEvent. All values under a path, non-recursive Specify a registry path to collect all values directly under that path. This pattern doesn't include subkeys. For example, collect values directly under a Windows Update configuration path to help validate expected settings. Same value across subkeys Specify a base registry key path and a value name to collect that value from each immediate subkey. For example, collect DHCP status across network interface subkeys under HKLM\SYSTEM\CurrentControlSet\Services\Tcpip\Parameters\Interfaces. Where registry inventory data appears After collection, registry inventory data will be available in Device inventory at initial release. We’ll expand access to registry data in the coming months, including support in additional reporting and exploration experiences. Microsoft Intune Device Inventory page displaying collected Windows registry data for a device, including registry key paths, values, collection status, and timestamps. This makes registry data available alongside other inventory signals, so admins can use familiar tools to investigate configuration, validate device state, and support troubleshooting without building separate collection scripts. How admins use this You can collect registry data and view it per device in Device inventory - a verified record of each endpoint’s actual configuration and a key source of settings data on each endpoint. This helps answer questions like: Is a setting actually enabled on the device? Which app, version, or configuration is installed? Did a policy apply correctly? Why is this device behaving differently from the rest? Registry data collection in Device inventory is included with Microsoft Intune Plan 1. Collection results and limits If a registry value exists but doesn’t contain data, collection succeeds and the value appears as empty. If the registry path or value name doesn’t exist on a device, that device reports Not found for the collection result. Collection continues for all other devices, so one missing value won’t block results from devices where the value exists. Registry inventory includes safeguards to keep collection focused and manageable. Each collected registry value is capped at 6 KB, and each device can collect up to 100 registry keys. If a value or device exceeds these limits, collection skips the excess data and reports the applicable result for that device. These limits help manage data volume, maintain service performance, and reduce the risk of over-collection. Registry inventory is designed for configuration visibility and troubleshooting, not for collecting sensitive or confidential data. Built-in heuristic detection helps identify and prevent ingestion of values that may contain secrets, credentials, authentication tokens, certificates, private keys, connection strings, or other data that could grant access if exposed. If a value is flagged as potentially sensitive, it isn’t collected. Collection is limited to HKEY_LOCAL_MACHINE (HKLM) paths. This keeps inventory focused on device-level configuration and avoids user-specific registry contexts. Summary Registry inventory in Microsoft Intune helps admins collect Windows registry data in a native, declarative way. Instead of maintaining custom scripts for common inventory scenarios, admins can configure registry collection in the properties catalog and query the results through familiar Intune reporting experiences. Use registry inventory for configuration visibility and troubleshooting across managed Windows devices. As you plan your collection strategy, focus on device-level HKLM data, avoid sensitive values, and remember collection limits to keep inventory targeted and manageable. If you have any feedback or questions, leave a comment below or reach out to us on X @IntuneSuppTeam.19KViews3likes16CommentsFrom hours to minutes: Rethinking Microsoft Intune compliance reporting with the Export API
By: Daniel Gerrity – Principal Product Manager | Microsoft Intune If you manage a large device fleet with Microsoft Intune, you’ve almost certainly needed to get reporting data out of the service at scale — compliance state, device inventory, app status, endpoint analytics, or one of the many other reports admins rely on for operations and audit evidence. Intune supports this pattern through the export API, which generates supported reports as asynchronous export jobs instead of requiring you to retrieve the same data through thousands of operational Graph calls. You can see the full list of reports available through the export API in Intune reports and properties available using Graph API documentation. In the illustrative scenario below, moving one nightly job from operational Graph reporting endpoints to the Intune export API (exportJobs) cuts the work from roughly 100,000 API calls to about 15 while producing the same report data. The runtime drops from ~2.5 hours to ~15 minutes. Here’s how, and why the pattern holds up as your fleet grows. Note on the numbers The figures below are a representative example for a hypothetical 50,000-device enterprise, “Contoso,” and are rounded for clarity. Your results may vary based on fleet size, policy count, and how many compliance settings you evaluate. The scenario Contoso runs a nightly job that answers a deceptively simple question: For each device, across every compliance policy assigned to it, what is the state of each individual setting? This is a classic per-device, per-compliance-policy, per-setting state export. It’s the raw material behind compliance dashboards, audit evidence, remediation targeting, and “why is this device noncompliant” investigations. In Intune’s reporting catalog, this is the DeviceStatusSummaryByCompliancePolicySettingsReportV3 report. Contoso has ~50,000 managed devices, and the job runs once a day. The old way: Operational Graph APIs The intuitive approach treats compliance data as something you fetch, per device, right now. The script: Enumerates the fleet (managedDevices). Loops over every device, and for each one calls the operational reporting or setting-state endpoints (such as managedDevices detail and settingStates) to pull that device’s per-policy, per-setting results. Pages through the results in small JSON pages (often 50 rows at a time), reassembling everything client-side. It works. It just doesn’t scale because the number of calls is a function of the number of devices. At roughly two operational calls per device, 50,000 devices is on the order of ~100,000 Graph calls per run. That volume brings its own tax: Throttling. You hit service protection limits and have to implement retry/back-off logic. Threading. To finish inside the window at all, you parallelize which means concurrency bugs, partial failures, and harder debugging. Fragility. A run that makes 100,000 calls has 100,000 chances to fail, and a mid-run failure often means starting over. Time. End=to-end, the job lands around ~2.5 hours. Every time Contoso onboards more devices, this job gets slower and more expensive - the worst possible scaling direction for something that runs every night. The new way: Export API (exportJobs) The export API flips the model. Instead of asking Graph to compute results device-by-device in real time, you ask Intune to generate the entire report once, server-side, and hand you back a single file. The flow is a short, asynchronous handshake: 1. POST /deviceManagement/reports/exportJobs { "reportName": "DeviceStatusSummaryByCompliancePolicySettingsReportV3", "format": "csv", ...optional filter/select... } → returns a jobId, status: "notStarted" 2. GET /deviceManagement/reports/exportJobs('{jobId}') → poll until status: "completed" (a handful of polls while it builds) → response includes a short-lived download URL 3. GET {download URL} → one zipped CSV containing every device × policy × setting row That’s the whole pattern: request → poll → download → unzip → load. One report, one file, the entire fleet inside it. Count the calls: one POST to start the job, a handful of GET polls while Intune builds the file, and one GET to download it - call it ~15 calls total. Not ~15 per device. ~15 for the whole 50,000-device run. And that number barely moves whether Contoso has 50,000 devices or 150,000. Runtime drops to about ~15 minutes, most of which is simply waiting for the export to finish - cheap poll calls, not active compute. Most importantly, the output schema is identical. The CSV columns match what the old per-device loop assembled, so nothing downstream; dashboards, warehouse tables, alerting, has to change. You swap the acquisition layer and leave everything else alone. Side by side Comparison Operational Graph APIs Recommended Export API ( exportJobs ) Pattern Per-device loop plus paging Async export → download one file API calls per run ~100,000 ~15 Calls scale with Number of devices Nothing. The handshake remains fixed. Runtime ~2.5 hours ~15 minutes Concurrency Threading required None needed Output schema — Unchanged and drop-in compatible Net result — ~6,000× fewer API calls ~10× faster runtime Why it scales: Roundtrips, not bytes Here’s the subtlety worth internalizing, because it’s easy to get wrong. There are two different costs in this job, and they scale on different axes: The number of API calls - round-trips across the wire. The volume of data - the actual compliance rows you move. The data volume is the same either way. 50,000 devices × N settings is 50,000 × N rows, whether you assemble them from 100,000 little paged responses or receive them in one CSV. The export doesn’t move less data - it moves the same data. And yes, that file grows with both device count and setting count. More devices, bigger file; more settings, bigger file. So the win isn’t fewer bytes. The win is fewer round-trips. Every one of those 100,000 operational calls relies on authentication, TLS setup, network latency, and service-protection (throttling) accounting regardless of how much data it returns. Multiply that fixed overhead by 100,000 and it dominates everything. The export only pays that tax twice: once to start the job, once to download the file. Intune does the assembly server-side and streams you the result in a single bulk transfer. That reframes the scaling story: Call count is essentially constant - it doesn’t grow with devices or settings. It’s one job and one download. Data volume grows with devices and settings but a bigger CSV is a bigger single download, not more calls. Bulk transfer is exactly what HTTP is good at. Runtime has a mild data dependency: a larger fleet takes Intune a little longer to build the file. But you absorb that as a few extra seconds of poll-waiting, not as thousands of extra calls you have to orchestrate, retry, and throttle-manage. What the IT admin actually gets Beyond the raw speed, here’s the value that shows up in day-to-day operations: Your maintenance window comes back. A 15-minute job leaves room for everything else. Fewer moving parts to maintain. No custom throttling handler, no thread pool, no resumability logic. Less code is less to break at 2 a.m. Reliability by design. Two roundtrips means two failure points, and the server does the heavy lifting of assembling a consistent snapshot. Lower cost and lower service impact. Eliminating ~100,000 calls is easier on your tenant’s throttling limits and a better citizen for the Intune service overall. Room to grow. Because call count is decoupled from device count, doubling the fleet doesn’t double the job, you just download a somewhat larger file. No downstream disruption. Same schema for the output means the migration is contained to the ingestion step which is a low-risk swap, not a re-platforming. When to use which The export API isn’t a universal replacement, it’s best used for bulk, point-in-time snapshots: Reach for exportJobs when you need the whole fleet’s state (or a large, filtered slice) on a schedule such as nightly compliance loads, audit exports, warehouse hydration. Stick with the operational endpoints when you need a single device right now, an interactive “check this one device” lookup, or a real-time remediation trigger where waiting on an async job doesn’t make sense. The two are complementary. The mistake isn’t using the operational APIs, it’s using them in a loop to reconstruct something the export API will hand you in one file. The takeaway The per-device loop feels natural because it mirrors how we think about devices, one at a time. But at fleet scale, the question isn’t “what’s the state of this device?” a hundred thousand times over. It’s “give me the state of everything,” once. The export API is built for exactly that question, and answering it the right way turned a multi-hour nightly grind into a coffee break - from ~100,000 calls to about 15, ~10× faster, with zero downstream changes. If you have any questions, leave a comment below or reach out to us on X: @IntuneSuppTeam!2.7KViews0likes1Comment
MS PROJECT 2019 UPDATE and Purchasing Options
HI We are currently using Microsoft Project Professional 2019 desktop version, but we are facing challenges with its reporting limitations. Specifically, the software can only display a maximum of 75 rows in its reports. As our weekly reports often exceed this limit, we find ourselves spending considerable time on manual entries. For our monthly reports, we can manage the filtering process to avoid this limitation, but the weekly reports require a hierarchical structure to display task statuses, and unfortunately, there is no workaround for this constraint. While researching this issue, I found discussions indicating that the 2025 version of Microsoft Project can display up to 150 rows, which would help us address our challenges. I have a couple of questions: 1. Does the new version of Microsoft Project 2025 indeed support the display of up to 150 rows? 2. What is the best approach for upgrading: subscription or standalone? 3. Could you provide pricing information and tell us where we can obtain it? Thank you! Best regards, Teshome HPU PMO Office567Views0likes1CommentCreate historical reports using Azure Log Analytics and Microsoft Intune diagnostic data
By: Janusz Gal – Sr Product Manager | Microsoft Intune Azure Log Analytics gives Intune admins a flexible way to create custom reports from diagnostic data, especially when you need longer history or tailored calculations that go beyond what the Microsoft Intune admin center’s built-in reports provide. By using the Intune diagnostic data you’re already collecting, you can customize reporting for your organization’s unique requirements. In this post, you’ll walk through the steps to create a 30-day device compliance trend report. The resultant report can be run automatically, used in dashboards, or even further customized for a longer period or with additional data. Before we begin, if you haven’t configured a Log Analytics workspace in your tenant, review the following detailed information on the pre-requisites and costs on Microsoft Learn: Route logs to Azure Monitor using Microsoft Intune. In the Microsoft Intune admin center, navigate to Reports > Diagnostic settings, and add a new Diagnostic setting policy to send data to a Log Analytics workspace. Figure 1 Reports > Diagnostic settings, used to configure new or existing diagnostic settings. For a device compliance trend report, ensure the Devices log category is selected: Figure 2 Reports > Diagnostic settings > Selected configuration; Devices log selected. After configuring the setting, navigate to Reports > under Azure monitor, Log Analytics. Figure 3 Reports > Log Analytics; used to query log Analytics workspaces. In the New Query window, enter the following query: IntuneDevices | where TimeGenerated > ago(30d) | summarize Total = count(), Compliant = countif(CompliantState == "Compliant"), NonCompliant = countif(CompliantState == "Noncompliant"), InGracePeriod = countif(CompliantState == "InGracePeriod"), NotEvaluated = countif(CompliantState == "Not Evaluated" or CompliantState == ""), ConfigManager = countif(CompliantState == "ConfigManager") by bin(TimeGenerated, 1d) | extend ComplianceRate = round(100.0 * Compliant / Total, 2) | order by TimeGenerated asc This query will return daily device compliance trends over the past 30 days, from the IntuneDevice table. Figure 4 Reports > Log Analytics; results after running query. Select Chart > Chart type > Stacked Area to show a visual of the trending device state over time. Figure 5 Reports > Log Analytics > Chart > Stacked Area. If you’d like to create other reports but aren’t sure of the schema, one trick you can use is to run the following query in the above Log Analytics workspace to get all the column names: IntuneDevices | getschema Then to get all the values from those columns, you can modify the query to return the distinct values from a specific column such as CompliantState: IntuneDevices | distinct CompliantState Now that you have the query created in Log Analytics, you can save it to run anytime, pin it to a dashboard, or even create a new alert rule to let you know if compliance has gone below a certain threshold. To pin it as a dashboard, on the Query pane select the ellipsis (…) > Pin to > Azure dashboard. Figure 6 Reports > Log Analytics; pin query to dashboard flow. Then select the dashboard you’d like to use. Figure 7 Reports > Log Analytics; select dashboard to pin. Once pinned, simply navigate to Dashboard within the Intune admin center, and you’ll see the query pinned on the selected dashboard. Figure 8 Dashboard showing Log Analytics query. To show more than the past 24-hours, select the Customize Tile button and select Override the dashboard time settings at the tile level, with Timespan set to Past 30 days. Figure 9 Dashboard > Selected Query > Customize Tile button. If you’d like to always see the data in a chart form, select the edit icon on the pinned dashboard item and append the following to the end of the query: | render areachart with (kind=stacked) Figure 10 Dashboard > Selected query > Edit > modified query to show chart. After clicking Apply, the dashboard shows the following: Figure 11 Dashboard showing updated historical device compliance query as a stacked area chart. You’ve now seen end-to-end how to turn Intune diagnostic data into a 30-day device compliance trend report with diagnostic data and Log Analytics. From here, the next step is to operationalize it - save the query, extend the timeframe, join in additional diagnostic tables, or set an alert so you’re notified when compliance drops below your threshold. Better yet, see if you can pick one reporting gap your team is living with today and build it using this pattern. With the right tooling, Intune data can be shaped into views and insights that reflect your organization’s unique needs. Let us know if you have any questions by leaving a comment below or reach out on X @IntuneSuppTeam!3.1KViews0likes0Comments
Baseline Resourcing Assistance
Hello, I have been transferring a 1700 line schedule from a different program into MS Project. I have got the current schedule loaded and resourced, and all is working well. I have set this now as Baseline1. As part of reporting requirements, I have been asked to report current state (Baseline1) against original state (Baseline). I manually loaded the original baseline dates into Baseline Start & Baseline Finish columns on the schedule, prior to setting Baseline1 in the hope this would force those dates to become Baseline. When I run the Visual 'Baseline Work' Report for Cumulative Actual Work vs Baseline1 Work, I get the expected result, but if I also import Baseline work that data reads as 0, as it appears the resources have not applied to the baseline to create a work calculation for measurement. How can I ensure the resources are applied to all 3 fields (Baseline, Baseline1 and Actual)? Thanks in advance, KSolved831Views0likes4Comments
Workload by week/ month export to Excel
I like to use Visual report, but that doesn’t work.. I have MSProject 2016 and office 365. so I have tried to use save as (export) as xls. But I can’t get the load or week or month. anyone that can help out setup in table format. I think… the I can build the rest in Excel if needed br runeSolved831Views0likes4Comments
Regarding Existing Microsoft Applications for End-to-End Operational Management
I would like to inquire whether Microsoft offers any pre-built, production-ready applications—preferably within the Dynamics 365 ecosystem—that are currently in use by customers and proven to be stable, which support the following functionalities: Work Order Management Operational Management Production Planning and Control Resource Management Asset Management Quality Management Inventory Management Barcode Scanning for real-time job tracking (start/finish) Profitability and Financial Reporting Hours Variation Analysis( Planned Vs Actual) Cost Variation Analysis( Planned Vs Actual) We are seeking a solution that integrates these capabilities into a unified platform, ideally with real-time data capture and reporting features. If such a solution exists, we would appreciate details regarding its availability, deployment options, licensing, and customer success stories. Looking forward to your guidance
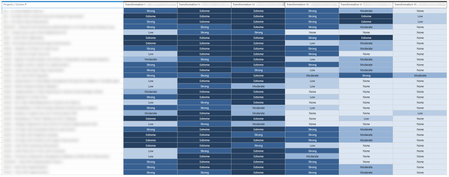
Project Online - Business Drivers matrix table in Power BI
Hi! After classifying our ongoing projects we could get to this matrix table in Project Online: There are 6 Business Drivers where each project contributes on a rating scale (None, Low, Moderate, Strong, Extreme) I am stuck on Power BI to find the relation between each Project, the rating scale and each Business Driver to be able to build the same matrix table in Power BI: Any help would be much appreciated!890Views0likes6Comments