observability
4 TopicsFind and fix app issues - Azure Copilot Observability Agent
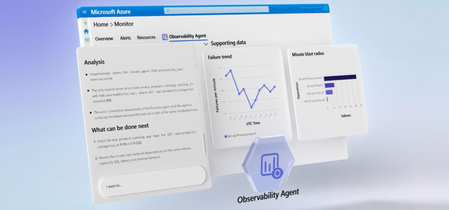
The Azure Copilot Observability Agent autonomously investigates incidents, correlates signals across logs, metrics, alerts, application health, and ML anomalies, then surfaces root cause with charts and recommended next steps. Extend coverage to your AI agents in Microsoft Foundry, track Gen AI errors and token consumption with trace-level detail, and write plain-language instructions to tune autonomous behavior to match your team’s workflow. Matt McSpirit, Microsoft Azure expert, shares how to take full control of incident response at scale. Any alert, full stack. The Azure Copilot Observability Agent correlates OpenTelemetry & native Azure signals end-to-end. Trace any issue to deep failure analysis across every tier. Check it out. Logs. Metrics. Alerts. ML anomalies. The Azure Copilot Observability Agent correlates them all, surfaces root cause, and recommends mitigation steps automatically. See it here. Tune the Azure Copilot Observability Agent to match your team’s workflow. Write natural-language instructions to set alert groupings, escalation rules, and issue priorities. See how. QUICK LINKS: 00:00 — Azure Copilot Observability Agent 00:43 — How to use it as you work 01:33 — Unified Full-Stack Telemetry 02:39 — Root Cause Investigation 04:12 — Investigate further 04:55 — Re-run the investigation 05:36 — Autonomous Alert Correlation & Triage 07:13 — Natural Language Agent Customization 07:34 — Wrap up Link References Get started at https://aka.ms/ObservabilityAgent Unfamiliar with Microsoft Mechanics? As Microsoft’s official video series for IT, you can watch and share valuable content and demos of current and upcoming tech from the people who build it at Microsoft. Subscribe to our YouTube: https://www.youtube.com/c/MicrosoftMechanicsSeries Talk with other IT Pros, join us on the Microsoft Tech Community: https://techcommunity.microsoft.com/t5/microsoft-mechanics-blog/bg-p/MicrosoftMechanicsBlog Watch or listen from anywhere, subscribe to our podcast: https://microsoftmechanics.libsyn.com/podcast Keep getting this insider knowledge, join us on social: Follow us on Twitter: https://twitter.com/MSFTMechanics Share knowledge on LinkedIn: https://www.linkedin.com/company/microsoft-mechanics/ Enjoy us on Instagram: https://www.instagram.com/msftmechanics/ Loosen up with us on TikTok: https://www.tiktok.com/@msftmechanics Video Transcript: -When you run compute services at scale, issues are bound to happen. The real question is how quickly you can understand and fix them. This is where AI can cut through the noise, bringing you the right signals so that you can start your day with critical issues already investigated. Azure Copilot Observability Agent, powered by Azure Monitor, can run autonomously with knowledge of your environment, application topology, its dependencies and typical patterns. It monitors alerts streaming into Azure Monitor, triaging and correlating related alerts into issues requiring your attention so that you experience less alert fatigue and noise. The agent investigates critical issues to determine the root cause, and then recommends mitigation steps. Let me walk you through how you can use the Observability Agent to your advantage as you work. -Using Azure Monitor, I can observe my app, across tiers. The App map shows me the topological view of my app. It’s a multi-tier app with a modern micro-service backend, hosted on Kubernetes, with a SQL database, Redis cache and more. The app also has an agent built in Microsoft Foundry, and with the new Foundry capabilities, I can also observe how it is performing from operational metrics, including Agent Runs, Gen AI Errors, Tool Calls, underlying Models, and Token Consumption. And scrolling up, we can even view traces with Gen AI errors and can see a list of traces. I’ll look at this one with 93 items. And if I click in, I can see a trace view of all the agent’s activities with direct integration into our existing backend APIs through an MCP server. This is where Azure Monitor and unified logging is foundational to connecting the dots for a more complete view of the health of your service. It unifies telemetry in real time across the stack using OpenTelemetry as well as native integrations with Azure Services and normalizes those signals into a consistent schema. -And because everything shares the same data foundation, it’s easy for either you or the Observability Agent to move instantly from insights, such as failed requests to more details across different failure categories, which can be drilled into and queried further without having to stitch anything together. So, this way even though there are several teams involved across app and infrastructure managing my app, everyone shares a common operational view to keep it operating smoothly. -In fact, let’s go back into Azure Monitor to see how my app is doing, specifically my agent. This time I’ll start in our agent alerts view. It looks like my agent is experiencing some errors I’ll choose this alert, to view additional details and this is where you can invoke the Observability Agent using the investigate button. Importantly, once you have Azure Monitor running in your environment, there is no setup needed. -So, now I have the agent open. Let’s start the investigation. Now, when invoked for the first time, the Observability Agent will learn about your app, its topology, patterns, baselines, and more. In this case, the agent already has deep knowledge of my app so it launches directly into an investigation. It’s able to correlate and reason across signals spanning the full application stack, logs, metrics, alerts, application health, and ML-detected anomalies, to pinpoint the root cause of the incident. It plans, executes, backtracks, runs multiple queries and validates or disproves hypotheses, just like a human expert would. After completing the investigation, Observability Agent produces a detailed report with its findings. Now in this case, it’s discovered failures when the agent hit the MCP product catalog where the backend telemetry shows the underlying failure was a SQL execution time out. We can see a consistent time out pattern with 117 failed SQL dependency calls. It’s ruled out any issues with the Redis cache. And has determined that there was NO SQL outage. -Instead, SQL metrics show a small saturation window at the incident start which dropped after the initial spike which would have led to connection failure. And it also charts its findings visually with search failures, latency spikes, failures by dependency and CPU and DTU spikes. And back on the left we see it’s recommending what can be done next, including how to improve querying and code, as well as monitoring. -Now at this point, you can either start a new investigation or build off the Observability Agent’s findings. I want to investigate further. There are a few things that cause spikes like this so I’m going to clarify if our SQL server saw a spike in traffic leading to timeouts. The Observability Agent responds quickly and notes stable to moderate SQL volume with many of the details we saw earlier. This time though, it’s found the root cause. It appears that an expensive query consumed significant SQL CPU resources. I am also concerned about token usage during the incident so I’ll ask the Observability Agent to check for anomalies. And after it’s done its analysis, the agent rules out my hypothesis there too. -So, it’s easy to collaborate with the Observability Agent, in the context of the incident. You can even ask the agent to re-run the entire investigation with additional instructions if you need to. Next, I want to create an issue that captures the progress of the investigation I’ll keep all the details and agree to share the agent chat around this issue so that it can be viewed by others on my team, which lets you hand off the issue to a colleague without losing context. The issue will retain the history of the incident, so no one has to start from scratch. In fact, this becomes a shared case file for the investigation. -So, I just walked you through a manual flow for how you can use the new Observability Agent as you work. Next, let me show you how you can get the Observability Agent to work alongside you autonomously on your behalf with a new capability in public preview. Either from the marketplace or Azure Monitor, you can create a new Observability Agent resource. -First, you start by giving it name, selecting the region, and your Azure Monitor workspace. Next, you’ll point it at your Application Insights resource. We’ll use our “ct-agent” from before. And then you can configure whether you want the agent instance to run autonomously on auto-created issues to provide root cause analysis and next steps. From there, I just review and confirm. The Observability Agent will then learn about your application to establish deep expertise and knowledge of your environment and preserve it in the agent instance. And if an alert arrives, the agent creates an issue automatically and correlates any additional related alerts into that same issue, before launching an investigation. -Now once an investigation is underway, the Observability Agent notifies you, for example, via email, with background on the detected issue. And from there, you can review the overview and look at the associated alerts. As you can see, in our case, the Observability Agent was able to use deep, agentic reasoning to correlate separate alerts both for the agent in this application and for the backend APIs invoked independently and then bring them together into a single, unified view. This significantly reduces alert noise. -Now this correlation is also important for issue triage. Because individually, these alerts might have lower severity, but when correlated, they increase the overall severity of the issue. And clicking into the Observability Agent tab we can see that the investigation is complete. This is a comprehensive report like we saw earlier with its analysis, corresponding chart visualizations, and recommendations on what to do next. Now as you set up agents, you can also customize them with your own instructions to prioritize what’s important. So, if we go back to where you create a new agent instance, here’s where you would add specific instructions, written in natural language. For example, you can tell an agent to group certain alerts, and prioritize the ones that should always trigger an issue so that its autonomous behavior matches how your team operates. -So that’s the power of Azure Monitor with the Azure Copilot Observability Agent which together turn alerts into fully investigated issues with clear, actionable insights. By correlating signals across your entire stack, it helps you move from detection, to root cause, to action-faster, and without losing context. The result: less time triaging, faster resolution, and more resilient systems at scale. To learn more, visit aka.ms/ObservabilityAgent. Keep watching Microsoft Mechanics for the latest tech updates and thanks for watching.152Views0likes0CommentsModel Mondays S2E12: Models & Observability
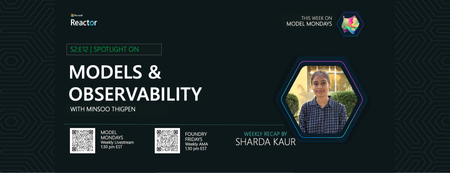
1. Weekly Highlights This week’s top news in the Azure AI ecosystem included: GPT Real Time (GA): Azure AI Foundry now offers GPT Real Time (GA)—lifelike voices, improved instruction following, audio fidelity, and function calling, with support for image context and lower pricing. Read the announcement and check out the model card for more details. Azure AI Translator API (Public Preview): Choose between fast Neural Machine Translation (NMT) or nuanced LLM-powered translations, with real-time flexibility for multilingual workflows. Read the announcement then check out the Azure AI Translator documentation for more details. Azure AI Foundry Agents Learning Plan: Build agents with autonomous goal pursuit, memory, collaboration, and deep fine-tuning (SFT, RFT, DPO) - on Azure AI Foundry. Read the announcement what Agentic AI involves - then follow this comprehensive learning plan with step-by-step guidance. CalcLM Agent Grid (Azure AI Foundry Labs): Project CalcLM: Agent Grid is a prototype and open-source experiment that illustrates how agents might live in a grid-like surface (like Excel). It's formula-first and lightweight - defining agentic workflows like calculations. Try the prototype and visit Foundry Labs to learn more. Agent Factory Blog: Observability in Agentic AI: Agentic AI tools and workflows are gaining rapid adoption in the enterprise. But delivering safe, reliable and performant agents requires foundation support for Observability. Read the 6-part Agent Factory series and check out the Top 5 agent observability best practices for reliable AI blog post for more details. 2. Spotlight On: Observability in Azure AI Foundry This week’s spotlight featured a deep dive and demo by Han Che (Senior PM, Core AI/ Microsoft ), showing observability end-to-end for agent workflows. Why Observability? Ensures AI quality, performance, and safety throughout the development lifecycle. Enables monitoring, root cause analysis, optimization, and governance for agents and models. Key Features & Demos: Development Lifecycle: Leaderboard: Pick the best model for your agent with real-time evaluation. Playground: Chat and prototype agents, view instant quality and safety metrics. Evaluators: Assess quality, risk, safety, intent resolution, tool accuracy, code vulnerability, and custom metrics. Governance: Integrate with partners like Cradle AI and SideDot for policy mapping and evidence archiving. Red Teaming Agent: Automatically test for vulnerabilities and unsafe behavior. CI/CD Integration: Automate evaluation in GitHub Actions and Azure DevOps pipelines. Azure DevOps GitHub Actions Monitoring Dashboard: Resource usage, application analytics, input/output tokens, request latency, cost breakdown, and evaluation scores. Azure Cost Management SDKs & Local Evaluation: Run evaluations locally or in the cloud with the Azure AI Evaluation SDK. Demo Highlights: Chat with a travel planning agent, view run metrics and tool usage. Drill into run details, debugging, and real-time safety/quality scores. Configure and run large-scale agent evaluations in CI/CD pipelines. Compare agents, review statistical analysis, and monitor in production dashboards 3. Customer Story: Saifr Saifr is a RegTech company that uses artificial intelligence to streamline compliance for marketing, communications, and creative teams in regulated industries. Incubated at Fidelity Labs (Fidelity Investments’ innovation arm), Saifr helps enterprises create, review, and approve content that meets regulatory standards—faster and with less manual effort. What Saifr Offers AI-Powered Compliance: Saifr’s platform leverages proprietary AI models trained on decades of regulatory expertise to automatically detect potential compliance risks in text, images, audio, and video. Automated Guardrails: The solution flags risky or non-compliant language, suggests compliant alternatives, and provides explanations—all in real time. Workflow Integration: Saifr seamlessly integrates with enterprise content creation and approval workflows, including cloud platforms and agentic AI systems like Azure AI Foundry. Multimodal Support: Goes beyond text to check images, videos, and audio for compliance risks, supporting modern marketing and communications teams. 4. Key Takeaways Observability is Essential: Azure AI Foundry offers complete monitoring, evaluation, tracing, and governance for agentic AI—making production safe, reliable, and compliant. Built-In Evaluation and Red Teaming: Use leaderboards, evaluators, and red teaming agents to assess and continuously improve model safety and quality. CI/CD and Dashboard Integration: Automate evaluations in GitHub Actions or Azure DevOps, then monitor and optimize agents in production with detailed dashboards. Compliance Made Easy: Safer’s agents and models help financial services and regulated industries proactively meet compliance standards for content and communications. Sharda's Tips: How I Wrote This Blog I focus on organizing highlights, summarizing customer stories, and linking to official Microsoft docs and real working resources. For this recap, I explored the Azure AI Foundry Observability docs, tested CI/CD pipeline integration, and watched the customer demo to share best practices for regulated industries. Here’s my Copilot prompt for this episode: "Generate a technical blog post for Model Mondays S2E12 based on the transcript and episode details. Focus on observability, agent dashboards, CI/CD, compliance, and customer stories. Add correct, working Microsoft links!" Coming Up Next Week Next week: Open Source Models! Join us for the final episode with Hugging Face VP of Product, live demos, and open model workflows. Register For The Livestream – Sep 15, 2025 About Model Mondays Model Mondays is your weekly Azure AI learning series: 5-Minute Highlights: Latest AI news and product updates 15-Minute Spotlight: Demos and deep dives with product teams 30-Minute AMA Fridays: Ask anything in Discord or the forum Start building: Watch Past Replays Register For AMA Recap Past AMAs Join The Community Don’t build alone! The Azure AI Developer Community is here for real-time chats, events, and support: Join the Discord Explore the Forum About Me I'm Sharda, a Gold Microsoft Learn Student Ambassador focused on cloud and AI. Find me on GitHub, Dev.to, Tech Community, and LinkedIn. In this blog series, I share takeaways from each week’s Model Mondays livestream.299Views0likes0CommentsJoin us at Microsoft Azure Infra Summit 2026 for deep technical Azure infrastructure content
Microsoft Azure Infra Summit 2026 is a free, engineering-led virtual event created for IT professionals, platform engineers, SREs, and infrastructure teams who want to go deeper on how Azure really works in production. It will take place May 19-21, 2026. This event is built for the people responsible for keeping systems running, making sound architecture decisions, and dealing with the operational realities that show up long after deployment day. Over the past year, one message has come through clearly from the community: infrastructure and operations audiences want more in-depth technical content. They want fewer surface-level overviews and more practical guidance from the engineers and experts who build, run, and support these systems every day. That is exactly what Azure Infra Summit aims to deliver. All content is created AND delivered by engineering, targeting folks working with Azure infrastructure and operating production environments. Who is this for: IT professionals, platform engineers, SREs, and infrastructure teams When: May 19-21, 2026 - 8:00 AM–1:00 PM Pacific Time, all 3 days Where: Online Virtual Cost: Free Level: Most sessions are advanced (L300-400). Register here: https://aka.ms/MAIS-Reg Built for the people who run workloads on Azure Azure Infra Summit is for the people who do more than deploy to Azure. It is for the people who run it. If your day involves uptime, patching, governance, monitoring, reliability, networking, identity, storage, or hybrid infrastructure, this event is for you. Whether you are an IT professional managing enterprise environments, a platform engineer designing landing zones, an Azure administrator, an architect, or an SRE responsible for resilience and operational excellence, you will find content built with your needs in mind. We are intentionally shaping this event around peer-to-peer technical learning. That means engineering-led sessions, practical examples, and candid discussion about architecture, failure modes, operational tradeoffs, and what breaks in production. The promise here is straightforward: less fluff, more infrastructure. What to expect Azure Infra Summit will feature deep technical content in the 300 to 400 level range, with sessions designed by engineering to help you build, operate, and optimize Azure infrastructure more effectively. The event will include a mix of live and pre-recorded sessions and live Q&A. Throughout the three days, we will dig into topics such as: Hybrid operations and management Networking at scale Storage, backup, and disaster recovery Observability, SLOs, and day-2 operations Confidential compute Architecture, automation, governance, and optimization in Azure Core environments And more… The goal is simple: to give you practical guidance you can take back to your environment and apply right away. We want attendees to leave with stronger mental models, a better understanding of how Azure behaves in the real world, and clearer patterns for designing and operating infrastructure with confidence. Why this event matters Infrastructure decisions have a long tail. The choices we make around architecture, operations, governance, and resilience show up later in the form of performance issues, outages, cost, complexity, and recovery challenges. That is why deep technical learning matters, and why events like this matter. Join us I hope you will join us for Microsoft Azure Infra Summit 2026, happening May 19-21, 2026. If you care about how Azure infrastructure behaves in the real world, and you want practical, engineering-led guidance on how to build, operate, and optimize it, this event was built for you. Register here: https://aka.ms/MAIS-Reg Cheers! Pierre Roman6KViews2likes2CommentsDiscover the Future of Data Engineering with Microsoft Fabric for Technical Students & Entrepreneurs
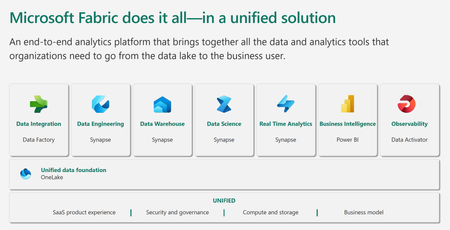
Microsoft Fabric is an all-in-one analytics solution for enterprises that covers everything from data movement to data science, Real-Time Analytics, and business intelligence. It offers a comprehensive suite of services, including data lake, data engineering, and data integration, all in one place. This makes it an ideal platform for technical students and entrepreneurial developers looking to streamline their data engineering and analytics workflows.6.2KViews4likes1Comment