observability
56 TopicsApplying Site Reliability Engineering to Autonomous AI Agents
If you practice SRE, you already have a mental model for running reliable production systems. You define SLOs. You track error budgets. You use circuit breakers to stop cascading failures. You run chaos experiments to find weaknesses before customers do. You treat every operational decision as a tradeoff between reliability and velocity. That mental model transfers directly to AI agents. It just needs four new ideas. In the Agent Governance Toolkit: Architecture Deep Dive, Policy Engines, Trust, and SRE for AI Agents, we covered Agent SRE briefly as one of AGT's nine packages: SLOs, error budgets, circuit breakers, chaos engineering, and progressive delivery, adapted from the patterns your SRE team already applies to microservices. Several teams asked for the full story. This is it. Agent SRE is one of the more novel parts of the toolkit. The policy engine, zero-trust identity, and execution sandboxing have clear analogs in existing security practice. Agent SRE explores newer ground. Established patterns for defining SLOs for AI agent behavior, building chaos experiments for LLM provider failures, or applying error budgets to agent autonomy are still emerging across the industry. We built these capabilities because running agents in production without them is the equivalent of running a fleet of microservices without circuit breakers, health checks, or an on-call runbook. This post is for SRE teams, platform engineers, and anyone responsible for running AI agents in production. You do not need to be an AI specialist. If you know what a burn rate is, you are ready for this. The Problem: Agents Fail in Ways Your Existing SRE Tooling Cannot See When a service fails, your observability stack tells you: latency went up, error rate crossed the SLO threshold, the circuit breaker opened. You page the on-call engineer. They look at traces and find the slow database query. When an AI agent fails, your observability stack is silent. The agent returned HTTP 200. Latency was normal. Error rate was zero. But the agent quietly approved a transaction it was not authorized to approve, hallucinated a database path and wrote to the wrong table, or got stuck in a reasoning loop that consumed $800 of LLM API budget before anyone noticed. These are not infrastructure failures. They are behavioral failures. And they are invisible to monitoring tools built for stateless, deterministic services, because those tools only watch for crashes and timeouts. They do not watch for wrong behavior. This gap is the problem Agent SRE was designed to solve. The solution borrows everything from the SRE playbook and adds one concept that extends it: the Safety SLI. The Safety SLI: A New Reliability Dimension Traditional SLIs measure system behavior from the user's perspective: latency, availability, error rate, throughput. They answer: did the service respond correctly? For AI agents, correctness is not enough. An agent that responds correctly but acts outside its authorized scope has not succeeded. It has failed in a way that none of your existing SLIs can detect. The Safety SLI answers a different question: did the agent act within policy? from agent_sre import SLO, ErrorBudget from agent_sre.slo.indicators import PolicyCompliance # Define a safety SLO: 99% of agent actions must comply with policy safety_slo = SLO( name="safety-compliance", indicators=[ PolicyCompliance( target=0.99, window="7d", ), ], error_budget=ErrorBudget( total=0.01, # 1% budget (1 - 0.99 target) window_seconds=2592000, # 30-day window burn_rate_alert=2.0, # warn at 2x sustainable rate burn_rate_critical=5.0, # page at 5x sustainable rate ), ) When an agent's policy compliance rate drops below 99%, the error budget starts burning. The ErrorBudget tracks consumption automatically and exposes burn rate alerts through its firing_alerts() method. When the budget is exhausted, the configured exhaustion_action determines the system response: from agent_sre.slo.objectives import ExhaustionAction # Configure what happens when error budget is exhausted safety_slo = SLO( name="safety-compliance", indicators=[PolicyCompliance(target=0.99, window="7d")], error_budget=ErrorBudget( total=0.01, window_seconds=2592000, burn_rate_alert=2.0, # fires at 2x sustainable burn rate burn_rate_critical=5.0, # fires at 5x sustainable burn rate exhaustion_action=ExhaustionAction.CIRCUIT_BREAK, # suspend agent when budget is gone ), ) # In your monitoring loop, check for firing alerts alerts = safety_slo.error_budget.firing_alerts() for alert in alerts: print(f"Alert firing: {alert.name} (severity: {alert.severity})") # Check budget status print(f"Budget remaining: {safety_slo.error_budget.remaining_percent:.1f}%") print(f"Current burn rate: {safety_slo.error_budget.burn_rate():.2f}x") print(f"Exhausted: {safety_slo.error_budget.is_exhausted}") This is the governance dial from the other direction. The error budget is not just a metric: it is the mechanism that drives agent autonomy decisions. An agent with a clean 30-day safety record earns autonomy. An agent whose budget is burning at 5x the sustainable rate triggers a critical alert, and when the budget is exhausted, the exhaustion_action fires: ALERT, THROTTLE, FREEZE_DEPLOYMENTS, or CIRCUIT_BREAK. The graduated response mirrors what SRE teams already do with service SLOs, applied to agent behavior. There are multiple SLI dimensions built into Agent SRE. Safety SLIs and Performance SLIs track different aspects of the same agent: SLI Type What It Measures Target Pattern When Budget Burns Safety SLI PolicyCompliance -- fraction of actions within authorized scope >= 99% Restrict capabilities, increase human oversight Performance SLI TaskSuccessRate, ResponseLatency, CostPerTask Configurable per workload Alert, throttle, or circuit-break LLM provider Additional built-in indicators include ToolCallAccuracy, DelegationChainDepth, HallucinationRate, and CalibrationDeltaSLI. Both SLOs feed into the same error budget dashboard. An agent can have excellent performance but a degrading safety record, or perfect safety compliance and terrible cost efficiency. You need both dimensions to understand whether an agent is production-ready. Circuit Breakers: Governing Agent Failure Modes That Don't Exist in Microservices Circuit breakers for services protect against one failure mode: a backend that is slow or unreachable. The pattern is CLOSED -> OPEN -> HALF_OPEN. You know it well. Agent SRE implements the same state machine for failure modes that are specific to autonomous reasoning systems and do not exist in traditional microservice architectures: from agent_sre.cascade.circuit_breaker import CircuitBreakerConfig, CircuitBreaker from agent_sre.chaos.engine import FaultType config = CircuitBreakerConfig( failure_threshold=5, # Open after 5 failures in the window recovery_timeout_seconds=60, # Stay OPEN for 60s before HALF_OPEN half_open_max_calls=3, # Allow 3 probes in HALF_OPEN ) breaker = CircuitBreaker(agent_id="analyst-agent-001", config=config) # Failure modes tracked by the circuit breaker: tracked_faults = [ FaultType.POLICY_BYPASS, # Agent exceeds authorized scope FaultType.ERROR_INJECTION, # Upstream model API fails FaultType.TIMEOUT_INJECTION, # Tool calls exceed time budget FaultType.TRUST_PERTURBATION, # Agent trust score falls below threshold FaultType.DEADLOCK_INJECTION, # Agent stuck in iterative reasoning ] Each failure mode has different circuit-breaking semantics: Failure Mode What Triggers It Circuit-Break Behavior Policy bypass Action denied by policy engine Count toward threshold; log with full context LLM provider error HTTP 5xx from model API Immediately open; route to fallback model if configured Tool timeout Tool call exceeds timeout_ms Count toward threshold; cancel in-flight call Trust score degradation Agent trust score drops below configured floor Open; escalate to Ring 3 (untrusted) until score recovers Reasoning loop / deadlock Token or iteration count exceeds budget Open; trigger human review before resuming The reasoning loop breaker deserves attention. A microservice cannot get stuck reasoning. An AI agent absolutely can, and when it does, the failure is not an error code: it is an agent that keeps calling tools, consuming tokens, and generating audit events indefinitely. The circuit breaker detects this pattern from the iteration count and token budget and terminates the loop: # Reasoning loop detection configuration loop_detection_config = { "max_iterations": 15, # Hard stop after 15 reasoning steps "max_tokens_per_session": 50000, # Hard stop on token consumption "repetition_threshold": 0.85, # Stop if >85% of recent actions repeat prior ones "on_detection": "circuit_break_and_escalate", } The state machine behaves identically to what you know from Hystrix or Resilience4j. What changes is the definition of "failure." CLOSED (serving) | | failure_threshold crossed for any tracked fault v OPEN (rejecting -- agent action denied, fallback or human-in-loop fires) | | recovery_timeout expires v HALF_OPEN (probe -- limited requests allowed through) | |-- success_threshold met --> CLOSED |-- any failure --> OPEN (reset timeout) Chaos Engineering for Agents: Fault Injection for Autonomous Systems The only way to know if your agent system is resilient is to break it intentionally. Traditional chaos engineering targets infrastructure: kill a pod, inject network latency, saturate a disk. Agent chaos engineering targets the failure modes specific to autonomous reasoning systems. Agent SRE ships fault injection templates that cover the failure modes teams consistently underestimate until they hit production: from agent_sre.chaos.engine import ChaosExperiment, Fault, FaultType # Experiment 1: LLM provider degrades -- model returns valid responses but with # increased latency and occasional malformed outputs experiment = ChaosExperiment( name="llm-degradation-resilience", target_agent="analyst-agent-001", description="Test agent behavior under degraded LLM provider", faults=[ Fault.latency_injection(target="llm-provider", delay_ms=8000), Fault.error_injection(target="llm-provider", rate=0.05), ], duration_seconds=300, ) # Experiment 2: Trust score manipulation -- simulates an agent receiving # messages from a peer with a spoofed trust score trust_experiment = ChaosExperiment( name="trust-manipulation-resilience", target_agent="orchestrator-001", faults=[ Fault( fault_type=FaultType.TRUST_PERTURBATION, target="did:mesh:orchestrator-001", params={"spoofed_score": 950}, ), ], duration_seconds=120, ) # Experiment 3: Tool timeout cascade -- multiple tools time out simultaneously, # testing whether the agent abandons gracefully or enters a reasoning loop cascade_experiment = ChaosExperiment( name="tool-timeout-cascade", target_agent="analyst-agent-001", faults=[ Fault.timeout_injection(target="database.read", delay_ms=30000), Fault.timeout_injection(target="api.call", delay_ms=30000), ], duration_seconds=180, ) # Run the experiment experiment.start() # ... inject faults during agent execution ... resilience = experiment.calculate_resilience( baseline_success_rate=0.95, experiment_success_rate=0.87, recovery_time_ms=48000, ) experiment.complete(resilience=resilience) print(f"Resilience score: {resilience.overall}/100 -- {'PASSED' if resilience.passed else 'FAILED'}") Additional fault types built into the chaos engine cover: prompt injection attempts, privilege escalation, data exfiltration attempts, identity spoofing, deadlock injection, and contradictory instruction scenarios. Each maps to a FaultType enum value and can be composed into multi-fault experiments. Important: The chaos engine records that a fault was injected and triggers the governance response pipeline. Actual infrastructure-level fault injection (network partition, process kill) should be implemented using your existing chaos tooling (Chaos Mesh, Gremlin, Azure Chaos Studio, or similar). Agent SRE governs the agent's behavioral response to faults; it does not own infrastructure manipulation. These two layers are designed to compose. Each chaos experiment produces a structured resilience score via calculate_resilience(), which compares baseline and experiment success rates. A score of 90+ with passed=True means the agent maintained at least 90% of its baseline performance under fault conditions. Teams use this to set minimum resilience thresholds for production readiness. Replay Debugging: Reproduce Behavioral Failures Exactly Infrastructure incidents are reproducible because infrastructure is deterministic. AI agent incidents are hard to reproduce because agent behavior depends on model state, context window content, and the sequence of tool call results, none of which are preserved by default after a session ends. Agent SRE's replay engine records every agent session as a replayable artifact: the full trace at each step, every tool call with its inputs and outputs, every policy evaluation with its decision, and every trust score at the time of each inter-agent message. from agent_sre.replay.capture import TraceStore from agent_sre.replay.engine import ReplayEngine, ReplayMode # Traces are captured automatically when SRE tracing is active store = TraceStore( backend="azure_blob", retention_days=30, ) # When an incident occurs, replay the session exactly engine = ReplayEngine(store=store) # Full replay: re-run the session against the same recorded inputs # Uses recorded tool outputs -- no live tool calls -- so replay is deterministic result = await engine.replay( trace_id="trace_2026_05_a7f3b2", mode=ReplayMode.FULL, ) for step in result.steps: print(f"Step {step.index}: {step.action} -> {step.decision}") # Divergence analysis: replay with a policy change applied # Shows exactly which actions would have been blocked under the new policy diff_result = await engine.diff( trace_id="trace_2026_05_a7f3b2", policy_override="policies/stricter-v2.yaml", ) for diff in diff_result.diffs: if diff.description: print(f"Step {diff.span_name}: was {diff.original}, " f"would be {diff.replayed} under new policy") The divergence analysis is the feature teams use most. When a policy change is proposed, you replay recent production traces against the new policy to see how many actions would have been blocked, which sessions would have failed, and what the error budget impact would have been. Policy changes stop being guesswork. Progressive Delivery: Safely Rolling Out New Agent Capabilities When you ship a new service version, you do not send it to all traffic at once. You use canary deployments, feature flags, or traffic splitting. You watch the SLOs. If they degrade, you roll back. Agent SRE brings the same discipline to agent capability rollout. When you expand an agent's authorized scope, giving it write access it did not have, connecting it to a new tool, or raising its trust floor, you do not expand to the full fleet immediately. You expand progressively, with automated SLO gates controlling each stage. from agent_sre.delivery.rollout import ( AnalysisCriterion, CanaryRollout, RollbackCondition, RolloutStep, ) rollout = CanaryRollout( name="database-write-capability", steps=[ RolloutStep( name="canary", weight=0.05, # 5% of agents get the new capability duration_seconds=86400, # 24 hours analysis=[ AnalysisCriterion(metric="safety_sli", threshold=0.995), AnalysisCriterion(metric="performance_sli", threshold=0.90), AnalysisCriterion( metric="error_budget_consumed", threshold=0.10, comparator="lte", # canary can burn at most 10% ), ], ), RolloutStep( name="early-adopters", weight=0.25, # 25% traffic duration_seconds=172800, # 48 hours analysis=[ AnalysisCriterion(metric="safety_sli", threshold=0.990), AnalysisCriterion(metric="performance_sli", threshold=0.88), ], ), RolloutStep( name="general-availability", weight=1.0, # 100% traffic duration_seconds=604800, # 1 week of full observation analysis=[ AnalysisCriterion(metric="safety_sli", threshold=0.990), AnalysisCriterion(metric="performance_sli", threshold=0.85), ], ), ], rollback_conditions=[ RollbackCondition(metric="safety_sli", threshold=0.95, comparator="lte"), ], ) # Start the rollout -- SLO gates evaluate at each step rollout.start() # Advance to next step when analysis criteria pass if rollout.advance(): print(f"Advanced to step: {rollout.current_step.name}") print(f"Progress: {rollout.progress_percent:.0f}%") The SLO gate at each step is the same mechanism as a CI/CD quality gate, but measured on live production behavior rather than test results. An agent capability that degrades the safety SLI during canary does not promote to the next step. If a RollbackCondition fires, the rollout rolls back automatically. This is the mechanism that makes it operationally safe to expand agent autonomy: every expansion is measurable, every measurement gates the next expansion, and rollback is automatic. Health Checks and Backpressure Traditional health checks answer: is the service alive? For agents, alive is not enough. A healthy agent is one that is alive, operating within policy, consuming resources within budget, and maintaining a trust score above the Ring threshold it was assigned. # Agent health check covering multiple dimensions health = await agent_health_check( agent_id="analyst-agent-001", dimensions=[ "liveness", # Is the agent process running? "policy_compliance", # Is safety SLI above threshold? "trust_score", # Is trust score above Ring floor? "resource_budget", # Is token/API spend within limits? "tool_availability", # Are the tools the agent needs reachable? ], ) # health.status: "healthy" | "degraded" | "unhealthy" # health.dimensions: per-dimension pass/fail with values # health.recommended_action: "none" | "restrict" | "suspend" | "terminate" When health checks report degradation, backpressure controls engage before the circuit breaker opens. Backpressure is the earlier, softer response: accept fewer concurrent tasks, reject low-priority work, drain in-flight tasks gracefully before the situation escalates. # Backpressure configuration backpressure_config = { "backpressure_threshold": 0.80, # Engage when resource utilization > 80% "max_concurrent": 5, # Hard cap on simultaneous agent tasks "priority_shedding": True, # Drop low-priority tasks first "drain_timeout_seconds": 30, # Allow in-flight tasks to complete } The ordering matters: backpressure first, then circuit breaker, then suspension. Each stage is recoverable. Each stage preserves more agent state than the next. The SRE principle of graduated response applies to agents exactly as it applies to services. Observability: Governance Metrics Flow Into Your Existing Stack Agent SRE does not ask you to adopt a new observability platform. Governance metrics are exported through the same adapters your infrastructure monitoring already uses, including OpenTelemetry, Prometheus, Datadog, and others. from agent_sre.tracing.exporters import configure_exporters configure_exporters( backends=[ {"type": "prometheus", "endpoint": "http://prometheus:9090"}, {"type": "opentelemetry", "endpoint": "http://otel-collector:4317"}, ], include_metrics=[ "slo.safety_sli", # Per-agent safety compliance rate "slo.error_budget_remaining", # Error budget in percentage "slo.burn_rate", # Current burn rate vs sustainable "circuit_breaker.state", # CLOSED / OPEN / HALF_OPEN "circuit_breaker.failure_count", "trust_score.current", # Agent trust score (0-1000) "trust_score.ring", # Current execution ring "chaos.experiments_run", # Chaos experiment telemetry "health.status", # Aggregate health status "backpressure.load", # Current load vs threshold ], ) Key governance metrics available in your existing dashboards: Metric What It Tells You Alert Condition slo.safety_sli Fraction of agent actions within policy < 0.99 slo.burn_rate Rate at which error budget is consumed > 2.0 (warn), > 5.0 (page) slo.error_budget_remaining Budget left for the SLO window < 20% circuit_breaker.state Current breaker state per agent OPEN or HALF_OPEN trust_score.ring Execution ring (privilege level) Ring 3 (untrusted) health.status Aggregate health across all dimensions degraded or unhealthy If you are already running Grafana dashboards for your services, a governance dashboard for your agent fleet is a new data source and a new set of panels, not a new monitoring stack. The SRE Mental Model for Agents: Four New Concepts Everything in Agent SRE is built on the SRE mental model you already have, extended with four concepts that adapt traditional reliability thinking for autonomous systems: Traditional SRE Agent SRE Equivalent What Changes Latency SLI Safety SLI Correctness of *action*, not speed of *response* Error budget Autonomy budget Burns on policy violations, not just errors Circuit breaker Behavioral circuit breaker Opens on wrong *behavior*, not just failure codes Canary deployment Capability rollout Rolls out *scope*, not just code The governance insight is that error budgets work in both directions for agents. A service's error budget only decreases. An agent's autonomy is also a budget: it grows when the safety SLI is strong and shrinks when it degrades. The error budget mechanism becomes the operational mechanism for expanding and contracting agent autonomy in response to evidence, which is exactly what regulated industries and risk-averse enterprise teams need before they will trust an autonomous agent with consequential actions. Getting Started with Agent SRE pip install agent-sre A minimal Agent SRE integration requires three things: a safety SLO definition, a circuit breaker, and a health check. The progressive delivery and chaos engineering features layer on top when you are ready for them. from agent_sre import SLO, ErrorBudget from agent_sre.slo.indicators import TaskSuccessRate from agent_sre.cascade.circuit_breaker import CircuitBreakerConfig, CircuitBreaker # Step 1: Define your safety SLO slo = SLO( name="production-safety", indicators=[TaskSuccessRate(target=0.99, window="24h")], error_budget=ErrorBudget(total=0.01, burn_rate_alert=2.0, burn_rate_critical=5.0), ) # Step 2: Configure a circuit breaker breaker_config = CircuitBreakerConfig( failure_threshold=5, recovery_timeout_seconds=60, half_open_max_calls=3, ) breaker = CircuitBreaker(agent_id="my-agent", config=breaker_config) # Step 3: Wire into your existing agent loop async def governed_agent_loop(agent, task): # Check health first if not await agent_is_healthy(agent.id): return {"error": "agent suspended", "reason": "health check failed"} # Run within circuit breaker protection async with breaker: result = await agent.run(task) slo.record_event(good=result.policy_compliant) return result The quickstart in the repository walks through a complete setup with safety SLOs, circuit breakers, and a Prometheus dashboard export in under 50 lines. Why This Matters Most AI observability tools today focus on what you might call model quality: hallucination rate, latency, token cost, task completion. These are useful metrics. They are not SRE metrics. They do not answer whether the agent acted within its authorized scope, whether its behavioral error budget is burning at a dangerous rate, or whether it would survive the LLM provider going down. Agent SRE answers those questions using the operational vocabulary that SRE teams already understand: SLOs, error budgets, circuit breakers, chaos experiments, and health checks. The goal is not to replace your observability stack. It is to make agent governance visible inside it. The reliability of an autonomous agent is not a property of the model. It is a property of the governance infrastructure around it. Agent SRE is that infrastructure. Resources GitHub: github.com/microsoft/agent-governance-toolkit Install: pip install agent-sre Tutorials: 40+ tutorials including dedicated Agent SRE walkthroughs for SLO setup, chaos experiments, and progressive delivery Architecture reference: ARCHITECTURE.md OWASP compliance mapping: OWASP-COMPLIANCE.md -- Agent SRE addresses ASI-08 (Cascading Failures) directly through circuit breakers and SLO-based fault detection Part 1 -- Runtime governance: Policy engines, trust, and SRE overview Part 2 -- Shift-left governance: Catching violations before production Part 3 -- Post-hoc accountability: After the agent acts The Agent Governance Toolkit is an open-source project released under the MIT License. All features described in this post are available in the public repository. The `agent-sre` package is currently in public preview; APIs may change before general availability. Questions about Agent SRE in your environment? Open an issue at aka.ms/agent-governance-toolkit or start a discussion in the comments below.891Views1like1CommentBuilding Production-Ready AI Agents in Microsoft Foundry: 10 Lessons Learned
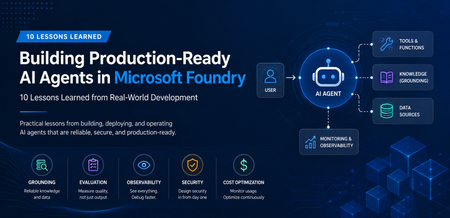
A Real-World Scenario Imagine a customer support agent that answers invoice questions. During testing, everything works perfectly. But in production: The Finance API occasionally times out. The knowledge base contains outdated information. Tool calls fail during peak traffic. Token consumption rises unexpectedly. The result isn't a broken AI model. It's an unreliable system. This is where Microsoft Foundry becomes critical. Building production-ready agents requires grounding, observability, resiliency, governance, and continuous monitoring. New challenges appear: Challenge Impact Hallucinated responses Reduced trust Missing citations Verification issues Tool failures Broken workflows High token consumption Increased cost Latency spikes Poor user experience Limited monitoring difficult troubleshooting Security concerns Compliance risks The lesson was clear: Production readiness is not about making the agent smarter. It is about making the agent reliable. My Observation While experimenting with AI agents in Microsoft Foundry, I found that model selection was rarely the primary challenge. Most production issues stemmed from grounding quality, tool reliability, observability, and security controls. Addressing these operational concerns often had a greater impact on user trust than changing the underlying model. Production AI Agent Reference Architecture A production-ready AI agent typically includes several components beyond the language model itself. Layer Technology User Interface Web App, Teams, Copilot Agent Runtime Microsoft Foundry Agent Service Knowledge Layer Azure AI Search Foundation Model GPT-4o Tool Integration APIs and Functions Monitoring Azure Monitor Security Managed Identity and Key Vault Request Flow Lesson 1: Start with the Use Case, Not the Model One of the most common mistakes is beginning with model selection. Many teams ask: Which model should I use? Should I choose GPT-4o? Should I use a larger context window? A more important question is: What business problem are we solving? Before evaluating models, define: Users Business goals Success metrics Compliance requirements Operational constraints An enterprise support agent and a financial compliance agent may use the same model but require completely different architectures. Key Takeaway Successful AI projects start with business outcomes, not model benchmarks. Lesson 2: Grounding Matters More Than Prompting Prompt engineering helps. Grounding drives trust. Without access to reliable enterprise data, even advanced models can generate confident but incorrect responses. Grounding Sources Azure AI Search SharePoint documents Internal knowledge bases Structured enterprise data Approved policy repositories Example from azure.ai.projects import AIProjectClient # Configure grounding with Azure AI Search agent = client.agents.create_agent( model="gpt-4o", name="support-agent", tools=[ { "type": "azure_ai_search", "azure_ai_search": { "index_name": "support-kb", "endpoint": "https://your-search.search.windows.net" } } ] ) In production environments, grounding through Azure AI Search helps agents retrieve trusted enterprise information rather than relying solely on model knowledge. This significantly improves response accuracy and trustworthiness. Try it yourself: Configure Azure AI Search as a knowledge source in Microsoft Foundry and compare grounded versus non-grounded responses. Key Takeaway Reliable retrieval is usually more valuable than sophisticated prompting. Lesson 3: Design Tool Usage Carefully AI agents become powerful when they can interact with external tools. Examples include: CRM systems Databases APIs Ticketing systems Business applications However, every tool increase complexity. Ask yourself: When should the agent call the tool? What happens if the tool is unavailable? How should failures be handled? Example Failure Scenario +-----------------------------+ | User asks for invoice status | +-------------+---------------+ | v +-----------------------------+ | Agent calls Finance API | +-------------+---------------+ | v +-----------------------------+ | API timeout detected | +-------------+---------------+ | v +-----------------------------+ | Fallback response returned | +-----------------------------+ Example Failure Scenario: A production-ready agent should gracefully handle external service failures and return a fallback response instead of failing completely. Key Takeaway Design for failure before designing for capability. Lesson 4: Evaluate Before Deployment Many teams test only for response quality. Production agents require broader evaluation. Evaluation Area Why It Matters Accuracy Correct answers Grounding Quality Faithful responses Latency User experience Safety Risk reduction Cost Sustainability Tool Success Rate Reliability Evaluation should become part of every deployment pipeline. Key Takeaway You cannot improve what you do not measure. Lesson 5: Make Observability a First-Class Feature Observability is often neglected until something breaks. Unfortunately, production systems always encounter unexpected behavior. Track metrics such as: Metric Purpose Request Volume Demand tracking Average Latency Performance Token Usage Cost visibility Grounding Success Rate Quality Tool Failure Rate Reliability User Satisfaction Business value Setting Up Tracing in Foundry from azure.ai.projects import AIProjectClient from azure.monitor.opentelemetry import configure_azure_monitor # Configure Azure Monitor for tracing configure_azure_monitor( connection_string="InstrumentationKey=xxx" ) # Run the agent response = agent.run( thread_id=thread.id, instructions="..." ) Tracing provides visibility into how an AI agent processes requests, invokes tools, and generates responses. By integrating Azure Monitor, teams can track latency, identify failed tool calls, analyze token usage, and troubleshoot unexpected agent behavior. This observability is essential for operating AI agents reliably in production environments. Try it yourself: Enabling tracing and monitoring for a Microsoft Foundry agent using Azure Monitor. Example Dashboard +-----------------------------+ | Production Monitoring Dashboard | +-----------------------------+ | Requests Today | 5,120 | | Average Latency | 3.2s | | Grounding Success | 97% | | Tool Failure Rate | 1% | | Average Tokens | 2,800 | +-----------------------------+ Monitoring production metrics helps teams understand agent performance, reliability, and cost efficiency. Key indicators such as latency, grounding success rate, tool failure rate, and token consumption provide valuable insights into the operational health of an AI agent and enable proactive troubleshooting before users are impacted. Key Takeaway What you can't observe, you can't effectively operate or improve. Tracing is a critical capability for maintaining production-ready AI agents. Lesson 6: Monitor Token Consumption Token usage directly impacts cost. A highly successful agent can quickly become expensive if token growth is unmanaged. Common optimization techniques: Optimization Benefit Prompt Compression Lower token usage Response Caching Reduced model calls RAG Filtering Focused context Context Trimming Smaller requests Model Selection Cost control Key Takeaway Cost optimization should be planned from day one. Lesson 7: Build Security into the Design Security should never be an afterthought. Enterprise AI systems must enforce the same security boundaries as traditional applications. Recommended Controls Control Purpose Managed Identity Secure authentication Azure Key Vault Secret management RBAC Authorization Audit Logs Compliance Content Filtering Safety Private Endpoints Network Security Guiding Principle An AI agent should never access data beyond a user's permissions. Key Takeaway Security is a design requirement, not a deployment task. Lesson 8: Expect Tool Failures External dependencies inevitably fail. Production-ready agents should anticipate: API downtime Authentication failures Network interruptions Rate limiting Unexpected responses Recommended Strategy Key Takeaway async def call_tool_with_resilience(tool_name, params): try: result = await tool_client.execute( tool_name, params, timeout=5.0 ) return result except TimeoutError: return await cache.get_fallback( tool_name, params ) Example Outcome: Introducing retry and fallback logic can significantly improve reliability. By handling temporary API failures gracefully and returning cached responses, when necessary, agents can reduce user-facing errors and provide a more consistent experience. Lesson 9: Evaluate the Process, Not Just the Output A correct answer does not always mean the process was correct. In production environments, teams should evaluate not only the final response but also the steps the agent took to generate that response. An answer may appear accurate even when it was based on incorrect retrieval results, unnecessary tool calls, or incomplete citations. Review: Retrieval quality Tool execution Citation accuracy Security compliance Reasoning path User Query | v Retrieval | v Tool Execution | v Reasoning | v Response For example, an agent might generate the correct answer by chance, even though it retrieved irrelevant documents or used an inefficient workflow. Without evaluating the process, these hidden issues may go unnoticed until they affect reliability, compliance, or user trust. Key Takeaway Inspect the entire workflow, not just the final answer. Lesson 10: Think Like a Production Engineer As adoption grows, operational excellence becomes the differentiator. Ask questions such as: Can we troubleshoot failures? Can we measure business impact? Can we control costs? Can we scale safely? Can we govern usage? These questions become more important than model selection over time. Key Takeaway Production success comes from engineering discipline, not model size. Microsoft Foundry Features That Helped Improve Reliability Foundry Capability Production Benefit Agent Service Agent orchestration Knowledge Sources Grounded responses Evaluations Quality measurement Tracing Workflow visibility Model Catalog Model flexibility Safety Systems Risk mitigation These capabilities help teams move beyond proofs of concept and build solutions that are ready for real-world adoption. Production Readiness Checklist Before releasing an AI agent, verify: ✅ Business goals defined ✅ Grounding strategy implemented ✅ Security controls enabled ✅ Evaluation pipeline established ✅ Monitoring configured ✅ Failure handling tested ✅ Cost optimization reviewed ✅ Governance process defined ✅ User feedback loop available ✅ Deployment rollback strategy prepared Get Started with Production-Ready Agents If you're building AI agents using Microsoft Foundry, start by focusing on grounding, observability, security, and evaluation from day one. Suggested next steps: Build your first agent in Microsoft Foundry Configure Azure AI Search grounding Enable tracing and monitoring Evaluate agent quality before deployment Add resilience and fallback strategies Which of these 10 lessons has been most valuable in your own AI agent journey? Share your experiences and insights in the comments.913Views5likes1CommentModel router updates: new regions, a refreshed model pool, and understanding the hill climb
Across Microsoft, "hill climbing" has become shorthand for how real AI progress happens: not in one dramatic leap, but through a disciplined loop. Microsoft AI defines the hill climb as an organization that continuously improves, cycle after cycle, through more compute, better data, and sharper evaluation. Reinforcement fine-tuning in Foundry defines it as improving the deployable model package one measured step at a time across quality, latency, and cost. Different altitudes, same premise: progress is not a one-shot decision. It's a loop. For most teams, the decision of what model to use when is made manually or with custom routing tools. A developer picks a model based on benchmarks, familiarity, or the last launch that made headlines, ships it, and revisits the choice only when something breaks. In an ecosystem where the frontier moves monthly, that decision goes stale fast. Model router in Foundry Models brings the hill climb to the selection layer. What's new: a bigger pool, in more places This release expands where teams can deploy model router, broaden the supported model pool, and delivers updates through a stable endpoint. Together, these changes help teams run production workloads in more locations, match a wider range of tasks to suitable models, and adopt supported updates without changing the application integration. A refreshed model pool. The supported model list now includes Anthropic Claude Opus 4.8 — a high-capability model built for complex reasoning and long-form generation, for scenarios that demand depth, structure, and quality — and the GPT-5.6 family. Just as importantly, the pool is pruned: gpt-5-chat, gpt-5.2-chat, gpt-5.3-chat, Deepseek-V3.1 have been removed from the model router as models reach the end of their lifecycle and are deprecated in Foundry. New region availability. The model router is now available in 28 regions for global standard and 21 data zone regions. For many organizations, inference requests must stay within specific geographic boundaries for regulatory, governance, or customer-trust reasons — and intelligent routing shouldn't force a compromise on that. Find the full list of regions here. The most important detail is what you don't have to do: these updates occur automatically*. The endpoint remains stable as the supported model pool is refreshed, so teams do not need to redeploy the model router to receive the update. Applications can continue using the same integration while the model router evaluates requests against the current supported pool. Teams should continue monitoring routing traces and application outcomes to confirm that quality, cost, latency, and governance requirements are met. *Models from Anthropic still need to be deployed separately before they can be routed to through the model router. Interested in hearing more about what's new to the model router? Tune in for the next episode of Model Mondays with Sanjeev Jagtap and Lee Stott, where they talk all things model router from evaluations to hill climbing. Sign up here to watch live or view the replay: Model Mondays - Spotlight On Model router in Microsoft Foundry | Microsoft Reactor The selection-layer hill climb At the selection layer, a step is a routing decision. Each one is a micro-optimization against your objective, and each one is instrumented: every response from the model router includes a model field showing which underlying model was selected, so the climb leaves a complete, auditable trail. Model router supports three parts of the optimization loop: A/B testing to compare two router configurations to understand quality, cost, and latency tradeoffs; model decomposition to use routing results to decompose a single-model application into a multi-model or multi-agent design, and continuous routing to keep the router in production for continuous per-request selection. Each pattern turns model choice into a measured, repeatable process rather than a fixed decision. 1. A/B Testing Question: Which model or routing strategy should I use in production? A/B testing helps teams compare candidate models, model families, or router configurations against the same workload. Representative traffic is sent to competing deployments, and teams compare quality, cost, latency, and governance outcomes. The goal is to understand tradeoffs and identify the model or routing strategy that best meets workload requirements before promoting it to production. 2. Model Decomposition Question: What work is my application actually doing? Model decomposition uses model router as a diagnostic tool. By deploying the model router against a representative workload and examining routing telemetry, teams can see how requests naturally separate into different task classes. Simple retrieval, classification, and summarization requests may route to smaller models, while reasoning, planning, and agentic workflows may require more capable models. The goal is not to choose a winner, but to understand the structure of the workload and uncover opportunities for optimization, specialization, or architectural improvements. 3. Route continuously Question: Why choose a single model at all? Route continuously is the pattern model router was designed for but is not limited to. Rather than treating model selection as a one-time decision, teams leave the model router in production and allow the best-fit model to be selected for each request. As the supported model pool, regional availability, and platform capabilities evolve, teams can continue using the same endpoint while evaluating whether updates improve workload outcomes. Model selection becomes an ongoing optimization process rather than a project that must be repeated every time the model landscape changes. Together, these patterns illustrate a broader shift: the model router is more than a model. It is a tool for the optimization loop itself, helping teams evaluate tradeoffs, understand workload behavior, test hypotheses, and continuously refine model selection as requirements evolve. Whether used to compare candidate models, decompose applications into specialized tasks, or automate per-request routing in production, model router turns model selection into an observable, measurable, and repeatable process. As the model landscape continues to change, that optimization loop becomes a durable advantage. Getting Started Ready to start your own hill climb? Whether you're exploring the model router for the first time, evaluating routing strategies against your workload, or building a long-term optimization practice, these resources can help you move from experimentation to production with Microsoft Foundry. What's new in model router? Sign up for the next Model Mondays episode for a deep dive into new features, optimization patterns, and the latest model router updates. How do I build agents with model router? Check out the Model Router Agents Lab and build agent experiences with routing, retrieval, web search, tool calling, and multi-agent patterns. How do I evaluate model router? Compare model router against baseline models using your own prompts, then review quality, cost, latency, and routing decisions with the Auto Evaluation Toolkit. How do I optimize model router for my workload? Start your hill-climbing journey with the Model Mastery workshop, where you'll test one optimization lever at a time and measure how each change impacts workload outcomes. How do I build a model router optimization playbook? Explore the Model Releases repository to track new capabilities, understand the optimization question behind each release, and try focused notebooks that demonstrate one optimization lever at a time.2.5KViews2likes0CommentsLog Insights in Minutes: A Simpler pgBadger Workflow
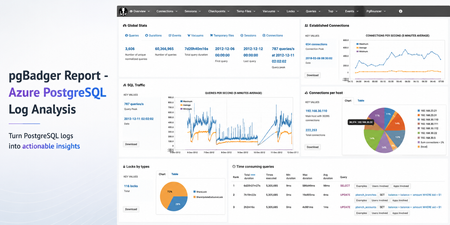
Sometimes the fastest way to understand a PostgreSQL workload is not another dashboard. It is a good log report. pgBadger is a PostgreSQL log analysis tool that turns raw PostgreSQL logs into an interactive HTML report. It helps summarize query activity, connection patterns, errors, temporary files, lock waits, autovacuum activity, and more. Earlier guidance for generating pgBadger reports from Azure Database for PostgreSQL Flexible Server focused on exporting logs through Diagnostic Settings, storing them in a storage account, and then using tools such as BlobFuse and jq to extract PostgreSQL log lines from JSON files. That workflow is still useful when customers centralize logs across multiple servers. However, if you are already using the Server logs feature in Azure Database for PostgreSQL Flexible Server, there is a much simpler path. In this post: You’ll learn how to generate a pgBadger HTML report from Azure Database for PostgreSQL Flexible Server by downloading native PostgreSQL .log files directly from the Azure portal. No storage account, BlobFuse mount, or JSON extraction required. Fast path Configure log_line_prefix . Enable Server logs for download. Download the PostgreSQL .log files. Run pgBadger with the matching prefix. Open pgbadger-report.html . Why use this workflow? With Server logs, you can download native PostgreSQL .log files directly from the Azure portal and run pgBadger locally. Older path Simpler path in this blog Diagnostic Settings → Storage account → BlobFuse → JSON extraction → pgBadger Server logs → Download .log files → pgBadger Area Older Diagnostic Settings workflow Server logs workflow Export path Diagnostic Settings to storage account Download .log files directly from the portal Format JSON payloads need extraction Native PostgreSQL .log files Extra tooling BlobFuse and jq JSON parsing None Best suited for Centralized or multi-server logging Quick per-server analysis Outcome Flexible, but more setup Faster path to pgBadger Recommended: Use the Server logs workflow when you want a fast, low-friction way to generate a pgBadger report from one Azure Database for PostgreSQL Flexible Server. When should you use this workflow? Use this workflow when... Use Diagnostic Settings when... You need a quick report for one Flexible Server. You centralize logs from many servers. You want to run pgBadger locally. You need long-term retention or workspace-level querying. You want to avoid JSON extraction. You already have automated log export pipelines. Before you start A machine where you can install or run pgBadger. A working Perl runtime. Git Bash on Windows, so the multi-line shell commands work as shown. Portal access to your Azure Database for PostgreSQL Flexible Server. Permission to update server parameters and enable Server logs. Important: pgBadger can only analyze what PostgreSQL logs capture. To populate query timing and slow-query sections in the report, enable log_min_duration_statement before collecting logs. Logs collected before that change will not include duration data. Workflow overview Task Type Rough effort Install or prepare pgBadger One-time setup per analysis machine 5–10 minutes Configure log_line_prefix One-time setup per server 2–3 minutes Enable Server logs One-time setup per server 2–3 minutes Download logs and run pgBadger Repeatable 2–5 minutes Install or prepare pgBadger on the machine where you will analyze logs. Configure log_line_prefix so pgBadger can parse each log line. Enable Server logs, so PostgreSQL logs are available for download. Download the logs and run pgBadger locally. 💡Pro tip: Start with a narrow log window first. Use one or two hourly log files, confirm the report looks right, and then expand the analysis window if needed. Step 1: Install pgBadger Before generating a report, you need pgBadger available on the machine where you plan to analyze the downloaded PostgreSQL log files. Run this on a Linux VM, WSL, or another Linux-based environment where you can install packages. Note: Azure Cloud Shell may work for quick testing, but package installation and build-tool availability can vary by session. For repeatable analysis, use a Linux VM, WSL, or another environment you control. Copy and run sudo apt-get update && sudo apt-get install -y git perl make gcc && \ git clone https://github.com/darold/pgbadger.git && \ cd pgbadger && \ perl Makefile.PL && \ make && \ sudo make install && \ pgbadger -V What good looks like: The install command completes successfully and pgbadger -V returns the installed pgBadger version. Step 2: Configure log_line_prefix This is a one-time server configuration step. The log_line_prefix parameter controls the beginning of each PostgreSQL log line. pgBadger uses this prefix to extract useful fields such as timestamp, user, database, and process ID. In the Azure portal, open your Flexible Server and go to Server parameters. Search for: Parameter log_line_prefix Set this value %m user=%u db=%d pid=%p: Then select Save. In Server parameters, confirm that the custom value is saved for log_line_prefix . Figure 1: Set log_line_prefix so pgBadger can correctly parse timestamp, user, database, and process ID from each log line. Prefix tokens Token Meaning %m Timestamp with milliseconds %u Username %d Database name %p Process ID After this change, log lines should look like this: Example log line 2026-06-22 19:00:00.070 UTC user=pgadmin db=highcpu pid=3805603: LOG: statement: SELECT 1 FROM pg_extension WHERE extname='pg_stat_statements' The matching pgBadger prefix for this log format is: Matching pgBadger prefix %m user=%u db=%d pid=%p: You will use this same value later in the pgBadger command. What good looks like: The server parameter is saved, and new PostgreSQL log lines begin with timestamp, user, database, and process ID fields that match the pgBadger prefix. Step 3: Enable Server logs for download This is also a one-time setup step. In the Azure portal, open your Flexible Server and go to Server logs. Enable: Portal setting Capture logs for download Set the retention period based on how long you want logs to remain available for download. For example, a 7-day retention period keeps logs available for download for 7 days. In Server logs, enable Capture logs for download and choose the retention window. Figure 2: Enable Capture logs for download and set a retention period long enough to cover the analysis window you want to inspect. What good looks like: After Server logs are enabled, hourly PostgreSQL log files appear in the Server logs blade and can be downloaded from the Azure portal. Once enabled, hourly log files appear in the Server logs blade. The files are named by date and hour, for example: Example log files postgresql_2026_06_22_19_00_00.log postgresql_2026_06_22_20_00_00.log Step 4: Download and organize the logs locally From the Server logs page, select the .log files for the time window you want to analyze and download them. For example, to analyze activity between 19:00 and 21:00 UTC, download: Example files to download postgresql_2026_06_22_19_00_00.log postgresql_2026_06_22_20_00_00.log On your local machine, create a folder for that analysis window. A simple convention is to use the Mon-DD format. Folder name Jun-22 Place the downloaded .log files inside that folder. Your local folder structure should look like this: Folder structure pgbadger-13.1/ pgbadger Jun-22/ postgresql_2026_06_22_19_00_00.log postgresql_2026_06_22_20_00_00.log Step 5: Generate the pgBadger report Open Git Bash from the folder where pgBadger is located. For example, if pgBadger is inside the pgbadger-13.1 folder, open Git Bash from that folder. # Action Command 1 Set the folder FOLDER=Jun-22 2 Confirm files ls -lh ./$FOLDER 3 Run pgBadger Use the full command below. Copy and run FOLDER=Jun-22 ls -lh ./$FOLDER perl -X ./pgbadger -f stderr \ --prefix '%m user=%u db=%d pid=%p:' \ ./$FOLDER/*.log \ -o ./$FOLDER/pgbadger-report.html Command breakdown Part of command Purpose perl -X ./pgbadger Runs pgBadger and suppresses non-critical Perl warnings. -f stderr Parses PostgreSQL stderr log files. --prefix '%m user=%u db=%d pid=%p:' Matches the log_line_prefix set on the server. ./$FOLDER/*.log Analyzes every .log file in the selected folder. -o ./$FOLDER/pgbadger-report.html Writes the HTML report into the same folder. When the command completes successfully, you should see output like this: Expected output Parsed 12134249 bytes of 12134249 (100.00%), queries: 26684, events: 83 LOG: Ok, generating html report... What good looks like: pgBadger finishes parsing the logs and creates pgbadger-report.html in the selected folder. Step 6: Open the report Open the generated report: Copy and run start ./$FOLDER/pgbadger-report.html The report opens in your default browser. The final report is created here: Generated report path Jun-22/pgbadger-report.html What the report can show The pgBadger report gives you a quick view into the workload shape for the selected log window. For example, in a sample run across two hourly log files, pgBadger summarized: Total number of queries. Number of unique normalized queries. Query traffic over time. Events such as errors and fatal messages. Session and connection patterns. Once the report opens, start with Global Stats to confirm the time range, total queries, normalized queries, and query peak. Figure 3: Start with Global Stats to validate the selected time range, total query count, normalized query count, and query peak. Query volume and normalized queries Many raw queries can often reduce to a smaller number of normalized query patterns. This helps identify whether the workload is spread across many different query shapes or dominated by a smaller set of repeated statements. Example: In this sample run, 26,684 queries reduced to 59 normalized query shapes. That suggests the workload is mostly a small set of repeated statements, which can help focus tuning effort. Traffic patterns The SQL Traffic section helps identify spikes, quiet periods, and workload changes over time. Figure 4: Use SQL Traffic to identify query spikes, quiet periods, and workload changes during the selected log window. Figure 5: Review the query breakdown to compare read vs. write volume and query-type distribution for the selected Server logs window. For example, if the report shows a steady baseline followed by a sharp spike, that spike can be correlated with application activity, batch jobs, synthetic tests, or operational events during the same time window. Query duration If query duration shows 0 ms or the slow query sections are empty, it usually means duration logging was not enabled when the logs were collected. In that case, pgBadger can still show query counts and events, but it cannot calculate the slowest queries, total execution time, average duration, or maximum duration. To unlock those timing sections, enable log_min_duration_statement , collect fresh logs, and rerun pgBadger. What pgBadger cannot infer from missing logs pgBadger reports are only as complete as the log data you provide. If PostgreSQL did not log duration, lock waits, temporary files, or autovacuum activity during the selected time window, pgBadger cannot reconstruct those details later. To analyze... Enable before collecting logs Slow queries log_min_duration_statement Lock waits log_lock_waits Temporary files log_temp_files Autovacuum activity log_autovacuum_min_duration Repeatable copy/paste block Reusable command block Change only FOLDER for each new analysis window. Copy and run FOLDER=Jun-22 ls -lh ./$FOLDER perl -X ./pgbadger -f stderr \ --prefix '%m user=%u db=%d pid=%p:' \ ./$FOLDER/*.log \ -o ./$FOLDER/pgbadger-report.html start ./$FOLDER/pgbadger-report.html For another date, change only this line: Update this value FOLDER=Jun-22 Examples: Example folder values FOLDER=Jun-23 FOLDER=Jul-01 FOLDER=Aug-15 Optional: Improve report quality pgBadger can only analyze the information captured in PostgreSQL logs. The default logs may be enough for query frequency, connection activity, and errors. For deeper performance troubleshooting, consider enabling additional logging parameters based on your scenario. Scenario Parameter Suggested value Notes Slow query analysis log_min_duration_statement 1000 Logs statements slower than 1 second. Short controlled test log_min_duration_statement 0 Logs every statement. Use carefully. Lock troubleshooting log_lock_waits on Helps identify lock waits. Temporary file analysis log_temp_files 0 Logs all temporary files. Autovacuum visibility log_autovacuum_min_duration 0 Useful during focused analysis. Useful parameters include: Recommended logging parameters log_lock_waits = on log_temp_files = 0 log_autovacuum_min_duration = 0 To capture query durations, configure: Duration logging log_min_duration_statement = 1000 This logs statements that run longer than 1000 milliseconds. For short test runs, you can temporarily use: Short test run only log_min_duration_statement = 0 Caution: Use log_min_duration_statement = 0 carefully on busy production servers. It logs every statement and can generate a large volume of logs. Duration matters: If duration logging is not enabled, pgBadger can still show query counts and events, but slowest-query, total duration, average duration, and maximum duration sections will be limited or empty. Common mistakes and quick fixes Symptom Likely cause Fix Report is empty Prefix mismatch Match --prefix with log_line_prefix . No duration data Duration logging was not enabled Set log_min_duration_statement before collecting logs. No files visible Server logs disabled or retention expired Enable capture and check retention. pgBadger command fails pgBadger is not in the current folder or path Run pgbadger -V to confirm installation. Common troubleshooting FAQs 1. Report is created but empty This usually means the pgBadger prefix did not match the actual log format. Check the first few lines: Copy and run head -5 ./$FOLDER/*.log Make sure the pgBadger --prefix matches the server’s log_line_prefix . 2. Report shows queries but no duration PostgreSQL logged statements but did not log durations. Enable one of the following, collect fresh logs, and rerun pgBadger: Parameter options log_min_duration_statement = 1000 # or temporarily for testing log_min_duration_statement = 0 3. No .log files are visible Confirm that Server logs are enabled: Portal setting Capture logs for download Also check the retention period. If the retention period has expired, older logs may no longer be available for download. 4. pgBadger command fails Confirm that pgBadger is available in the current folder or installed in your path. Copy and run pgbadger -V If you are running pgBadger from the local folder, use: Copy and run perl -X ./pgbadger Summary For customers already using Azure Database for PostgreSQL Flexible Server logs, the pgBadger workflow is straightforward: Install pgBadger. Configure log_line_prefix . Enable Server logs for download. Download the .log files. Place them in a local date-based folder. Run pgBadger with the matching prefix. Open pgbadger-report.html . Bottom line: Server logs give you the shortest path from Azure Database for PostgreSQL Flexible Server logs to a pgBadger report. Download the native .log files, run pgBadger with the matching prefix, and open the generated HTML report. References pgBadger - source and documentation GitHub pgBadger - project site Azure - Download server logs from the portal Flexible Server Azure - Logging concepts Flexible Server Azure - Configure server parameters via the portal PostgreSQL - log_line_prefix and logging parameters545Views2likes0CommentsFrom Policy to Practice: Built-In CIS Benchmarks on Azure - Flexible, Hybrid-Ready
Security is more important than ever. The industry-standard for secure machine configuration is the Center for Internet Security (CIS) Benchmarks. These benchmarks provide consensus-based prescriptive guidance to help organizations harden diverse systems, reduce risk, and streamline compliance with major regulatory frameworks and industry standards like NIST, HIPAA, and PCI DSS. In our previous post, we outlined our plans to improve the Linux server compliance and hardening experience on Azure and shared a vision for integrating CIS Benchmarks. Today, that vision has turned into reality. We're now announcing the next phase of this work: Center for Internet Security (CIS) Benchmarks are now available on Azure for all Azure endorsed distros, at no additional cost to Azure and Azure Arc customers. With today's announcement, you get access to the CIS Benchmarks on Azure with full parity to what’s published by the Center for Internet Security (CIS). You can adjust parameters or define exceptions, tailoring security to your needs and applying consistent controls across cloud, hybrid, and on-premises environments - without having to implement every control manually. Thanks to this flexible architecture, you can truly manage compliance as code. How we achieve parity To ensure accuracy and trust, we rely on and ingest CIS machine-readable Benchmark content (OVAL/XCCDF files) as the source of truth. This guarantees that the controls and rules you apply in Azure match the official CIS specifications, reducing drift and ensuring compliance confidence. What’s new under the hood At the core of this update is kompli - a lightweight, open-source module developed by the Azure Core Linux team. It evaluates Linux systems directly against industry-standard benchmarks like CIS, supporting both audit and, in the future, auto-remediation. This enables accurate, scalable compliance checks across large Linux fleets. Here you can read more about kompli. Dynamic rule evaluation The new compliance engine supports simple fact-checking operations, evaluation of logic operations on them (e.g., anyOf, allOf) and Lua based scripting, which allows to express complex checks required by the CIS Critical Security Controls - all evaluated natively without external scripts. Scalable architecture for large fleets When the assignment is created, the Azure control plane instructs the machine to pull the latest Policy package via the Machine Configuration agent. kompli is integrated as a light-weight library to the package and called by Machine Configuration agent for evaluation – which happens every 15-30minutes. This ensures near real-time compliance state without overwhelming resources and enables consistent evaluation across thousands of VMs and Azure Arc-enabled servers. Future-ready for remediation and enforcement While the Public Preview starts with audit-only mode, the roadmap includes per-rule remediation and enforcement using technologies like eBPF for kernel-level controls. This will allow proactive prevention of configuration drift and runtime hardening at scale. Please reach out if you interested in auto-remediation or enforcement. Extensibility beyond CIS Benchmarks The architecture was designed to support other security and compliance standards as well and isn’t limited to CIS Benchmarks. The compliance engine is modular, and we plan to extend the platform with STIG and other relevant industry benchmarks. This positions Azure as a platform for a place where you can manage your compliance from a single control-plane without duplicating efforts elsewhere. Collaboration with the CIS This milestone reflects a close collaboration between Microsoft and the CIS to bring industry-standard security guidance into Azure as a built-in capability. Our shared goal is to make cloud-native compliance practical and consistent, while giving customers the flexibility to meet their unique requirements. We are committed to continuously supporting new Benchmark releases, expanding coverage with new distributions and easing adoption through built-in workflows, such as moving from your current Benchmark version to a new version while preserving your custom configurations. Certification and trust We can proudly announce that kompli has met all the requirements and is officially certified by the CIS for Benchmark assessment, so you can trust compliance results as authoritative. Minor benchmark updates will be applied automatically, while major version will be released separately. We will include workflows to help migrate customizations seamlessly across versions. Key Highlights Built-in CIS Benchmarks for Azure Endorsed Linux distributions Full parity with official CIS Benchmarks content and certified by the CIS for Benchmark Assessment Flexible configuration: adjust parameters, define exceptions, tune severity Hybrid support: enforce the same baseline across Azure, on-prem, and multi-cloud with Azure Arc Reporting format in CIS tooling style Supported use cases Certified CIS Benchmarks for all Azure Endorsed Distros - Audit only (L1/L2 server profiles) Hybrid / On-premises and other cloud machines with Azure Arc for the supported distros Compliance as Code (example via Github -> Azure OIDC auth and API integration) Compatible with GuestConfig workbook What’s next? Our next mission is to bring the previously announced auto-remediation capability into this experience, expand the distribution coverage and elevate our workflows even further. We’re focused on empowering you to resolve issues while honoring the unique operational complexity of your environments. Stay tuned! Get Started Documentation link for this capability Enable CIS Benchmarks in Machine Configuration and select the “Official Center for Internet Security (CIS) Benchmarks for Linux Workloads” then select the distributions for your assignment, and customize as needed. In case if you want any additional distribution supported or have any feedback for kompli – please open an Azure support case or a Github issue here Relevant Ignite 2025 session: Hybrid workload compliance from policy to practice on Azure Connect with us at Ignite Meet the Linux team and stop by the Linux on Azure booth to see these innovations in action: Session Type Session Code Session Name Date/Time (PST) Theatre THR 712 Hybrid workload compliance from policy to practice on Azure Tue, Nov 18/ 3:15 PM – 3:45 PM Breakout BRK 143 Optimizing performance, deployments, and security for Linux on Azure Thu, Nov 20/ 1:00 PM – 1:45 PM Breakout BRK 144 Build, modernize, and secure AKS workloads with Azure Linux Wed, Nov 19/ 1:30 PM – 2:15 PM Breakout BRK 104 From VMs and containers to AI apps with Azure Red Hat OpenShift Thu, Nov 20/ 8:30 AM – 9:15 AM Theatre THR 701 From Container to Node: Building Minimal-CVE Solutions with Azure Linux Wed, Nov 19/ 3:30 PM – 4:00 PM Lab Lab 505 Fast track your Linux and PostgreSQL migration with Azure Migrate Tue, Nov 18/ 4:30 PM – 5:45 PM PST Wed, Nov 19/ 3:45 PM – 5:00 PM PST Thu, Nov 20/ 9:00 AM – 10:15 AM PST1.6KViews0likes0CommentsNow Generally Available: Built-in CIS Benchmark Auditing for Linux on Azure
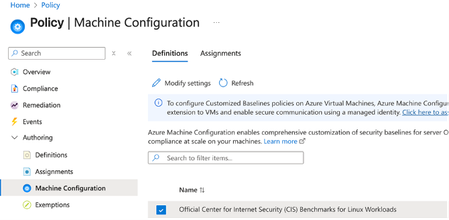
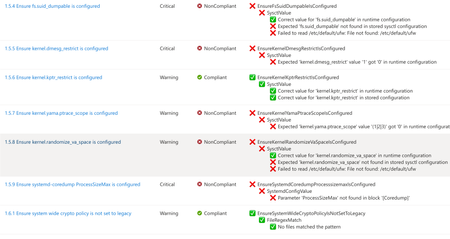
A few months ago, in From Policy to Practice: Built-in CIS Benchmarks on Azure – Flexible, Hybrid-Ready, we introduced a new way to bring Center for Internet Security (CIS) Benchmarks to your Linux estate using Azure Policy with Machine Configuration. It builds on the broader customizable security baseline policies in Machine Configuration capability. Today we're excited to share the next milestone: the audit capability for CIS Benchmarks on Linux is now Generally Available (GA). This release is officially powered by kompli - our native Linux compliance and hardening engine for CIS, STIG, and custom baselines. kompli is the evolution of the engine that drove the preview, now established as the dedicated home for this capability going forward. What "GA" means for you The audit experience is now ready for production use. You can continuously assess your Linux workloads against official, CIS-certified benchmarks - at scale, across Azure and hybrid environments through Azure Arc - and get clear, CIS-style compliance reporting directly in Azure Policy and Azure Resource Graph. If you've read the previous post, the how hasn't changed, so we'll keep this one short: Automated compliance assessment - continuously monitor Linux systems against official CIS benchmarks. Tailored benchmarks - customize evaluations with exceptions and custom parameters, no code changes required. Compliance reporting - detailed, CIS-style reports across your fleet. Hybrid-ready - the same baselines apply to Azure VMs and Arc-enabled servers on-premises or in other clouds. All supported benchmarks are CIS Benchmark Assessment Certified and stay in parity with the content published on the CIS website. Supported distributions and benchmark versions With this release, audit is GA across the following distributions, covering Level 1 + Level 2 Server profiles: Distribution CIS Benchmark Version(s) Profiles Audit Ubuntu 20.04 / 22.04 / 24.04 LTS + Pro v3.0.0 / v2.0.0 + v3.0.0 / v1.0.0 L1 + L2 Server ✓ Red Hat Enterprise Linux 8 / 9 / 10 v3.0.0 + v4.0.0 / v2.0.0 / v1.0.1 L1 + L2 Server ✓ AlmaLinux 8 / 9 v3.0.0 + v4.0.0 / v2.0.0 L1 + L2 Server ✓ Rocky Linux 8 / 9 v2.0.0 + v3.0.0 / v2.0.0 L1 + L2 Server ✓ Oracle Linux 8 / 9 v3.0.0 + v4.0.0 / v2.0.0 L1 + L2 Server ✓ Debian 11 / 12 v2.0.0 / v1.1.0 L1 + L2 Server ✓ SUSE Linux Enterprise 12 / 15 v3.2.1 / v2.0.1 L1 + L2 Server ✓ AKS Optimized Azure Linux 3 v1.0.0 L1 + L2 Server ✓ This GA covers the audit (assessment) capability. Looking ahead, STIG benchmarks are coming next, followed by a granular per-rule auto-remediation capability with dynamic scope assignments. You can run these benchmarks against your own hardened images, against CIS hardened images, and against custom images built on top of vanilla distros — as long as /etc/os-release retains its original content. We're also working with vendors to minimize deviations. Getting started Open Azure Policy in the Azure portal. Under Authoring, select the new Machine Configuration blade. Choose Official Center for Internet Security (CIS) Benchmarks for Linux Workloads, then Modify Settings to pick the distributions you want to assess. Full documentation, including per-distribution rule details, supported parameters, and any known deviations from the official CIS toolset, is available here: Overview: CIS Security Benchmarks for Linux Workloads Per-distribution references: AlmaLinux, Azure Linux, Debian, Oracle Linux, Red Hat Enterprise Linux, Rocky Linux, SUSE Linux Enterprise, and Ubuntu - all linked from the overview page. We're building this with you As part of this GA release, we've also expanded the set of exposed rule parameters compared to the preview - giving you more out-of-the-box customization across rules and distributions. That said, our customer-driven approach still stands: we keep the experience clean by enabling parameters based on real demand, so if there's a rule, benchmark version, or distribution you'd like parameters enabled for - or any feedback on rules, evaluations, or distro coverage - let us know: Open a GitHub issue in the kompli repository Open an Azure support case Try it out, tell us what you think, and help shape what we build next.422Views1like0CommentsAnnouncing the Open-Source Release of ML Video Codec (MLVC)
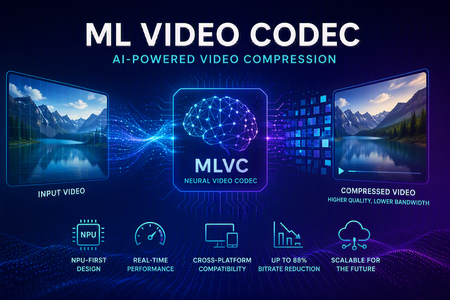
Video codecs compress video for transmission or storage, reducing bandwidth and storage requirements. MLVC is a modern machine-learning-based codec that uses substantially less bandwidth than conventional codecs, improving streaming and video-call quality—especially on constrained or unreliable networks—while lowering delivery and storage costs. MLVC is the product iteration of DCVC (Deep Contextual Video Compression) family of NVC (Neural Video Codec), open sourced by Microsoft Research since 2021, with improved compression efficiency, real-time performance on commodity Neural Processing Units (NPUs), and cross-platform support. We recently published this work in the paper MLVC: Multi-platform Learned Video Codec for Real-World Deployment. We are releasing the source code because we believe the next generation of video coding will be built openly, and we want the broader community — researchers, video codec engineers, platform vendors, product teams, as well as general developer community — to build it with us. Why MLVC Traditional video codecs (e.g., H.264/AVC, H.265/HEVC) have served the industry for a long time, but each generation requires enormous engineering effort for incremental gains and needs dedicated hardware which takes years to become commonly available. MLVC replaces conventional primitives — motion estimation, transforms, entropy modeling — with end-to-end learned neural compression, trained directly against rate-distortion objectives, and run on general-purpose NPU devices. The table below compares MLVC to popular video codecs, showing its lower bitrate and resulting savings in bandwidth and storage. Resolution vs H.264 vs H.265 360p 87.8% 75.5% 540p 82.7% 65.4% For example, for 360p video at 30 fps, where H.264 requires 1 Mbps, MLVC requires roughly 122 kbps for equivalent quality — about one-eight the bitrate under real-time conditions. The inference compute was kept approximately equal for the 360p and 540p resolutions. These results are based on a P.910 subjective test and are based on the Video Conferencing Dataset (VCD) dataset that we developed and also recently released as an open-source project. The following video demo illustrates the extent of quality enhancement achieved by MLVC relative to H.265/HEVC at the same bitrate of 200kbps (please watch by opening in a new window for better demonstration) \ Beyond video compression efficiency, MLVC also offers: NPU-first design. MLVC is built to run almost entirely on the AI accelerators already shipping in modern devices — Apple Neural Engine, Qualcomm and Intel NPUs — at no more than 50% NPU utilization, leaving NPU headroom for the rest of the system. Real-time execution at the targeted operating points. Demonstrated 540p at 30 fps on Apple, Intel, and Qualcomm hardware. A scaling-law trajectory. Empirically, MLVC's coding efficiency improves with increased model capacity and additional training compute. Content-adaptive behavior out of the box, without hand-tuned Rate Distortion Optimization heuristics. Already running in Microsoft Teams MLVC is more than just a research concept for Microsoft. We are currently rolling it out in Microsoft Teams, where it is being validated on real peer-to-peer video calls with active telemetry and A/B testing. The integration runs alongside fallback to conventional video codecs for hardware or reliability constraints — the kind of mixed-environment deployment that real products need. The scaling and reliability insights from this rollout are shaping the codec and its roadmap. We welcome your contributions We can not cover every use case, every device class, or every content domain by ourselves. That is why we are open sourcing MLVC. If you work on: Streaming, Video On Demand (VOD), or live broadcast Real-time communication and conferencing Cloud gaming or remote rendering Surveillance, drones, or robotics Mobile capture, Augmented Reality (AR) / Virtual Reality (VR), or volumetric video Codec hardware, NPUs, or inference runtimes We would love your help. Contributions of all kinds are welcome, including model improvements, training recipes, new platform ports and conversion targets, runtime backends, domain-specific fine-tunes, evaluation tooling, bug reports, and feedback on what is missing for your scenario. We particularly welcome platform ports that expand NPU coverage and efficiency improvements that push the rate-distortion frontier. What's in the release The MLVC repository is available at https://github.com/microsoft/mlvc and shared under the MIT License. It includes: MLVC model source code of the full network architecture. Trained model weights ready to run. Training scripts used to produce shipping models. Training data collection documentation to help reproduce and improve MLVC. Platform conversion scripts to target different NPUs and runtimes. Issues and pull requests will be open from day one. A follow-up release will add a C++ codec library, simplifying integration into real-world applications. Where we're heading Our long-term goal with MLVC is to create an open, learned video codec that meets or exceeds the coding efficiency of the best conventional codecs across the full range of video content, runs efficiently on the AI hardware already shipping in client and cloud devices, scales with compute the way modern ML systems do, and evolves in the open at the pace of the ML community rather than the pace of standardization cycles. In the near term that means stabilizing 540p real-time performance, expanding hardware coverage, and improving loss resilience. In the medium term: higher resolution, e.g., 1080p, and broader streaming scenarios. In the long term: an open video codec ecosystem that meaningfully replaces legacy stacks where it makes sense to. We can't create the future of MLVC alone. We're glad you're here, and we are looking forward to building the next-generation video codec with you. Who are we MLVC is brought to you by the following awesome folks working on the project at Microsoft: Ross Cutler, Ando Saabas, Tanel Pärnamaa, Ardi Loot, Haiyan Xie, Lauri Ehrenpreis, Andrei Znobishchev, Martin Lumiste, Evgenii Indenbom, Yan Lu, Bin Li, Jiahao Li, Naba Kumar, Babak Naderi, Juhee Cho, Badal Yadav, Jinxin Zhou, Tianyu Ding, Patrick Gregory. — The MLVC Team, Microsoft15KViews0likes4CommentsIntroducing kars - an Agent Reference Stack for Kubernetes
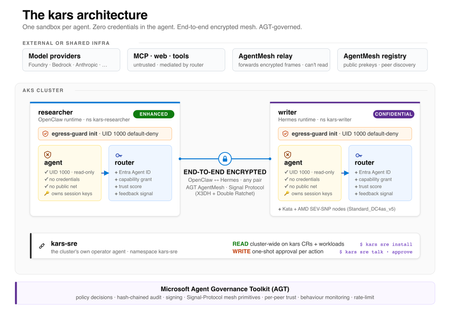
kars is an open-source, Kubernetes-native runtime for AI agents on Azure. It treats every agent as untrusted code - per-pod kernel isolation, zero credentials in the agent process, and an end-to-end encrypted inter-agent mesh - and governs agents on any framework with one set of Kubernetes policies via the Microsoft Agent Governance Toolkit. kars dev runs a governed agent on your laptop in minutes.2.4KViews1like2CommentsFind and fix app issues - Azure Copilot Observability Agent
The Azure Copilot Observability Agent autonomously investigates incidents, correlates signals across logs, metrics, alerts, application health, and ML anomalies, then surfaces root cause with charts and recommended next steps. Extend coverage to your AI agents in Microsoft Foundry, track Gen AI errors and token consumption with trace-level detail, and write plain-language instructions to tune autonomous behavior to match your team’s workflow. Matt McSpirit, Microsoft Azure expert, shares how to take full control of incident response at scale. Any alert, full stack. The Azure Copilot Observability Agent correlates OpenTelemetry & native Azure signals end-to-end. Trace any issue to deep failure analysis across every tier. Check it out. Logs. Metrics. Alerts. ML anomalies. The Azure Copilot Observability Agent correlates them all, surfaces root cause, and recommends mitigation steps automatically. See it here. Tune the Azure Copilot Observability Agent to match your team’s workflow. Write natural-language instructions to set alert groupings, escalation rules, and issue priorities. See how. QUICK LINKS: 00:00 — Azure Copilot Observability Agent 00:43 — How to use it as you work 01:33 — Unified Full-Stack Telemetry 02:39 — Root Cause Investigation 04:12 — Investigate further 04:55 — Re-run the investigation 05:36 — Autonomous Alert Correlation & Triage 07:13 — Natural Language Agent Customization 07:34 — Wrap up Link References Get started at https://aka.ms/ObservabilityAgent Unfamiliar with Microsoft Mechanics? As Microsoft’s official video series for IT, you can watch and share valuable content and demos of current and upcoming tech from the people who build it at Microsoft. Subscribe to our YouTube: https://www.youtube.com/c/MicrosoftMechanicsSeries Talk with other IT Pros, join us on the Microsoft Tech Community: https://techcommunity.microsoft.com/t5/microsoft-mechanics-blog/bg-p/MicrosoftMechanicsBlog Watch or listen from anywhere, subscribe to our podcast: https://microsoftmechanics.libsyn.com/podcast Keep getting this insider knowledge, join us on social: Follow us on Twitter: https://twitter.com/MSFTMechanics Share knowledge on LinkedIn: https://www.linkedin.com/company/microsoft-mechanics/ Enjoy us on Instagram: https://www.instagram.com/msftmechanics/ Loosen up with us on TikTok: https://www.tiktok.com/@msftmechanics Video Transcript: -When you run compute services at scale, issues are bound to happen. The real question is how quickly you can understand and fix them. This is where AI can cut through the noise, bringing you the right signals so that you can start your day with critical issues already investigated. Azure Copilot Observability Agent, powered by Azure Monitor, can run autonomously with knowledge of your environment, application topology, its dependencies and typical patterns. It monitors alerts streaming into Azure Monitor, triaging and correlating related alerts into issues requiring your attention so that you experience less alert fatigue and noise. The agent investigates critical issues to determine the root cause, and then recommends mitigation steps. Let me walk you through how you can use the Observability Agent to your advantage as you work. -Using Azure Monitor, I can observe my app, across tiers. The App map shows me the topological view of my app. It’s a multi-tier app with a modern micro-service backend, hosted on Kubernetes, with a SQL database, Redis cache and more. The app also has an agent built in Microsoft Foundry, and with the new Foundry capabilities, I can also observe how it is performing from operational metrics, including Agent Runs, Gen AI Errors, Tool Calls, underlying Models, and Token Consumption. And scrolling up, we can even view traces with Gen AI errors and can see a list of traces. I’ll look at this one with 93 items. And if I click in, I can see a trace view of all the agent’s activities with direct integration into our existing backend APIs through an MCP server. This is where Azure Monitor and unified logging is foundational to connecting the dots for a more complete view of the health of your service. It unifies telemetry in real time across the stack using OpenTelemetry as well as native integrations with Azure Services and normalizes those signals into a consistent schema. -And because everything shares the same data foundation, it’s easy for either you or the Observability Agent to move instantly from insights, such as failed requests to more details across different failure categories, which can be drilled into and queried further without having to stitch anything together. So, this way even though there are several teams involved across app and infrastructure managing my app, everyone shares a common operational view to keep it operating smoothly. -In fact, let’s go back into Azure Monitor to see how my app is doing, specifically my agent. This time I’ll start in our agent alerts view. It looks like my agent is experiencing some errors I’ll choose this alert, to view additional details and this is where you can invoke the Observability Agent using the investigate button. Importantly, once you have Azure Monitor running in your environment, there is no setup needed. -So, now I have the agent open. Let’s start the investigation. Now, when invoked for the first time, the Observability Agent will learn about your app, its topology, patterns, baselines, and more. In this case, the agent already has deep knowledge of my app so it launches directly into an investigation. It’s able to correlate and reason across signals spanning the full application stack, logs, metrics, alerts, application health, and ML-detected anomalies, to pinpoint the root cause of the incident. It plans, executes, backtracks, runs multiple queries and validates or disproves hypotheses, just like a human expert would. After completing the investigation, Observability Agent produces a detailed report with its findings. Now in this case, it’s discovered failures when the agent hit the MCP product catalog where the backend telemetry shows the underlying failure was a SQL execution time out. We can see a consistent time out pattern with 117 failed SQL dependency calls. It’s ruled out any issues with the Redis cache. And has determined that there was NO SQL outage. -Instead, SQL metrics show a small saturation window at the incident start which dropped after the initial spike which would have led to connection failure. And it also charts its findings visually with search failures, latency spikes, failures by dependency and CPU and DTU spikes. And back on the left we see it’s recommending what can be done next, including how to improve querying and code, as well as monitoring. -Now at this point, you can either start a new investigation or build off the Observability Agent’s findings. I want to investigate further. There are a few things that cause spikes like this so I’m going to clarify if our SQL server saw a spike in traffic leading to timeouts. The Observability Agent responds quickly and notes stable to moderate SQL volume with many of the details we saw earlier. This time though, it’s found the root cause. It appears that an expensive query consumed significant SQL CPU resources. I am also concerned about token usage during the incident so I’ll ask the Observability Agent to check for anomalies. And after it’s done its analysis, the agent rules out my hypothesis there too. -So, it’s easy to collaborate with the Observability Agent, in the context of the incident. You can even ask the agent to re-run the entire investigation with additional instructions if you need to. Next, I want to create an issue that captures the progress of the investigation I’ll keep all the details and agree to share the agent chat around this issue so that it can be viewed by others on my team, which lets you hand off the issue to a colleague without losing context. The issue will retain the history of the incident, so no one has to start from scratch. In fact, this becomes a shared case file for the investigation. -So, I just walked you through a manual flow for how you can use the new Observability Agent as you work. Next, let me show you how you can get the Observability Agent to work alongside you autonomously on your behalf with a new capability in public preview. Either from the marketplace or Azure Monitor, you can create a new Observability Agent resource. -First, you start by giving it name, selecting the region, and your Azure Monitor workspace. Next, you’ll point it at your Application Insights resource. We’ll use our “ct-agent” from before. And then you can configure whether you want the agent instance to run autonomously on auto-created issues to provide root cause analysis and next steps. From there, I just review and confirm. The Observability Agent will then learn about your application to establish deep expertise and knowledge of your environment and preserve it in the agent instance. And if an alert arrives, the agent creates an issue automatically and correlates any additional related alerts into that same issue, before launching an investigation. -Now once an investigation is underway, the Observability Agent notifies you, for example, via email, with background on the detected issue. And from there, you can review the overview and look at the associated alerts. As you can see, in our case, the Observability Agent was able to use deep, agentic reasoning to correlate separate alerts both for the agent in this application and for the backend APIs invoked independently and then bring them together into a single, unified view. This significantly reduces alert noise. -Now this correlation is also important for issue triage. Because individually, these alerts might have lower severity, but when correlated, they increase the overall severity of the issue. And clicking into the Observability Agent tab we can see that the investigation is complete. This is a comprehensive report like we saw earlier with its analysis, corresponding chart visualizations, and recommendations on what to do next. Now as you set up agents, you can also customize them with your own instructions to prioritize what’s important. So, if we go back to where you create a new agent instance, here’s where you would add specific instructions, written in natural language. For example, you can tell an agent to group certain alerts, and prioritize the ones that should always trigger an issue so that its autonomous behavior matches how your team operates. -So that’s the power of Azure Monitor with the Azure Copilot Observability Agent which together turn alerts into fully investigated issues with clear, actionable insights. By correlating signals across your entire stack, it helps you move from detection, to root cause, to action-faster, and without losing context. The result: less time triaging, faster resolution, and more resilient systems at scale. To learn more, visit aka.ms/ObservabilityAgent. Keep watching Microsoft Mechanics for the latest tech updates and thanks for watching.194Views0likes0Comments