microsoft fabric
96 TopicsMeet the IQ's: How Microsoft is Creating Context-Aware AI
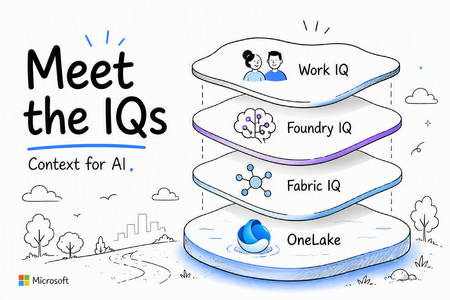
Microsoft Architect's: Lavanya Sreedhar LavanyaSreedhar, Tom Dinh Tom-Dinh, Oviya Soundararajan oviyasound, and Rafia Aqil Rafia_Aqil The AI era demands more than powerful language models. It demands context a deep understanding of what enterprise data means, how it connects, and how AI systems can reason and act on it intelligently. Microsoft has been building the foundational intelligence layer that makes this possible: a family of capabilities collectively known as the IQ Platform. The Microsoft IQ Platform is not a single product but a set of complementary intelligence layers: Work IQ, Fabric IQ, and Foundry IQ each designed to inject rich contextual understanding into a different part of the enterprise technology stack. Together, they represent Microsoft’s strategic vision for how AI can move beyond isolated answers and become a true operating system for organizational intelligence. This article unpacks each IQ, explains the problems they solve, and explores how they work together to power the next generation of AI-driven enterprise workflows. How the IQs Work Together? Work IQ, Fabric IQ, and Foundry IQ are not competing products or overlapping investments. They are complementary intelligence layers designed to operate across different contexts within the enterprise, and they are most powerful when combined. Work IQ brings the intelligence of Microsoft 365 to every agent and Copilot experience- connecting people, conversations, documents, and organizational signals into a semantic layer that understands how work happens. Fabric IQ brings the intelligence of enterprise data and business context- teaching AI not just what the data says, but what it means in the language of your business: entities, relationships, rules, and governed actions. Foundry IQ brings the infrastructure intelligence that enables all of this to scale- eliminating the undifferentiated plumbing of agentic AI and letting teams focus on building the workflows that actually differentiate their business. Together, the IQ platform represents Microsoft’s answer to one of the defining challenges of the AI era: not just making AI more capable, but making AI contextually aware-grounded in the real knowledge, relationships, and intent of your organization. Fabric IQ: Teaching AI the Language of Business Microsoft Fabric is an end-to-end, unified data analytics platform centered on OneLake- a centralized data lake that stores all analytical and operational business data in open Delta format. Because every Fabric compute experience (Data Engineering, Data Warehouse, Data Factory, Power BI, and Real-Time Intelligence) natively reads from OneLake, organizations gain a single source of truth without copying or duplicating data. OneLake also provides mirroring and shortcut capabilities so existing data can be accessed in place, wherever it lives. Most organizations have made significant progress consolidating their data. The harder challenge is giving AI- and the people who use it-the ability to reason about that data in business terms, not technical ones. Outside of data professionals, businesses do not talk about tables or schemas. They talk about entities that matter to them. Fabric organizes data. Fabric IQ teaches AI what that data means. Three Layers of Business Context Fabric IQ introduces three intelligence layers that together create a unified, contextually rich environment for enterprise AI: Unified Data Layer: Delivered through OneLake and the OneLake Catalog, this provides a single source of truth for all structured and unstructured data across the organization. Business Intelligence Layer: Delivered through Power BI Semantic Models, this layer provides curated measures, hierarchies, dimensions, and trusted KPIs- translating raw data into the analytical language of your business. Operational Intelligence Layer: This is where Fabric IQ’s most distinctive capability lives: Ontology. An Ontology is a model of your business- a graph of entities (such as Patient, Provider, Product, or Account), the relationships between them, the business rules that govern them, and the actions AI agents can take. It functions as the brain that enables AI to understand business context and act on it in a governed, explainable way. Together, these three layers create shared context across all business data stored in OneLake-enabling modern businesses, people, and AI to operate as one unified system. A Real-World Example: Healthcare Consider a care management executive asking: “Which diabetic patients discharged in the last 30 days are at high risk of readmission because they missed follow-up appointments, had medication adherence issues, and recently visited the Emergency Department?” Without Fabric IQ, answering this requires analysts to manually join EHR data, appointment systems, pharmacy records, and ED utilization data- writing SQL across multiple datasets and validating business logic with clinicians. It is slow, brittle, and error-prone. Semantic models can curate data for reporting and analysis, but they do not provide enterprise-scale context integration. With Fabric IQ, an Ontology can be created with entities like Patient, Encounter, Provider, Medication, Diagnosis, Appointment, and Care Plan- each bound to Lakehouse tables, Eventhouse tables, or Materialized Views. Relationships describe how patients connect to their diagnoses, medications, appointments, and treating providers. Business rules enforce data quality, identifying missed follow-ups, recent Emergency visits, and medication gaps. The result is a shift from siloed analytics to true system-level intelligence- an organization where data, AI, and people operate from a shared understanding of the business. Foundry IQ: From Infrastructure to Intelligence Building production-grade AI agents has traditionally meant writing a significant amount of undifferentiated plumbing, custom retrieval pipelines, memory systems, ranking logic, and orchestration code just to enable core RAG and agentic capabilities. While powerful, this approach often leads to complex, hard-to-maintain codebases that distract from the real goal: solving domain-specific problems. With Foundry IQ, Microsoft is fundamentally changing that model by turning these underlying capabilities into managed platform services, allowing teams to shift from building infrastructure to focusing on intelligent workflows. Foundry IQ acts as part of Microsoft's managed platform, enabling agents to use agentic reasoning to access, process, and act on knowledge from anywhere. It is Microsoft Foundry’s way of turning the undifferentiated plumbing behind a RAG agent, such as retrieval, ranking, citations, memory, and personalization, into managed, server-side services that you provision once and call through clean interfaces. Foundry IQ allows you to remove the infrastructure you never wanted to own in the first place. What This Means in Practice Instead of stitching together retrieval pipelines, embedding logic, ranking strategies, and memory mechanisms, Foundry IQ centralizes these capabilities into a single, opinionated platform layer that agents can directly consume. Developers no longer design and maintain each component individually. The knowledge base becomes the centerpiece of the workflow. Rather than coordinating multiple services and response handlers, applications make a single call to retrieve grounded context. Vector-semantic-hybrid querying, query planning, semantic ranking, and citation generation are all encapsulated within the provisioned knowledge base-with no retrieval or embedding logic to maintain in the client application. Memory follows the same pattern of abstraction. Instead of multiple classes and helper utilities to manage storage, user profiles, summarization, and context reconstruction, Foundry IQ replaces this entire layer with a single memory provider backed by a service-managed store with built-in capabilities for chat summarization and user-profile extraction. A Real-World Example: Clinical Workflows Consider building an AI-powered clinical workflow application. Previously, features like agent memory, knowledge base retrieval for grounding, and personalization all had to be written as custom logic and wired manually into the application. This resulted in thousands of lines of code, numerous helper functions, and brittle architecture that was difficult to evolve. With Foundry IQ, that same solution can be reimagined. A single provisioning script now stands up all required services and executes the data-plane steps to create a memory store, build the search index, and provision a Foundry IQ knowledge base for agentic retrieval. Because the top-level router agent carries its own memory, it can directly answer recalled context without relying on confidence thresholds, rule-based branching, or forced workflow paths. Conversation history is handled automatically at ingress- no custom thread management system required. What remains is only what was always worth building: domain-specific logic. Citation validation against grounded evidence. Hallucination checking using LLM-as-a-judge patterns. Agent revision loops. Everything else- retrieval, ranking, memory, user profiles, conversation management- is provisioned once and consumed as a platform capability. The result: a dramatically reduced surface area for bugs, significantly less code to maintain, and teams freed to focus entirely on the work that differentiates their product. Work IQ: Making Microsoft 365 Data Meaningful For years, Microsoft has given organizations API access to their Microsoft 365 data through the Microsoft Graph- emails, calendar events, OneDrive files, Teams conversations, and more. While valuable, this access essentially treated M365 as a structured database: query an endpoint, retrieve an artifact, parse the metadata. The problem was volume and context. With thousands of signals generated every day across the organization, customers needed a way to extract not just data but meaning. In the past year, Microsoft introduced a semantic index built on top of that raw M365 data- a layer that understands not just what exists in your ecosystem, but how everything relates to one another. This intelligence layer is Work IQ, and in an increasingly agent-driven world, it fundamentally changes what AI can do for your organization. In an AI-first world, the advantage is not simply in a model’s ability to reason- it’s in the richness of the context it can reason over. The Contrast in Action Consider asking an agent a simple question: “What’s the latest on Customer Contoso?” With the Microsoft Graph API alone, the agent must stitch together multiple endpoint queries- Teams chats, SharePoint documents, email threads and attempt to piece the results into a coherent answer. It lacks any connective tissue. It doesn’t know what’s relevant, what’s meaningful, or how these isolated data sources relate to each other. The burden of reasoning falls entirely on the agent. With Work IQ, that same prompt taps into a semantic layer that has already done the connecting. The agent knows Contoso-related details span a specific SharePoint folder, identifies the active Teams channel for progress tracking, and surfaces the key people involved. The response is grounded in a web of contextual relationships not just retrieved data. Three Core Components Work IQ is enabled by three powerful components: Data: Unifies signals from files, emails, meetings, chats, and other M365 business systems to capture how work actually gets done across your organization. Memory: Enables persistent context about how people and teams work: details inferred from past conversations, explicit memories stored with Copilot, and custom instructions you’ve configured. Each interaction allows Copilot to learn more about your priorities, preferences, and working style. Inference: Brings together skills, models, and tools to move work forward. It goes beyond understanding your work to deciding what should happen next. Data captures and indexes your M365 knowledge. Memory builds a personalized understanding of how you work. Inference translates this into action. Think of Work IQ as a specialized brain trained on who you are at work within the full context of what your organization knows. Get Started Whether you’re exploring how to ground your AI applications in richer organizational context, looking to reduce the infrastructure burden of building intelligent agents, or seeking to make your enterprise data more actionable the Microsoft IQ Platform offers a path forward. We encourage you to explore the Microsoft Fabric documentation, Azure AI Foundry resources, and the Microsoft 365 developer platform to learn more about how each IQ capability can fit into your architecture. Build MicrosoftIQ powered agents, this cookbook walks through it step by step: files → Web IQ → Work IQ → Fabric IQ → MCP endpoint: https://lnkd.in/edrjG99F Select Microsoft IQ in your Copilot agent settings, follow step by step instructions here: Bring your enterprise data to every agent conversation We’d love to hear how you’re thinking about context-aware AI in your organization. Share your thoughts and questions in the comments below. Links: Microsoft IQ | Unified Enterprise Intelligence for AI Work IQ overview | Microsoft Learn What is Foundry IQ? - Microsoft Foundry | Microsoft Learn Fabric IQ documentation - Microsoft Fabric | Microsoft Learn1.5KViews3likes1CommentFabric Data Agents can choose Query Language based on Context
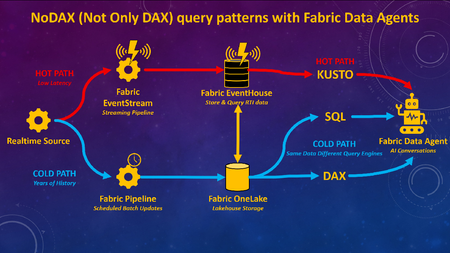
What if you could combine decades of historical analysis with live, real-time data in one seamless AI chat experience? Traditionally, analyzing large volumes of past data (Analytics / Business Intelligence) has been a separate architecture, or has at least required separate toolsets, from monitoring what’s happening right now (real-time, IoT, etc). With Fabric Data Agents, analytics for large volumes of historical data can be accessible with real-time data via a single AI query endpoint. Analytics can be used to gain understanding from historical data, and findings can be put into action for real-time scenarios, all through a single interface for the end users. Figure 1.0 – Fabric Data Agent can use different query languages for optimal performance with a lambda-style RTI architecture on Fabric Many of the demos I’ve seen for Fabric Data Agents will highlight the capability to connect to different types of queries and sources via a single endpoint such as Lakehouses (SQL), Warehouses (SQL), Semantic Models (DAX), Eventhouses (Kusto), and Ontologies. What I have not seen frequently discussed is adding different query engines on the same data for the purpose of optimizing query performance based upon the context of the query and the latency of the data, as per Figure 1.0 above. To be clear, I am not advocating duplication of data for the purpose of query performance. Rather, this architecture would enable Fabric Data Agents to choose the best query language for the context of the query. Hence the acronym I created for this blog article “NoDAX” which stands for “Not Only DAX.” NoSQL “Not Only SQL” is a real term referring to non-relational database systems designed for flexible schemas, horizontal scaling, and high-performance access to large, distributed datasets. NoDAX exists only within this blog post, and represents the availability of multiple query languages within a single Fabric Data Agent. The best query language can be used based on the context of the question and query. Not only DAX but also SQL, Kusto, and Ontologies can be queried to generate the most efficient contextual query. Figure 1.1 – Explaining the NoDAX acronym created for this article Why does this use case matter? The ability to query both the past and the present in one interface isn’t just a novel technical capability. Many analytic solutions can benefit from a pattern of [analysis + action]. Analytics by itself is great at understanding the past. We can look at years of historical data to figure out patterns, drivers of performance, and what went right or wrong. Historical context is incredibly valuable, but understanding the past doesn’t improve outcomes in the future. The real value comes when we connect findings from the past to decisions we make right now and in the future. If you discover historical data patterns that lead to an inventory shortage, a fraud event, or a patient risk score increasing, you can apply that insight to the latest operational data and act on ongoing workflows. Analytics and action have to reinforce each other. Analytics without action doesn’t create value. But action without understanding can easily make things worse. I once had a veteran analytics manager say to me “Without carefully considered and vetted KPIs you are flying blind. But be careful, because a KPI without proper context and understanding will quickly become a blunt object that an empty suit uses to whack somebody over the head.” Figure 1.2 – The purpose of this architecture is to learn from the past to improve the present and future Different Query Languages without data duplication A Fabric real-time architecture can be part of a design pattern that is similar to if not a version of a Lambda architecture. With a Lambda architecture, hot path data is available for real-time alerting and analytics while cold path data is stored for deep and complete historical analytics and data science. Figure 1.3 – NoDAX architecture can query a lambda-style architecture via multiple query endpoints Per the diagram above, real-time data is available in Fabric ASAP and cycled through an Eventhouse. Historical data can either be batched into a Fabric Lakehouse / Warehouse or copied over from the Eventhouse. A Fabric Data Agent can then generate Kusto queries against the Eventhouse, SQL queries against the Lakehouse / Warehouse, or DAX queries against the Warehouse / Lakehouse via the Direct Lake Semantic Model. DAX is often the best query language for data having deep history with complext analytic logic. SQL can be the best query language for retrieving historical row-level information from a robust relational database. Kusto can be used to query what’s happening right now via a real-time Eventhouse. Lambda architectures have been around for years, so why is this architecture a new option? Past lambda architectures would have hot path data available in a streaming toolset such as Azure Eventhub, and then store historical cold path data in a tool such as Azure Data Lake. Hot path alerting and reporting was usually disparate from historical cold path analytics. Per the diagram 3.4 below, with Microsoft Fabric, you can now: implement both the hot and cold path in a single Fabric environment (Eventstream, Eventhouse, Lakehouse / Warehouse). Ontologies are also an option. query the hot and cold path data via a single agentic endpoint using a Fabric Data agent Query either the hot or cold path using the optimal query language for the context of the question (DAX, SQL, Kusto, Ontologies) Figure 1.4 – Fabric not only unifies components of lambda-style architecture, but Data Agent also unites the query endpoints for AI unification Example use case for Healthcare Here’s an example of a Healthcare use case: A user might ask a question “Show me the percentage of patients who had their pain scores checked every hour for gall bladder removals on floor 5 over the last 3 years.” This will ideally filter three years worth of data for patients with specific procedure codes, filtered for specific rooms, and calculate the pain score check compliance for those visits. This query is ideal for the DAX language with a Semantic Model. The user might then want to see details for a specific time period, and ask “Show me the pain score results for patients who had their gall bladder removed on July 3 2024 on floor 5.” A SQL query might be the best option here against the Fabric Warehouse or Lakehouse, since SQL is better than DAX at retrieving row-level information. Then the user might want to know what is happening today. “Show me the pain score checks for inpatients right now who had their gall bladder removed on floor 5.” The Kusto language can retrieve the information that streams into a Fabric Eventhouse via an Eventstream. Based on the findings, the user may take an action. With the example above, a user was able to query deep history with analytic logic, retrieve historical row-level information from a robust relational database, and then view what’s happening right now for those patients. Action can then be taken in the here and now. Here are some additional use cases for Finance, Supply Chain, and Manufacturing in addition to Healthcare: Figure 1.5 – Industry use cases for Fabric Data Agent with multiple endpoints Video Summary Below is my video summary and demo of the Fabric Data Agent NoDAX architecture: Configure Fabric Data Agent for NoDAX query patterns When more than one source is added to a Fabric Data Agent, by default the source used for a specific query will be chosen based on interpreting available metadata. The Data Agents have a field called "Agent instructions" which can be used to provide detailed instructions about choosing the right source for the right question. Here’s a screenshot of the Agent instructions: Figure 1.6 – Agent instructions will guide the Fabric Data Agent to the best query endpoint I would recommend extensive unit testing and iterative improvements to the Agent instructions based upon your own data and use cases. Here’s a few examples that worked for my initial testing. I would recommend much more robust and carefully designed prompts for a production solution, but this is a baseline of an approach I found to work based on the demo in the video above: The KQL database named SeattleFireEventHouse is a live stream of 911 calls to the fire department in the city of Seattle. Whenever someone asks for “most recent” or “newest” or “latest” use SeattleFireEventHouse The lakehouse SeattleFireLakehouse should be queried with a SQL statement when someone asks for a list of incidents before the year 2026. Use SQL to retrieve row level requests for historical data. The semantic model SeattleFireSemantic Model should be queried when questions ask about historical analytic trends such as call volume averages, Year over year changes, and queries that aggregate data for analytic queries.Rayfin | Go from prompt to production backend
Describe the app you want using Rayfin’s open-source SDK with GitHub Copilot, and generate your full backend in code — schemas, relationships, and access policies included. Deploy to Microsoft Fabric with a single CLI command and immediately inherit enterprise data security, identity controls, and audit compliance already in place across your data estate. Connect your app’s live operational data to years of historical records in Fabric from the moment you deploy, no pipelines, no data movement. Query across both datasets using a Fabric data agent you spin up directly on your app’s data. Will Thompson, Microsoft Fabric Principal Product Manager, shares how to take an app from idea to governed production deployment in a single session. Describe the app you want. Rayfin and GitHub Copilot generate your full backend in code- schemas, relationships, and access policies. No manual wiring. See how it works. One CLI command. Fully managed SQL database, APIs, and static hosting in Microsoft Fabric. Rayfin handles provisioning automatically. Take a look. Spend less time configuring. Spend more time creating. Get managed backend services, authentication and authorization, data APIs, built-in analytics, and AI-ready architecture with Rayfin. Check it out. QUICK LINKS: 00:00 — Simplify backend complexity 01:20 — Home delivery service app 01:48 — Data analysis app 02:26 — See the build experience 03:08 — Copilot Generates Full Backend 03:47 — Authorization defined alongside schema 05:06 — One CLI Command Deploys to Fabric 05:21 — Create analytics app & add pages 06:31 — App Data Connects to Fabric Data Estate 06:55 — Conversational Data Agent on App Data 08:13 — Wrap up Link References Get started at https://aka.ms/rayfin Unfamiliar with Microsoft Mechanics? As Microsoft’s official video series for IT, you can watch and share valuable content and demos of current and upcoming tech from the people who build it at Microsoft. Subscribe to our YouTube: https://www.youtube.com/c/MicrosoftMechanicsSeries Talk with other IT Pros, join us on the Microsoft Tech Community: https://techcommunity.microsoft.com/t5/microsoft-mechanics-blog/bg-p/MicrosoftMechanicsBlog Watch or listen from anywhere, subscribe to our podcast: https://microsoftmechanics.libsyn.com/podcast Keep getting this insider knowledge, join us on social: Follow us on Twitter: https://twitter.com/MSFTMechanics Share knowledge on LinkedIn: https://www.linkedin.com/company/microsoft-mechanics/ Enjoy us on Instagram: https://www.instagram.com/msftmechanics/ Loosen up with us on TikTok: https://www.tiktok.com/@msftmechanics Video Transcript: -What if building a real, production-ready enterprise app didn’t take months, but just a few hours? Today, AI can generate app logic and front ends almost instantly. And while everything works great with test data, the moment you try to connect that app to real enterprise data, everything slows down. Because now you have to wire up a database with access control, set up authentication, configure backend services, and make sure everything is secure and scalable. Your quick app turns into a complex backend project with multiple failure points, and that’s where Rayfin comes in. It’s designed to simplify backend definition in code and elevate the developer experience. Our open-source SDK and CLI grounds your agentic coding tools so that when you describe the app that you want to build, it can automatically define your app’s backend in code, including your data schemas, relationships, and access policies. -And then with a single CLI command, you deploy to our unified data and analytics platform, Microsoft Fabric. This spins up a fully managed backend with a SQL database with familiar billing and sharing models, as well as static hosting. APIs are generated automatically to ensure your app can communicate securely to data and services and Fabric’s identity and data security layer ensures that when your app accesses or queries data, it respects existing policies in place across your data estate. -To show how this works in action, I’ll start by showing two apps I built with Rayfin and then walk you through how I created them. My first app is a mobile home delivery service app for a home improvement retailer, with all orders delivered directly to customers’ doors. Drivers must be signed in to access the app, ensuring that every delivery is securely tied to an authenticated user. They can record deliveries, capture photos as proof, and even collect customer signatures to acknowledge receipt. And all this happens in real time. -Next, as a business, we want to learn from the data captured in our delivery app. So I’ve built a second app for data analysis. Because it runs in Fabric, the operational data is already connected to our broader enterprise data estate. It has access to years of customer data in Fabric, modeled and ready to use. And by connecting that data to the live data that our delivery app captures, retail managers now have immediate insight into how the new delivery service is impacting customer satisfaction. Now these apps were built in minutes. They’re not a proof of concept. They have real auth, real data, and real governance, and they work directly with enterprise data already in Fabric. -Let me walk you through the build experience. I’ll open a terminal and run the Rayfin create command, and this will walk me through my entire project setup. I can see that I have various templates that I can use to get started. So let’s go with the blank app template. It’s asking for a name and I’ll name it Delivery App. And you can see it’s creating the project. And under the covers, it’s installing all the necessary dependencies and adding the files I need, including the agent instructions for using the SDK and CLI. Now I can CD into my project and start the development server. Since deploying to Fabric, it prompts for a Fabric workspace name and I’m going to use Zava. And the deployment process is now in full swing with Fabric provisioning my foundational resources. -So now with our Rayfin foundation in place, let’s build the app. Using VS code with GitHub Copilot, I can now describe the app I want and Copilot knows how to build it, including the backend. Let’s try it out, I’ll type a prompt, build a Rayfin delivery app where drivers log deliveries with photos and item conditions and customers confirm receipt. I’m also going to start the Rayfin MCP server and this will help ground Copilot in all the latest best practices for Rayfin. As Copilot is getting to work, we can see it’s using the documentation for the MCP and CLI tool to understand the specifics of Rayfin. And Copilot will run independently using the skills defined by the Rayfin template. That’s going to take a few minutes, so we’re going to jump ahead to the results. -Here’s the app right here in code and there’s lots more to it, in fact, to understand the depth of what was created, let’s take a more detailed look. Inside the Rayfin folder, we can see our whole data schema, customers, deliveries, items, photos, drivers, and more. And if we take a look at how Copilot defined the driver entity, this is where Rayfin shines. The schema lives right in the code, which means instead of keeping the rules about your data in separate places like databases, SQL files, or configs, they’re built right into the code. So things are less likely to break and easier to keep consistent. Each field maps to a column in the database. ID name, email, and optional phone number with types and constraints built in. -And it captures relationships too. It calls out a driver has many deliveries. But here’s the key part, the access policy sits right next to the data. This rule says a user can only ever touch their own driver record. Authorization is defined alongside the schema not bolted on later. And if we open the delivery entity, you can see some of the scale Rayfin is capable of with richer relationships, defined with drivers, customers, and items, and a smarter policy where delivery can be read by an authenticated driver or its customer. And of course I can always customize any of this by hand if I need to. So that was the build experience. -Now let’s look at how we can deploy the app to Microsoft Fabric. I’ll ask Copilot to deploy our app and Copilot is using the Rayfin Up command to deploy everything we’ve defined straight to Fabric. And just like that, our app is deployed and available. Next, directly from Fabric, I’ll show you the steps to create our analytics app. I’ll start in the Fabric portal this time and I’ll call this app Delivery Analysis. This leverages a template that the Microsoft Power BI team built. It’s called a Data App template, and it gives our coding agent what it needs to connect to semantic models and create beautiful interactive visuals. -So I’ll select Data App, and now I can manually follow these steps or just copy the prompt and run it in VS Code to get started scaffolding my project. I’ll move over to VS Code and paste in the prompt and the agent knows exactly how to start up my new Rayfin app. Once it’s finished, you’ll see that the delivery analysis directory has been added. Now we can also add pages to our new app using Copilot. Here I want to add an insights page. So I’ll prompt, Add a customer satisfaction page, which shows historical CSAT scores from our linked semantic model and compare it against a given driver’s delivery ratings. The important detail here, I’m pointing it straight at our Fabric semantic model, so it’s using a preexisting and trusted business model. This process will run for several minutes, creating and executing a plan and querying our semantic model for what it needs. -To save time, I’ll jump back in near its completion. Now the app is ready and I can view it from the provided link. And we can see historical customer satisfaction data trending up since we launched the delivery service with details broken down by driver. Now, data isn’t moved between systems. Everything stays connected from the start. The backend is already connected to your enterprise data estate. And because all of your new data is now also landing in Fabric, there’s lots you can do on top of it. -Now that our app is live and generating data, the next step is making that data actionable through conversation. So instead of building another report or connecting the data to a Fabric notebook, I’m going to go ahead and create a data agent directly on top of this app’s data. I’ll name the agent, Zava Insights Agent, and next I’ll point it at the warehouse I configured earlier. This combines my operational database and historical data as the source. And now I can ask questions against my data just like I would to an analyst. -Let’s start with a simple question. I’ll ask, what is the average customer rating across all our deliveries? The agent understands the data model and returns the answer instantly as 4.56 out of five. But now I’ll go deeper. How does our customer satisfaction compare before and after we launch the new delivery service? It doesn’t just retrieve the data. It reasons across time and trends in the model. And we can see that it’s gone from 3.8 to 4.4 out of five since launching the new service. So instead of navigating dashboards, the business can now ask questions directly against the app and get answers grounded in the same governed data that powers the app. -And just like any Fabric artifact, I can share the app that we created earlier with other people in my organization. So let’s grant Lynne access. They were asking about the delivery analysis and now they can explore the data themselves without waiting on reports. Rayfin helps you go from idea to production faster. By using AI to build and deploying to Fabric, your app inherits existing data security controls, permissions and audit requirements, keeping everything compliant and under control. -To learn more, check out aka.ms/rayfin and keep watching Microsoft Mechanics for the latest tech updates and thanks for watching.341Views0likes0CommentsStreaming and Batch Data Architectures with Microsoft Fabric to Azure Databricks
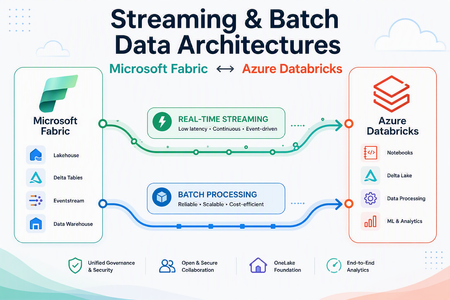
Author's: Aladdin Alchalabi aalchalabi, Oscar Alvarado oscaralvarado and Rafia Aqil Rafia_Aqil Note: This article describes a solution idea. Your cloud architect can use this guidance to help visualize the major components for a typical implementation. Use this article as a starting point to design a well-architected solution that aligns with your workload’s specific requirements. As organizations adopt Microsoft Fabric as their unified analytics platform, it has become a leading path for ingesting both streaming and batch data into Azure Databricks. This article covers integration approaches -via Microsoft Fabric- and details the five Fabric-specific paths that connect OneLake/ADLS and Databricks for end-to-end data processing. Medallion Architecture The following data flow corresponds to the architecture diagram: Data is ingested through Microsoft Fabric (via Mirroring, RTI, or Data Factory) lands data into OneLake/ADLS. With the medallion pattern, consisting of Bronze, Silver, and Gold storage layers, organizations have flexible access and extendable data processing: Bronze – Raw data entry point. Data arrives in its source format and is converted to the open, transactional Delta Lake format. Silver – Optimized for BI and data science. ETL and stream processing tasks filter, clean, transform, join, and aggregate Bronze data into curated datasets using SQL, Python, R, or Scala. Gold – Enriched data ready for analytics and reporting. Analysts use Power BI, PySpark, SQL, or Excel for insights and queries. Fabric Integration Paths Note: This architecture establishes a complete loop-back between Microsoft Fabric and Azure Databricks, enabling Gold layer tables to be seamlessly mirrored back to Microsoft Fabric for dashboarding through Azure Databricks Mirroring. The following five paths connect Microsoft Fabric to Azure Databricks: Fabric Mirroring to OneLake – A low-cost, low-latency turnkey solution that creates a replica of data from operational sources (SQL Server, Azure Cosmos DB, Oracle) in OneLake. Handles the initial load and ongoing CDC changes automatically, keeping data continuously up to date. Fabric RTI to OneLake – Fabric Real-Time Intelligence ingests streaming event data into OneLake with sub-second latency, enabling real-time analytics on live event streams. Fabric Data Factory to OneLake – Orchestrates ingestion from diverse sources not covered by Mirroring (such as Sybase or REST APIs) and lands data in OneLake, ensuring complete source coverage. OneLake to Azure Databricks – Unity Catalog connections to OneLake, secured via Managed Identities from Microsoft Entra ID, allow Databricks to query OneLake data items as a native catalog without data duplication. Fabric Data Factory to Azure Databricks (direct) – Orchestrates ingestion from diverse sources directly into Azure Data Lake Storage (ADLS), where Azure Databricks picks up the data for medallion architecture processing. Design Considerations Area Updated guidance Direct RTI-to-Databricks integration There is still no broad GA direct integration where Fabric RTI and Databricks operate as one native real-time runtime. Integration should be positioned through open protocols, Event Hubs/Kafka-style patterns, OneLake, Delta, and federation. OneLake federation in Azure Databricks OneLake federation in Azure Databricks is now the key integration story. It allows Databricks Unity Catalog to query Fabric Lakehouse and Warehouse data in OneLake without copying it. Access is read-only and depends on Fabric tenant settings, workspace permissions, and Databricks Unity Catalog setup. RTI data availability to Databricks Data ingested through Fabric RTI can be made available to Databricks by landing or exposing the data into OneLake-backed items, especially Lakehouse/Warehouse patterns. Eventhouse data can be made available in OneLake in Delta format through OneLake availability, but Databricks OneLake federation should be validated against the specific Fabric item type and access path. Existing Databricks customers Existing Databricks customers do not need to abandon Databricks. They can use Fabric RTI as the event ingestion, real-time detection, operational alerting, and business action layer, while continuing to use Databricks for engineering, ML, advanced analytics, and Unity Catalog-governed access. Activator and business action Fabric Activator is the cleanest business-user action layer. It can monitor streaming events and trigger Teams messages, email, Power Automate flows, Fabric pipelines, notebooks, Spark jobs, Dataflows, UDFs, and other downstream actions. This is a strong differentiator because it lets business users act on events without waiting for batch analytics. Operations Agents Operations Agents are in preview and should be positioned carefully. They monitor real-time data from Eventhouse or ontology sources, surface insights, recommend actions, and can connect to Activator/Power Automate action paths. They are not simply a pre-ingestion decision engine before data lands anywhere; they work from configured Fabric knowledge/data sources. Before landing in Lakehouse For decisioning before Lakehouse persistence, use Eventstream processing and Activator rules on streams. For AI-assisted operational recommendations, use Operations Agents once the relevant data is available in Eventhouse or ontology. Requirement-Specific Notes Data Ingestion Microsoft Fabric Mirroring currently supports SQL Server, Azure Cosmos DB, and Oracle as source systems. For sources not yet supported by Mirroring—such as Sybase or REST APIs—use Fabric Data Factory pipelines to ensure full coverage across all data systems. Once data is in the landing zone with the correct format, Mirroring’s CDC replication starts automatically and manages the complexity of merging changes (updates, inserts, and deletes) into Delta tables, keeping data in Fabric continuously up to date. Learn more about open mirroring Storage Format and Time Travel OneLake supports Delta tables, enabling schema evolution and time travel across all data stored in the lakehouse. Learn more about OneLake and Delta tables Security Encryption at rest: OneLake automatically encrypts all data at rest using Microsoft-managed keys, compliant with FIPS 140-2 standards. Learn more Encryption in transit: All data in transit is encrypted using TLS 1.2 or higher, securing data movement between Fabric, OneLake, and Azure Databricks. Learn more Data Governance OneLake can be registered and scanned by Microsoft Purview, enabling cataloging of stored metadata and data quality profiling. This protects sensitive information, including PHI and PII, across ingestion and analytics workflows. Learn more about Purview with Fabric Lakehouse Operations and Monitoring Use the Fabric monitor hub to track pipeline health, Spark application performance, and ingestion job status across all Fabric workloads. Learn more about the Fabric monitor hub Scenario Details This architecture applies to any organization that needs to unify streaming and batch data at scale. Common characteristics include: Multiple operational data sources (databases, SaaS applications, event streams) A requirement to process both real-time and historical data in the same platform Governance and compliance requirements for sensitive data (PHI, PII, financial records) Analytics consumers spanning BI (Power BI), data science (Databricks notebooks), and ML workloads Potential Use Cases Healthcare and life sciences – PHI/PII protection via Purview; real-time patient telemetry + batch EHR analytics Financial services – Real-time fraud detection streams + batch regulatory reporting Retail and e-commerce – Streaming clickstream analytics + batch inventory and supply chain processing Energy and utilities – IoT sensor telemetry streaming + batch consumption analytics Next Steps Get started with Microsoft Fabric Mirroring Build an ETL pipeline with Lakeflow Declarative Pipelines Configure Unity Catalog with OneLake shortcuts Monitor Fabric pipelines with the Fabric monitor hub662Views1like0CommentsOperations Context for AI | Ontology in Fabric IQ
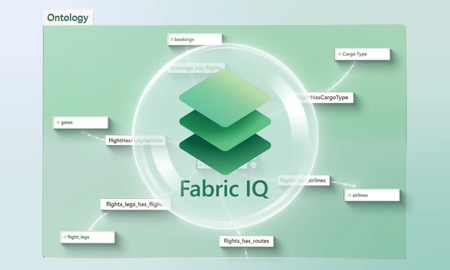
Generate a full business ontology from an existing Power BI semantic model, map entities and relationships, and embed real-time operational signals alongside business rules that live inside the ontology with the data and its meaning. From there, trace cascading operational impacts across your business through the relationship graph, stand up Operations Agents in natural language with Teams-based actions, and connect the same ontology as a knowledge source in Copilot Studio or Azure AI Foundry. Chafia Aouissi, Fabric IQ Principal PM Manager, shares how to model your business operations, embed intelligence in your data, and deploy agents that act on it. Logic lives with your data. Embed business rules directly in the Fabric IQ ontology. Define thresholds, trigger notifications, and cascade decisions through connected entities. Watch the demo. Surface cascading impacts with a single query. Filter the Fabric IQ relationship graph by any entity and trace downstream operational impact across your entire business. Check out a built-in ontology graph in Fabric IQ. Build a Fabric IQ Operations agent in natural language. Define monitoring goals, connect your ontology as its knowledge base, configure Teams actions, & deploy. See the full build. QUICK LINKS: 00:00 — Unify models & data with Fabric IQ 01:12 — Generate an ontology 02:27 — Bring in Power BI reports 03:08 — View across multiple data sources 04:23 — Define rules 05:18 — Built-in ontology graph 06:03 — Fabric IQ agents 08:24 — Fabric IQ as Knowledge Source 08:54 — Wrap up Link References Get started at https://aka.ms/FabricIQ Unfamiliar with Microsoft Mechanics? As Microsoft’s official video series for IT, you can watch and share valuable content and demos of current and upcoming tech from the people who build it at Microsoft. Subscribe to our YouTube: https://www.youtube.com/c/MicrosoftMechanicsSeries Talk with other IT Pros, join us on the Microsoft Tech Community: https://techcommunity.microsoft.com/t5/microsoft-mechanics-blog/bg-p/MicrosoftMechanicsBlog Watch or listen from anywhere, subscribe to our podcast: https://microsoftmechanics.libsyn.com/podcast Keep getting this insider knowledge, join us on social: Follow us on Twitter: https://twitter.com/MSFTMechanics Share knowledge on LinkedIn: https://www.linkedin.com/company/microsoft-mechanics/ Enjoy us on Instagram: https://www.instagram.com/msftmechanics/ Loosen up with us on TikTok: https://www.tiktok.com/@msftmechanics Video Transcript: -The agents you build and use need the right operational context of how your business runs to deliver the best outcomes. Today, that context is often fragmented across systems, defined differently by different teams, or buried in dashboards and logic, making outcomes inconsistent and agent behavior hard to predict. That’s where Microsoft Fabric IQ comes in. Fabric IQ introduces a semantic foundation that unifies models and data through an ontology. It defines the shared business entities and their relationships, and connects them to your data. It provides the operational context needed to understand how the business actually runs, without altering any underlying data. Analysts can not only work with the data they already trust, but also model how the business works. And agents can use that same shared context to reason and act more consistently. Today, I’ll show you both sides. -First, how a data analyst leverages Fabric IQ inside a Fabric workspace, using ontology to model the business concepts. Then, how Fabric IQ uses the same context to drive more reliable and predictable insights from agents. I’ll start from the point of view of an analyst looking to create a full fidelity view of how an airline operates, including processes such as ticketing, maintenance, and more. The first thing I need to do is to create a new ontology. I can either build one from scratch, or jumpstart by using an existing Power BI semantic model. As you see here, there’s a new option to generate an ontology from this semantic model. I just need to choose the workspace, give it a name. I’ll choose AirlineOperationsOntology. Then confirm by hitting Create. In just a few clicks, I’m able to see the different entities of our airline business. All data is now linked not only through keys, but also business relationships and semantics. We can see flights, airlines, routes, and more. If I click into airports, because Fabric IQ is semantically aware of the relationships between entities, it shows the routes connected to runways which are in turn connected to airports. -And for any entity, I can choose to add more live operational signals. In this case, I want to add details about the runway conditions using real-time data, including contamination, visual range for visibility, as well as the available cleared width and more. And you can also bring in your Power BI reports for a canonical view of how to monitor and manage these aircrafts. From the ontology, I’ll head over to the Report links tab that opens the OneLake catalog with all of my reports. I’ll search for air and there are three matching reports for gates, ground service, plus safety and runway. So I’ll add them and hit Connect to confirm. -So, in just a few clicks, we’ve expanded our ontology with the live operational view, using real-time signal, geospatial data, and more. Now, as an analyst, I can work immediately with it, and our agents can act on it as well. Let’s fast‑forward and see what I’ve unlocked. You can see that I now have a richer view over my data, which is connected to real‑world operations. We’re no longer optimizing one report or one dataset at a time. We’re looking at our operations across multiple data sources, in the language of our business, with meaning and relationships already understood. -Now let me show you how this makes it easier to turn insights into concrete decisions and actions. First, in the flight entity type overview, I can see how it relates to my other business processes. I see entities like bookings, gates, airlines, and more as a graph. I have links to all of my connected Power BI reports. There is a real-time weather data, including wind knots, as well as geo-spatial insights showing all of my flights. Using Fabric Maps, I have a fleet level view of all my active flights, and I can see live air traffic across the fleet. This, in fact, is a heat map view of three New York City area airports, and we can see that JFK in this case is impacted with lots of runway activity. -I can now understand the system as a whole, across bookings, flights, airports, and real‑time conditions. And I can drill in further to understand what is going on: I have opened the runways entity, and you’ll remember some of these categories from before. Since there’s snow in the area, I can immediately see the runway conditions that affect operations, things like surface friction and contamination levels, so I understand how safe it is for planes to take off and land. -Beyond connecting raw data, I can also define rules directly in the ontology, so this logic lives with the data and its business meaning, instead of being hard coded somewhere else. In this case, I’ll add a rule that says if runway contamination exceeds high threshold value of 25%, notify the passengers proactively of upcoming delays. We’ll also notify the ground crew, so they know that the runways need to be cleared. The rules are now embedded in the ontology, and the value comes from seeing how runway conditions impact the rest of the operations. That’s where the built‑in ontology graph helps. Let’s look at the relationship graph. I’ll expand the graph view. And add a filter for JFK airport Then run the query. No code needed here. And I get a filtered view for JFK. And immediately, I can see a poor condition that’s affecting Runway 25R. -From that insight, it’s easy to see the downstream impact. This runway issue is already affecting related gates and baggage operations that will need to be rescheduled. This is a unified view of our entire operations and how connected events will cascade across related business entities. This is how ontology helps you as an analyst. But remember, the same operational context is also available to AI agents, no matter how you build them. -Let me demonstrate this in the context of one our built-in Fabric IQ agents. From the New Item catalog, you can find the built-in agents by searching for agent. There is a Data agent designed to answer questions, and an Operations agent designed for real-time data and business action recommendations. The Operations agent is a perfect fit for our airline operations scenario, so I’ll choose that one. I want this agent to help with runway-related analysis and actions, so I’ll name it RunwayConditionsAgent, leave the location, and create it. -From there, I can add a bit more information to set up the agent, like adding the business goals for what it should accomplish I want this one to monitor surface conditions for runways and ensure things run smoothly based on logic like we used before. In fact, in the Agent instructions, using natural language, no code, I’ll describe that if surface contamination is reported above 10%, send ground crews to take care of it. Likewise, the clear width should be more than 25 meters, and the agent should send ground crew to visually assess whether planes can safely brake. -Now let’s add some knowledge. And for that, I’ll choose our AirlineOntology. And here’s where I can add actions. I’ll add one to assign ground crew for clearing, along with description for what needs to be done. Then I’ll give it the Runway ID as the one to clear and the Temperature to predict the type of clearing needed. And Create to add that one. Now I’ll add another for requesting visual assessment, and perform similar steps for the parameters. These will send status updates in Microsoft Teams. Now everything is defined and ready. I just need to save this new agent. That takes a moment. And once it’s finished, it creates a nice agent playbook with what it’s designed to do. -Now, with the agent running, the right people will get notified of what to do in Microsoft Teams Here, I’m looking at the Operations agent It’s alerting us that Runway 29L has only 22 meters of clear path. This is under our 25 meter threshold. It recommends to deploy the ground crew for a runway clearance operation. As the human in the loop, I can choose whether or not to proceed with the recommendation. I’ll do that. -Then it asks to confirm a few details. They look good, so I’ll confirm, and the ground crew is on its way. And here is the good news. If you’re building your own agent in Microsoft Copilot Studio or using Microsoft Foundry, Fabric IQ ontology will be an integrated knowledge source that you will be able to choose from. As you choose your knowledge types, you can select Fabric IQ. This will ground agents in the same semantic foundation that already runs your operations. And of course, the agents you build and connect to Fabric IQ will respect the permissions and security policies you already use in Fabric today. -As I have shown, Microsoft Fabric IQ gives agents shared understanding, with entities, relationships, rules, and actions so they can move from insight to decision more reliably. To learn more and get started, check out aka.ms/FabricIQ. Keep watching Microsoft Mechanics for the latest news and deep dives. And thank you for watching.512Views0likes0CommentsGeneral Availability Refresh: Mirroring Azure Database for PostgreSQL in Microsoft Fabric
Introduction We are excited to announce the General Availability Refresh of Mirroring Azure Database for PostgreSQL in Microsoft Fabric. This update introduces several new capabilities designed to reduce friction, improve transparency, and increase trust in PostgreSQL data for analytics and AI workloads. Database professionals, DBAs, and developers can now leverage a more robust, flexible, and transparent solution for integrating PostgreSQL data in Microsoft Fabric. Mirroring Azure Database for PostgreSQL enables seamless integration of transactional data into Microsoft Fabric, supporting advanced analytics and AI scenarios. Previously, users faced limitations in data type support, operational requirements, and troubleshooting transparency. The General Availability Refresh directly addresses these challenges, delivering a more reliable and user-friendly experience. Native Data Type Support One of the most significant enhancements is support for PostgreSQL native data types, including JSON and JSONB. Users can now mirror complex, semi-structured data without conversion, preserving the full fidelity of source data. Additionally, transparent replication to varchar(max) or varbinary is now supported, ensuring that even custom or less common types can be accurately mirrored in Fabric. Previously, data type limitations often required workarounds or manual transformations, introducing complexity and risk. With this update, data flows more naturally from PostgreSQL to Fabric, streamlining analytics and AI pipelines and reducing the time spent on data preparation. Mirroring now preserves PostgreSQL-native types—including JSON and JSONB—without requiring schema transformations or type coercion. This ensures: Full fidelity replication of semi-structured data Elimination of intermediate serialization (e.g., string encoding) Tables containing JSON/JSONB columns are mirrored into Fabric with their structure intact, enabling: Direct querying of nested JSON fields Consistent schema representation across source and analytical layers Once mirrored, JSON content can be queried natively within Fabric workloads, allowing: Hybrid analytical scenarios (relational + semi-structured) Use of familiar SQL patterns for JSON traversal and extraction Flexible Server High Availability Support for PG versions earlier than 17 The refresh expands support for Azure Database for PostgreSQL Flexible Server with high availability enabled on versions earlier than 17. This means organizations can leverage mirroring with HA configurations without needing to upgrade their database engine, improving operational flexibility and minimizing disruption. In the past, mirroring required specific PostgreSQL versions, limiting adoption for organizations with established HA deployments. Now, the broader compatibility allows teams to maintain their preferred configurations and benefit from seamless data integration in Fabric. Improved Transparency: Enhanced Error Messaging and Dedicated PostgreSQL UDFs Transparency is critical for troubleshooting and maintaining trust in data pipelines. The General Availability Refresh introduces enhanced error messaging, providing clear and actionable insights into replication issues. Dedicated PostgreSQL user-defined functions (UDFs) further support monitoring and diagnostics, enabling users to quickly identify and resolve problems. --Validates that all system and configuration requirements are met before starting CDC mirroring. SELECT * FROM azure_cdc.check_prerequisites(); -- Quickly verify which extension version is deployed — critical for troubleshooting SELECT azure_cdc.azure_cdc_version(); -- Returns a detailed list of errors and issues detected during CDC operations SELECT * FROM azure_cdc.get_health_status('', ''); -- Scans every eligible user table in the database and returns the mirroring readiness status for each SELECT * FROM azure_cdc.get_all_tables_mirror_status(); These features streamline troubleshooting, reduce downtime, and empower teams to maintain robust mirroring operations. The improvements are a substantial step forward from previous releases, which offered limited visibility into replication health and errors. Unblocking Mirroring for servers with Read Replica enables We also removed existing block for creating Mirrored databases on Flexible Servers with Read Replicas created. Now primary servers with one or more Read Replicas can serve as source for Mirroring their databases in Fabric with no limitations. Conclusion The new capabilities significantly reduce friction for analytics and AI workloads in Microsoft Fabric. By removing technical barriers and increasing operational simplicity, the General Availability Refresh empowers organizations to unlock the full potential of their PostgreSQL data for advanced analytics and AI applications. The General Availability Refresh of Mirroring Azure Database for PostgreSQL in Microsoft Fabric delivers critical enhancements: native data type support, expanded Flexible Server HA compatibility, replication identity improvements, and better transparency. Together, these features make mirroring more robust, flexible, and trustworthy for analytics and AI workloads. We encourage technical professionals, DBAs, and developers to adopt these new capabilities and explore how they can transform data integration in Microsoft Fabric. For more information, visit the official documentation and resources: Azure Database for PostgreSQL Documentation Microsoft Fabric Documentation529Views1like1CommentStep by Step Guide to Ontology and Plan for Financial Service
What We Will Build In this guide, we will construct a complete Fabric IQ solution that accomplishes the following: First, a Lakehouse that ingests publicly available data including bank financials, P2P lending statistics, borrower demographics, and licensing information. Second, a Semantic Model that defines the analytical layer with proper dimensions, measures, and relationships. Third, an Ontology that elevates these tables into business entities such as Bank, P2P Platform, Borrower, and Loan, connected by meaningful relationships and governed by regulatory rules. Fourth, a Planning sheet that enables supervisors to forecast enforcement workloads, allocate examination budgets, and model scenarios based on live data. Step 1: Preparing the Data Foundation in Fabric Lakehouse Every Fabric IQ solution begins with data. Before we can model business semantics or build planning sheets, we need a well structured Lakehouse that holds our source data in a governed and queryable format. Creating the Lakehouse Navigate to your Fabric workspace and create a new Lakehouse. In this example, we have named it P2PLendingLH, housed within the workspace P2P Lending CrossSector Demo. The Lakehouse serves as the Bronze and Silver layer of our medallion architecture, storing both raw ingested data and transformed analytical tables. Data Sources and Tables The Lakehouse is populated with data from publicly available publications. The table structure follows a dimensional modeling pattern with clear separation between dimension tables (prefixed with dim_) and relationship tables (prefixed with rel_). The following tables form the foundation of our model: Table Name Description dim_bank Bank profiles including KBMI tier, total assets, CAR, NPL, channeling exposure percentage dim_borrower Borrower demographics with credit score, employment type, province, and risk segment dim_p2p_platform Licensed P2P lending operators with TWP90 rate, outstanding balance, and total borrowers dim_loan Individual loan records with amount, tenure, interest rate, and repayment status dim_supervisor_team supervisory teams and their regional assignments dim_channeling_agreement Bank to P2P channeling contracts and exposure limits In addition to dimension tables, several relationship tables capture the connections between entities. These include rel_bank_channels_platform (which bank funds which P2P platform), rel_borrower_takes_loan (linking borrowers to their loans), rel_loan_funded_by_bank (tracing the funding chain), rel_platform_issues_loan (connecting platforms to the loans they originate), and rel_supervisor_oversees_platform and rel_supervisor_oversees_bank (mapping supervisory responsibility). Step 2: Creating the Semantic Model With data in the Lakehouse, the next step is to create a Semantic Model that defines the analytical interface. The Semantic Model is a Power BI construct that organizes your tables into a star schema with proper relationships, hierarchies, and measures. More importantly for our purpose, this Semantic Model will later serve as the blueprint from which we generate our Ontology. Generating the Model from Lakehouse From within the Lakehouse, click on "New semantic model" in the toolbar. A dialog appears allowing you to name your model and select which tables to include. In our case, we select all dimension and relationship tables to ensure the Ontology will have full visibility into the data landscape. Figure 1. Creating a new Direct Lake semantic model from the P2PLendingLH Lakehouse, selecting dimension and relationship tables for inclusion. Notice that the dialog shows the workspace name (P2P Lending CrossSector Demo) and provides a searchable list of all available tables. The Direct Lake mode is automatically selected, which means the Semantic Model will query data directly from the Lakehouse parquet files without importing a copy. This is important for our use case because it ensures that when regulator publishes updated monthly statistics and the Lakehouse is refreshed, the Semantic Model and subsequently the Ontology will reflect the latest data. Configuring Relationships and Properties After creation, the Semantic Model opens in the editing view where you can configure relationships, add calculated measures, and define display properties. The model view shows the entity cards with their fields and the lines connecting related tables. Figure 2. The Semantic Model editor showing entity cards for dim_bank and dim_borrower, with relationship lines and the full table listing in the Data panel. In the screenshot above, you can see two of the core dimension tables. The dim_bank table contains fields such as bank_id, bank_type, channeling_exposure_pct, channeling_total, name, regulator_team, and total_assets. The dim_borrower table holds borrower_id, credit_score, employment_type, name, province, and risk_segment. The Data panel on the right reveals the complete set of tables available in this model, including all the relationship tables that define the connections between entities. At this stage, you should verify that all necessary relationships are correctly established. For example, dim_bank should connect to rel_bank_channels_platform through bank_id, and dim_p2p_platform should connect to rel_platform_issues_loan through platform_id. These relationships are what enable the Ontology to reason across domains in the next step. You may also want to add calculated measures at this point, such as a weighted average TWP90 across all platforms funded by a specific bank, or a total channeling exposure as a percentage of the bank's total assets. These measures will be carried forward into the Ontology and can be used by AI agents for natural language querying. Step 3: Generating the Ontology This is the step where the magic of Fabric IQ truly comes alive. The Ontology transforms your Semantic Model from a reporting layer into an intelligence layer. While the Semantic Model answers the question "what does the data look like," the Ontology answers the question "what does the data mean." What the Ontology Does An Ontology in Fabric IQ is a machine understandable vocabulary of your business. It consists of entity types (the things in your environment, such as Bank, Borrower, or P2P Platform), properties (the facts about those entities, such as a bank's NPL ratio or a platform's TWP90 rate), and relationships (the ways entities connect, such as a Bank channels funding to a P2P Platform). Beyond static modeling, the Ontology also supports rules and constraints that can trigger automated actions when business conditions are met. Generating from the Semantic Model To create the Ontology, open your Semantic Model and look for the "Generate Ontology" button in the toolbar. Clicking it opens the generation dialog, which presents three key value propositions: Unify models into a semantic layer allows you to align concepts across domains and modeling paradigms, bringing banking data and P2P lending data into a shared vocabulary. Model expressively enables you to capture complex relationships, domain specific rules, and actions that drive business workflows, such as triggering an alert when a P2P platform's TWP90 crosses the 5 percent regulatory threshold. Reason over events and temporal patterns means that the Ontology can use sequences and trends to inform decisions and automation, such as detecting three consecutive months of TWP90 deterioration. Figure 3. The Ontology generation dialog, creating a new Ontology named NewP2P from the existing Semantic Model within the P2P Lending CrossSector Demo workspace. In the dialog, you specify the workspace (P2P Lending CrossSector Demo) and give your Ontology a name (in this example, NewP2P). After clicking Create, Fabric IQ analyzes the Semantic Model's structure, identifies entity types from dimension tables, infers relationships from the foreign key connections, and generates a navigable graph that represents your business domain. Enriching the Ontology with Rules Once the Ontology is generated, you can enrich it with business rules that reflect regulatory requirements. For the P2P lending use case, the following rules are particularly relevant: Rule Name Condition Action Elevated TWP90 P2P Platform TWP90 exceeds 5 percent Flag platform as high risk and alert PVML supervisor Contagion Risk Bank channeling exposure to flagged P2P platform exceeds 10 percent of portfolio Alert Banking supervisor and recommend joint examination Youth Overleveraged Borrowers aged 19 to 34 represent more than 60 percent of a platform's portfolio AND TWP90 is above average Trigger consumer protection review and education program allocation CAR Threshold Bank CAR drops below 10 percent while having active P2P channeling agreements Escalate to Kepala Eksekutif Pengawas Perbankan These rules integrate with Fabric Activator, enabling the Ontology to automatically initiate business processes through alerts and automated actions. This means that when new monthly P2P statistics are ingested and a platform's TWP90 crosses the threshold, the system does not wait for an analyst to discover it manually. The rule fires, the alert is sent, and the supervisory workflow begins. Querying with Natural Language One of the most powerful capabilities enabled by the Ontology is the ability to query across domains using natural language through a Data Agent. Because the Ontology defines the business vocabulary and binds it to real data, a supervisor can ask questions like: "Which banks have channeling agreements with P2P platforms whose TWP90 is currently above 5 percent, and what is their total exposure?" The Data Agent resolves this query by traversing the Ontology graph: from the Bank entity through the channels_funding_to relationship to P2P Platform, filtering by the TWP90 property, and aggregating the channeling_total measure. Step 4: Setting Up Planning Sheets While the Ontology tells you what is happening in your business right now, the Plan item in Fabric IQ helps you decide what should happen next. Planning in Fabric IQ brings budgeting, forecasting, and scenario modeling directly into the same environment where your data lives, eliminating the disconnect between analytical insights and forward looking decisions. Creating a Planning Sheet To create a Plan, navigate to your workspace and select New Item followed by Plan (preview). After naming the plan and connecting it to your Semantic Model, you can begin building Planning sheets that pull dimensions and measures directly from the same data that powers your Ontology. In the screenshot below, we see a Planning sheet named "Planning P2P" that presents a tabular view of all P2P lending platforms alongside their key risk metrics. Figure 4. The Planning sheet showing P2P lending platforms with their TWP90 rates, total outstanding balances (in trillions of Rupiah), total borrower counts (in thousands), and risk categories. The Planning sheet is structured with the platform name and risk_category as row dimensions, and three critical measures as values: Sum of twp90_rate, Sum of total_outstanding (displayed in trillions of Rupiah), and Sum of total_borrowers (displayed in thousands). The risk_category column provides an immediate visual classification of each platform's health status, with categories such as Elevated and Very High clearly indicating where supervisory attention should be directed. Looking at the data, several insights emerge immediately. DanaBijak and DanaCepat both carry a Very High risk category, with TWP90 rates of 18.77 and 17.79 respectively. CashWagon ID shows an Elevated risk designation despite a comparatively modest TWP90 of 8.26, likely due to its substantial outstanding balance of 144.97 thousand borrowers. The aggregate row at the top reveals the industry total: a combined TWP90 of 365.38 (this is a sum across all platforms), total outstanding of 29.86 trillion Rupiah, and 7,281.55 thousand borrowers across the monitored universe. Using Planning for Supervisory Resource Allocation The real power of the Planning sheet becomes apparent when supervisors begin using it for forward looking decisions. Consider the following scenarios that can be modeled directly within the Planning interface: Enforcement Forecasting: Based on the current data showing multiple platforms in the Very High risk category, supervisors can forecast the expected volume of warning letters and administrative sanctions for the coming quarter. If historical patterns show that each Very High platform typically receives two to three rounds of correspondence before resolution, the planning sheet can project staffing requirements for the enforcement team. Budget Allocation: The Planning sheet can incorporate budget dimensions alongside risk metrics. If the current quarterly examination budget allows for on site visits to 15 platforms, the risk category column helps prioritize which platforms should be visited first. The forecast capability can then project whether the budget is sufficient given the current risk trajectory, or whether a reallocation request should be submitted.719Views0likes1CommentMicrosoft Fabric Operations Agent Step by Step Walkthrough
Fabric Capacity and Workspace You need a Microsoft Fabric workspace backed by a paid capacity. Trial capacities are not supported for Operations Agent. Your capacity must be provisioned in a supported region. As of April 2026, Operations Agent is available in all Microsoft Fabric regions except South Central US and East US. If your capacity is outside the US or EU, you will also need to enable cross geo processing and storage for AI through the tenant settings. Your workspace must contain an Eventhouse with at least one KQL database. The Eventhouse is the telemetry backbone, and the KQL database holds the tables the agent will monitor. In the screenshot below, you can see a workspace named OperationAgent-WS that contains an Eventhouse (ops_eventhouse), two KQL databases (ops_db and ops_eventhouse), and a Lakehouse (ops_lakehouse). This is the environment used throughout this guide. Figure 1. Workspace contents showing the Eventhouse, KQL databases, and Lakehouse ready for the Operations Agent. Enabling the Operations Agent in the Admin Portal A Fabric administrator must enable the Operations Agent preview toggle in the Admin Portal before anyone in the organization can create an agent. Navigate to the Admin Portal, locate the section for Real Time Intelligence, and find the setting labeled Enable Operations Agents (Preview). Toggle it to Enabled for the entire organization or for specific security groups depending on your governance requirements. In addition to this toggle, ensure that Microsoft Copilot and Azure OpenAI Service are also enabled at the tenant level. The Operations Agent relies on Azure OpenAI to generate its playbook and to reason about data when conditions are met. Figure 2. The Admin Portal showing the Enable Operations Agents (Preview) toggle set to Enabled for the entire organization. Note that messages sent to Operations Agents are processed through the Azure AI Bot Service. If your capacity is outside the EU Data Boundary, data may be processed outside your geographic or national cloud boundary. Be sure to communicate this to your compliance stakeholders before enabling the feature in production tenants. Microsoft Teams Account Every person who will receive recommendations from the agent must have a Microsoft Teams account. The Operations Agent delivers its findings and action suggestions through a dedicated Teams app called Fabric Operations Agent. You can install this app from the Teams app store by searching for its name. Once installed, the agent will be able to send messages containing data summaries and recommended actions directly to the designated recipients. Creating and Configuring the Operations Agent With your prerequisites in place, you are ready to create the Operations Agent. The following steps walk you through the entire configuration process using the Fabric portal. Step 1: Create a New Operations Agent Open the Microsoft Fabric portal and navigate to your workspace. On the Fabric home page, select the ellipsis icon and then select Create. In the Create pane, scroll to the Real Time Intelligence section and select Operations Agent. A dialog will appear asking you to name your agent and select the target workspace. Choose a descriptive name that reflects the agent’s purpose. In this guide, the agent is named OperationsAgent_1 and is deployed to the OperationAgent-WS workspace. Step 2: Define Business Goals and Agent Instructions Once the agent is created, you are taken to the Agent Setup page. This page is divided into two halves. On the left side, you configure the agent’s behavior. On the right side, you see the generated Agent Playbook after saving. The first field is Business Goals, where you describe the high level objective the agent should accomplish. Write this in clear, outcome oriented language. In this demo, the business goal is set to: “Monitor data pipeline execution and alert on failures.” The second field is Agent Instructions, where you provide more specific guidance on how the agent should reason about the data. Think of this as a brief you would hand to an analyst who will be watching your systems overnight. Be explicit about the table name, the column to watch, and the condition that constitutes an alert. In this demo, the instruction reads: “Monitor pipeline_runs table. Alert when status is failed.” Together, the business goals and instructions give the underlying large language model enough context to generate an accurate playbook. The more specific your instructions, the more reliable the agent’s behavior will be. Figure 3. The Agent Setup page showing business goals, agent instructions, and the generated playbook on the right. On the right side of the screen, you can see the Agent Playbook that was generated after saving. The playbook includes a Business Term Glossary, which shows the business objects the agent inferred from your goals and data. In this case, it identified an object called PipelineRun, mapped to the pipeline_runs table, with two properties: status (the pipeline run status from the status column) and runId (the unique identifier from the run_id column). It also displays the Rules section, which contains the conditions the agent will evaluate. Review the playbook carefully. Since it is generated by an AI model, there may be occasional misinterpretations. Verify that every property maps to the correct column and that the rules reflect your intended thresholds. If something is off, update your goals or instructions and save again to regenerate the playbook. Step 3: Add a Knowledge Source Scroll down on the Agent Setup page to find the Knowledge section. This is where you connect the agent to the data it will monitor. When you first open this section, it will display a message indicating that no knowledge source has been added yet. Figure 4. The Knowledge section before any data source has been added. Select the Add Data button to browse the available data sources. A panel will appear listing the KQL databases and Eventhouses accessible within your Fabric environment. In this demo, three sources are available: ops_db in the OperationAgent-WS workspace, wms_eventhouse in the WMS-CDC-Demo workspace, and ops_eventhouse in the OperationAgent-WS workspace. Select the database that contains the table you want the agent to monitor. For this guide, select ops_db, which holds the pipeline_runs table referenced in the agent instructions. Figure 5. Selecting the knowledge source from available KQL databases and Eventhouses. Once the knowledge source is connected, the agent will be able to query this database at regular intervals (approximately every five minutes) to evaluate its rules. Make sure the table in your selected database is actively receiving data, especially if you plan to demonstrate the agent detecting a condition in real time. Step 4: Define Actions Actions are the responses the agent can recommend when it detects a condition that matches its rules. Scroll further down the Agent Setup page to find the Actions section. Select the Add Action button to define a new custom action. A dialog titled New Custom Action will appear. It has three fields. The Action Name is a short, descriptive label for the action. The Action Description explains the purpose of the action and gives the agent context about when to use it. The Parameters section allows you to define input fields that pass dynamic values (such as names, dates, or identifiers) into the Power Automate flow that will be triggered. Figure 6. The New Custom Action dialog where you define the action name, description, and optional parameters. In this demo, the action is named Send Email Alert with a description indicating that it should send an email notification when a pipeline failure is detected. Once created, you can see the action listed in the Actions section with a green status indicator showing that the action is successfully connected. Figure 7. The Actions section showing the Send Email Alert action with a connected status. Step 5: Configure the Custom Action with Power Automate After creating the action, you need to configure it by linking it to an activator item and a Power Automate flow. Select the action you just created to open the Configure Custom Action pane. In this pane, you will see several fields. First, select the Workspace where the activator item resides. In this demo, the workspace is OperationAgent-WS. Next, select the Activator, which is the Fabric item that bridges the Operations Agent and Power Automate. Here, the activator is named Email_Alert_Activator. Once the connection is created, a Connection String is generated. This string is a unique identifier that links the Operations Agent to the Power Automate flow. Select the Copy button to copy this connection string to your clipboard. You will need it in the next step. Below the connection string, you will find the Open Flow Builder button. Select this to launch the Power Automate flow designer where you will build the email notification flow. Figure 8. The Configure Custom Action pane showing the workspace, activator, connection string, and the button to open the flow builder. Step 6: Build the Power Automate Flow When you select Open Flow Builder, a new browser tab opens with the Power Automate designer. The flow is pre-configured with a trigger called When an Activator Rule is Triggered. This trigger fires whenever the Operations Agent approves an action. In the Parameters tab of the trigger, you will see a field labeled Connection String. Paste the connection string you copied from the previous step into this field. This is the critical link that connects the Power Automate flow back to your Operations Agent. If this string is incorrect or missing, the flow will not fire when the agent recommends the action. Figure 9. The Power Automate flow builder with the activator trigger and the Connection String field. Below the trigger, you can add any actions your workflow requires. For an email alert scenario, add an Office 365 Outlook action to send an email to the operations team. You can use dynamic content from the trigger to include details such as the pipeline run ID, the failure status, and any parameters passed through from the Operations Agent. Save the flow and return to the Fabric portal. Your action is now fully configured and ready to be triggered by the agent. Step 7: Generate the Playbook and Start the Agent With all configuration complete (business goals, instructions, knowledge source, and actions), select Save on the Agent Setup page. Fabric will use the underlying large language model to generate the agent’s playbook. The playbook is a structured summary of everything the agent knows: its goals, the properties it monitors, and the rules it evaluates. You can also select Generate Playbook at the top of the page to regenerate the playbook if you have made changes. Review the playbook one final time to confirm that properties map correctly to your table columns and that rules reflect the exact conditions you want to monitor. When you are satisfied, select Start in the toolbar at the top of the page. The agent will begin actively monitoring your data. It queries the knowledge source approximately every five minutes, evaluating the playbook rules against the latest data. If a condition is met, the agent uses the LLM to summarize the data, generate a recommendation, and send a message to the designated recipients through Microsoft Teams. To pause the agent at any time, select Stop. This is useful during demos when you want to control the timing of the demonstration. How the Agent Operates at Runtime Once started, the Operations Agent follows a continuous loop. Every five minutes, it queries the connected KQL database to evaluate the rules defined in the playbook. If no conditions are met, it continues silently. If a condition is matched (for example, a pipeline run with a status of "failed" appears in the pipeline_runs table), the agent proceeds through the following sequence. First, the agent uses the large language model to analyze the data that triggered the condition. It summarizes the context, identifies the relevant business object (such as a specific pipeline run), and determines which action to recommend. Second, the agent sends a message to the designated recipients through Microsoft Teams. This message contains a summary of the detected insight, the data context that triggered it, and a suggested action. Recipients can approve the action by selecting Yes or reject it by selecting No. If parameters are included (such as a run ID or a severity level), they can be reviewed and adjusted before final approval. Third, if the recipient approves the action, the agent executes it on behalf of the creator using the creator’s credentials. In this demo, approving the action would trigger the Power Automate flow that sends an email alert. It is important to note that if a recommendation is not responded to within three days, the operation is automatically canceled. After cancellation, the action can no longer be approved or interacted with.889Views1like1CommentAnnouncing Fabric Mirroring integration for Azure Database for MySQL - Public Preview at FabCon 2026
At FabCon 2026, we’re excited to announce the Public Preview of Microsoft Fabric Mirroring integration for Azure Database for MySQL. This integration makes it easier than ever to analyze MySQL operational data using Fabric’s unified analytics platform, without building or maintaining ETL pipelines. This milestone brings near real-time data replication from Azure Database for MySQL into Microsoft Fabric OneLake, unlocking powerful analytics, reporting, and AI scenarios while keeping transactional workloads isolated and performant. Why Fabric integration for Azure Database for MySQL? MySQL is widely used to power business‑critical applications, but operational databases aren’t optimized for analytics. Traditionally, teams rely on complex ETL pipelines, custom connectors, or batch exports — adding cost, latency, and operational overhead. With Fabric integration, Azure Database for MySQL now connects directly to Microsoft Fabric, enabling: Zero‑ETL analytics on MySQL operational data Near real-time synchronization into OneLake Analytics‑ready open formats for BI, data engineering, and AI A unified experience across Power BI, Lakehouse, Warehousing, and notebooks All without impacting your production workloads. What’s new in the Public Preview? The Public Preview introduces a first‑class integration between Azure Database for MySQL and Microsoft Fabric, designed for simplicity and scale. It introduces a solid set of core operational and enterprise‑readiness capabilities, enabling end-users to confidently get started and scale their analytics scenarios. Core replication operations Start, monitor, and stop replication directly from the integrated experience Support for both initial data load and continuous change data capture (CDC) to keep data in sync with minimal latency. Network and security Firewall and gateway support, enabling replication from secured MySQL environments. Support for Azure Database for MySQL servers configured with customer‑managed keys (BYOK), aligning with enterprise security and compliance requirements. Broader data coverage and troubleshooting Ability to mirror tables containing previously unsupported data types, expanding schema compatibility and reducing onboarding friction. Support for up to 1,000 tables per server, enabling larger and more complex databases to participate in Fabric analytics. Basic error messaging and visibility to help identify replication issues and monitor progress during setup and ongoing operations. What scenarios does it unlock? With Fabric integration in place, you can now analyze data in Azure Database for MySQL without impacting production, combine it with other data in Fabric for richer reporting, and use Fabric’s built‑in analytics and AI tools to get insights faster. Learn more about exploring replicated data in Fabric in Explore data in your mirrored database using Microsoft Fabric. How does it work (high level)? Fabric integration for Azure Database for MySQL follows a simple but powerful pattern: Enable and Configure - Enable replication in the Azure portal, then use the Fabric portal to provide connection details and select MySQL tables to mirror. Initial snapshot - Fabric takes a bulk snapshot of the selected tables, converts the data to Parquet, and writes it to a Fabric landing zone. Continuous change capture - Ongoing inserts, updates, and deletes are captured from MySQL binlogs and continuously written as incremental Parquet files. Analytics‑ready in Fabric - The Fabric Replicator processes snapshot and change files and applies them to Delta tables in OneLake, keeping data in sync and ready for analytics. This design ensures low overhead on the source, while providing fresh data for analytics and AI workloads. Below is a more detailed workflow illustrating how this works: Getting started with the Public Preview To try Fabric integration for Azure Database for MySQL during Public Preview, you’ll need: An Azure Database for MySQL instance An active Microsoft Fabric capacity (trial or paid) Access to a Fabric workspace Once enabled, you can select the MySQL databases and tables you want to replicate and begin analyzing data in Fabric. For step-by-step tutorial, please refer to - https://learn.microsoft.com/azure/mysql/integration/fabric-mirroring-mysql The demo video below showcases how the mirroring integration works and walks through the end-to-end experience of mirroring MySQL data into Microsoft Fabric. Stay Connected We’re thrilled to share this milestone at FabCon 2026 and can’t wait to see how you use Fabric integration for Azure Database for MySQL to simplify analytics and unlock new insights. We welcome your feedback and invite you to share your experiences or suggestions at AskAzureDBforMySQL@service.microsoft.com Try the Public Preview, share your feedback, and help shape what’s next. Thank you for choosing Azure Database for MySQL!Smart Pipelines Orchestration: Designing Predictable Data Platforms on Shared Spark
Introduction In mature data platforms, scaling compute is rarely the primary challenge. Shared, elastic Spark pools already provide sufficient processing capacity for most workloads. The harder problem is achieving predictable execution when multiple pipelines compete for the same resources. In Azure Synapse, Spark pools are commonly shared across pipelines to optimize cost and utilization. While this model is efficient, it introduces a key limitation: execution order is determined by scheduling behavior, not business priority. This post describes an orchestration pattern that makes priority explicit, allowing critical workloads to run predictably on shared Spark compute without modifying Spark code, configuration, or cluster capacity. Goal This work does not aim to optimize Spark performance. Its goal is to ensure that, when pipelines share a Spark pool: latency-sensitive workloads run first heavy backfills do not delay critical pipelines execution order is deterministic under contention All of this needed to be achieved without changes to Spark configuration, notebook logic, or cluster size. Why This Problem Occurs In a naïve orchestration model, pipelines are triggered in parallel. From Spark’s perspective: all jobs are equivalent all jobs attempt to acquire executors at the same time scheduling decisions are based on availability and timing As a result, priority is implicit and often incorrect. A heavy workload may acquire executors before a lightweight but critical one simply because it requests more resources earlier. This behavior is expected from Spark. The issue lies in orchestration, not in compute. Core Concept: Priority as Execution Ordering In shared Spark platforms, priority is enforced through execution ordering, not compute tuning. The orchestration layer controls when workloads are admitted to shared compute. Once execution begins, Spark processes each workload normally. This preserves Spark’s execution model while providing deterministic workload ordering. Step 1: Workload Classification In the demo presented in this blog, workloads are classified during configuration based on business impact: Category Description Priority example Light (critical) SLA sensitive dashboard and downstream consumers High priority , low resource weight(data volume) Medium (High) Core reporting workloads Medium priority Heavy(Best Effort) Backfills and historical computes Low priority, high resource weight(data volume) This classification is external to Spark and external to code. It represents business intent, not implementation. As a future phase, classification can be automated,for example, an agent may adjust priority based on observed failure rates or execution stability. Workload classification is expressed as orchestration metadata, for example: [ {"name":"ExecDashboard","pipeline":"PL_Light_ExecDashboard","weight":1,"tier":"Critical"}, {"name":"FinanceReporting","pipeline":"PL_Medium_FinanceReporting","weight":3,"tier":"High"}, {"name":"Backfill","pipeline":"PL_Heavy_Backfill","weight":8,"tier":"BestEffort"} ] What Runs in Each Workload Category All pipelines execute on the same shared Spark pool, but the work they perform differs in scope, data volume, and sensitivity to contention. Light workloads power SLA-sensitive dashboards and downstream consumers. Their notebooks perform targeted reads with strong filtering, limited joins, and small aggregations. Execution time is short, and overall pipeline duration is dominated by executor availability rather than computation. Medium workloads represent core reporting and analytics logic. These notebooks process larger datasets, perform joins across multiple sources, and apply aggregations that are more expensive than Light workloads but still time-bounded and business-critical. Heavy workloads are best-effort pipelines such as backfills and historical recomputation. Their notebooks scan large data volumes, apply expensive transformations, and are optimized for throughput rather than responsiveness. These workloads tolerate delay but place significant pressure on shared compute when admitted concurrently. All workloads use the same Spark pool, executor configuration, and runtime. The distinction reflects business intent and execution characteristics, not Spark tuning. Example notebooks for each category are available in the accompanying GitHub repository. Step 2: Naïve Orchestration (Baseline) The following pipeline run illustrates the baseline behavior when all workloads are triggered in parallel against a shared Spark pool. All Light, Medium, and Heavy pipelines are admitted concurrently. Executor acquisition and execution order depend on timing rather than business priority, resulting in non-deterministic behavior under contention. Although Light workloads require minimal compute, they are delayed by executor contention caused by Medium and Heavy pipelines entering the Spark pool at the same time. Step 3: Smart Orchestration (Priority-Aware) Orchestration Model The same child pipelines and notebooks are reused. The parent pipeline enforces admission order: Light (Critical) Medium (High) Heavy (Best Effort) Dependencies control admission to the Spark pool. Parallelism is preserved within a priority class. Effect on Shared Spark Light workloads enter the Spark pool without contention Medium workloads run after Light completes Heavy workloads are intentionally delayed Executor acquisition aligns with business priority Light pipelines execute first and complete before medium pipelines are admitted. Heavy workloads run last by design. No Spark configuration changes are introduced. The Spark pool, notebooks, and executor configuration are identical to the naïve run. Only the orchestration graph differs. Step 4: Impact on Light Workloads Light workloads are particularly sensitive to orchestration because their runtime is dominated by queueing time, not computation. Comparing the naïve and priority-aware runs shows that Spark execution time is unchanged, but pipeline duration improves due to earlier admission to the Spark pool and immediate executor access Naïve Execution Spark execution time: short and unchanged Pipeline duration: minutes under contention Delay caused by executor unavailability Smart Execution Spark execution time: unchanged Pipeline duration closely matches compute time Immediate access to executors The improvement comes from removing admission contention, not from increasing resources. Results and Performance Compared to naïve orchestration, priority-aware orchestration ensures that Light workloads complete in minutes rather than tens of minutes under contention, while Spark execution time itself remains unchanged. Heavy workloads no longer delay latency-sensitive pipelines, and execution order is deterministic across runs. These improvements are achieved solely by controlling admission to the shared Spark pool, without modifying Spark configuration, notebook logic, or cluster capacity. Next Steps: 1. Optimizing Heavy Workloads Once heavy workloads are isolated by priority, they can be optimized independently: retries with backoff tolerance for transient failures increased executor counts or larger pools Without admission control, these optimizations increase contention, with smart orchestration, they do not impact critical pipelines. 2. Moving Beyond Static Classification In this implementation, workload classification is static and configuration-driven, which is sufficient for stabilization. A next phase is adaptive classification: collect execution metrics and failure rates detect unstable pipelines reclassify pipelines that exceed thresholds (e.g., >20% failures in a rolling window) This prevents unstable workloads from impacting critical execution paths and makes the pipeline reliable with minimal maintenance. 3. Assisted Classification with Copilot agent At scale, priority decisions benefit from automation. A Copilot-style agent can use historical execution data to recommend classification changes, grounding decisions in observed behavior while keeping engineers in control. Example: Changing workload classification from Light to Medium Consider a pipeline initially classified as Light because it powers an SLA-sensitive dashboard and typically executes quickly with minimal resource usage. Over time, execution telemetry shows a change in behavior: The pipeline fails in 4 of the last 10 runs due to transient Spark errors Average duration has increased by 3×, even when admitted early Retry attempts amplify contention for other Light workloads Based on these signals, an automated agent flags the workload as unstable and recommends reclassifying it from Light to Medium. After reclassification: The pipeline is admitted after Light workloads but before Heavy workloads It no longer blocks latency-critical paths when retries occur Execution remains predictable, while instability is isolated from critical workloads The notebook logic and Spark configuration remain unchanged, only the workload’s admission priority is updated via orchestration metadata. This approach allows the platform to adapt to changing workload characteristics while preserving deterministic execution for critical pipelines. Conclusion Parallel execution is a default, not a strategy. In shared environments, orchestration must explicitly encode business intent rather than relying on scheduler behavior. Enforcing priority at the orchestration layer restores predictability without sacrificing efficiency and provides a foundation for adaptive, policy-driven execution as platforms evolve. Links Orchestrating data movement and transformation in Azure Data Factory - Training | Microsoft Learn How to Optimize Spark Jobs for Maximum Performance: A Complete Guide GitHub repo for notebook reference: sallydabbahmsft/Smart-pipelines-orchestration Feedback: Sally Dabbah | LinkedIn756Views2likes2Comments