microsoft fabric
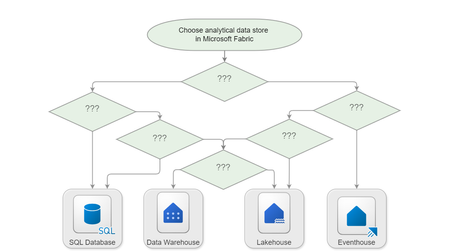
95 TopicsDecision Guide for Selecting an Analytical Data Store in Microsoft Fabric
Learn how to select an analytical data store in Microsoft Fabric based on your workload's data volumes, data type requirements, compute engine preferences, data ingestion patterns, data transformation needs, query patterns, and other factors.11KViews15likes5CommentsApproaches to Integrating Azure Databricks with Microsoft Fabric: The Better Together Story!
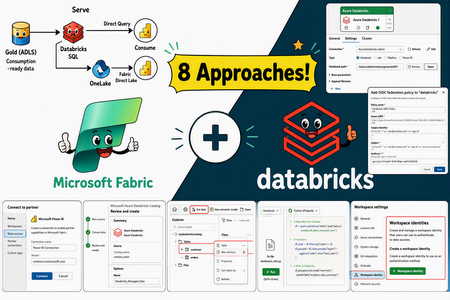
Azure Databricks and Microsoft Fabric can be combined to create a unified and scalable analytics ecosystem. This document outlines eight distinct integration approaches, each accompanied by step-by-step implementation guidance and key design considerations. These methods are not prescriptive—your cloud architecture team can choose the integration strategy that best aligns with your organization’s governance model, workload requirements and platform preferences. Whether you prioritize centralized orchestration, direct data access, or seamless reporting, the flexibility of these options allows you to tailor the solution to your specific needs.7.1KViews9likes1CommentAzure Databricks & Fabric Disaster Recovery: The Better Together Story
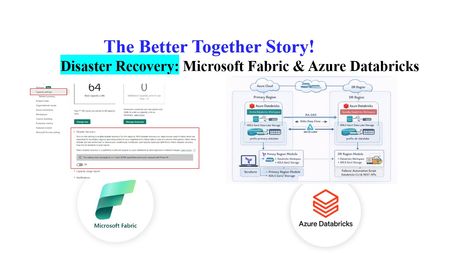
Author's: Amudha Palani amudhapalani, Oscar Alvarado oscaralvarado, Eric Kwashie ekwashie, Peter Lo PeterLo and Rafia Aqil Rafia_Aqil Disaster recovery (DR) is a critical component of any cloud-native data analytics platform, ensuring business continuity even during rare regional outages caused by natural disasters, infrastructure failures, or other disruptions. Identify Business Critical Workloads Before designing any disaster recovery strategy, organizations must first identify which workloads are truly business‑critical and require regional redundancy. Not all Databricks or Fabric processes need full DR protection; instead, customers should evaluate the operational impact of downtime, data freshness requirements, regulatory obligations, SLAs, and dependencies across upstream and downstream systems. By classifying workloads into tiers and aligning DR investments accordingly, customers ensure they protect what matters most without over‑engineering the platform. Azure Databricks Azure Databricks requires a customer‑driven approach to disaster recovery, where organizations are responsible for replicating workspaces, data, infrastructure components, and security configurations across regions. Full System Failover (Active-Passive) Strategy A comprehensive approach that replicates all dependent services to the secondary region. Implementation requirements include: Infrastructure Components: Replicate Azure services (ADLS, Key Vault, SQL databases) using Terraform Deploy network infrastructure (subnets) in the secondary region Establish data synchronization mechanisms Data Replication Strategy: Use Deep Clone for Delta tables rather than geo-redundant storage Implement periodic synchronization jobs using Delta's incremental replication Measure data transfer results using time travel syntax Workspace Asset Synchronization: Co-deploy cluster configurations, notebooks, jobs, and permissions using CI/CD Utilize Terraform and SCIM for identity and access management Keep job concurrencies at zero in the secondary region to prevent execution Fully Redundant (Active-Active) Strategy The most sophisticated approach where all transactions are processed in multiple regions simultaneously. While providing maximum resilience, this strategy: Requires complex data synchronization between regions Incurs highest operational costs due to duplicate processing Typically needed only for mission-critical workloads with zero-tolerance for downtime Can be implemented as partial active-active, processing most workload in primary with subset in secondary Enabling Disaster Recovery Create a secondary workspace in a paired region. Use CI/CD to keep Workspace Assets Synchronized continuously. Requirement Approach Tools Cluster Configurations Co-deploy to both regions as code Terraform Code (Notebooks, Libraries, SQL) Co-deploy with CI/CD pipelines Git, Azure DevOps, GitHub Actions Jobs Co-deploy with CI/CD, set concurrency to zero in secondary Databricks Asset Bundles, Terraform Permissions (Users, Groups, ACLs) Use IdP/SCIM and infrastructure as code Terraform, SCIM Secrets Co-deploy using secret management Terraform, Azure Key Vault Table Metadata Co-deploy with CI/CD workflows Git, Terraform Cloud Services (ADLS, Network) Co-deploy infrastructure Terraform Update your orchestrator (ADF, Fabric pipelines, etc.) to include a simple region toggle to reroute job execution. Replicate all dependent services (Key Vault, Storage accounts, SQL DB). Implement Delta “Deep Clone” synchronization jobs to keep datasets continuously aligned between regions. Introduce an application‑level “Sync Tool” that redirects: data ingestion compute execution Enable parallel processing in both regions for selected or all workloads. Use bi‑directional synchronization for Delta data to maintain consistency across regions. For performance and cost control, run most workloads in primary and only subset workloads in secondary to keep it warm. Implement Three-Pillar DR Design Primary Workspace: Your production Databricks environment running normal operations Secondary Workspace: A standby Databricks workspace in a different(paired) Azure region that remains ready to take over if the primary fails. This architecture ensures business continuity while optimizing costs by keeping the secondary workspace dormant until needed. The DR solution is built on three fundamental pillars that work together to provide comprehensive protection: 1. Infrastructure Provisioning (Terraform) The infrastructure layer creates and manages all Azure resources required for disaster recovery using Infrastructure as Code (Terraform). What It Creates: Secondary Resource Group: A dedicated resource group in your paired DR region (e.g., if primary is in East US, secondary might be in West US 2) Secondary Databricks Workspace: A standby Databricks workspace with the same SKU as your primary, ready to receive failover traffic DR Storage Account: An ADLS Gen2 storage account that serves as the backup destination for your critical data Monitoring Infrastructure: Azure Monitor Log Analytics workspace and alert action groups to track DR health Protection Locks: Management locks to prevent accidental deletion of critical DR resources Key Design Principle: The Terraform configuration references your existing primary workspace without modifying it. It only creates new resources in the secondary region, ensuring your production environment remains untouched during setup. 2. Data Synchronization (Delta Notebooks) The data synchronization layer ensures your critical data is continuously backed up to the secondary region. How It Works: The solution uses a Databricks notebook that runs in your primary workspace on a scheduled basis. This notebook: Connects to Backup Storage: Uses Unity Catalog with Azure Managed Identity for secure, credential-free authentication to the secondary storage account Identifies Critical Tables: Reads from a configuration list you define (sales data, customer data, inventory, financial transactions, etc.) Performs Deep Clone: Uses Delta Lake's native CLONE functionality to create exact copies of your tables in the backup storage Tracks Sync Status: Logs each synchronization operation, tracks row counts, and reports on data freshness Authentication Flow: The synchronization process leverages Unity Catalog's managed identity capabilities: An existing Access Connector for Unity Catalog is granted "Storage Blob Data Contributor" permissions on the backup storage. Storage credentials are created in Databricks that reference this Access Connector. The notebook uses these credentials transparently—no storage keys or secrets are required. What Gets Synced: You define which tables are critical to your business operations. The notebook creates backup copies including: Full table data and schema Table partitioning structure Delta transaction logs for point-in-time recovery 3. Failover Automation (Python Scripts) The failover automation layer orchestrates the switch from primary to secondary workspace when disaster strikes. Microsoft Fabric Microsoft Fabric provides built‑in disaster recovery capabilities designed to keep analytics and Power BI experiences available during regional outages. Fabric simplifies continuity for reporting workloads, while still requiring customer planning for deeper data and workload replication. Power BI Business Continuity Power BI, now integrated into Fabric, provides automatic disaster recovery as a default offering: No opt-in required: DR capabilities are automatically included. Azure storage geo-redundant replication: Ensures backup instances exist in other regions. Read-only access during disasters: Semantic models, reports, and dashboards remain accessible. Always supported: BCDR for Power BI remains active regardless of OneLake DR setting. Microsoft Fabric Fabric's cross-region DR uses a shared responsibility model between Microsoft and customers: Microsoft's Responsibilities: Ensure baseline infrastructure and platform services availability Maintain Azure regional pairings for geo-redundancy. Provide DR capabilities for Power BI as default. Customer Responsibilities: Enable disaster recovery settings for capacities Set up secondary capacity and workspaces in paired regions Replicate data and configurations Enabling Disaster Recovery Organizations can enable BCDR through the Admin portal under Capacity settings: Navigate to Admin portal → Capacity settings Select the appropriate Fabric Capacity Access Disaster Recovery configuration Enable the disaster recovery toggle Critical Timing Considerations: 30-day minimum activation period: Once enabled, the setting remains active for at least 30 days and cannot be reverted. 72-hour activation window: Initial enablement can take up to 72 hours to become fully effective. Azure Databricks & Microsoft Fabric DR Considerations Building a resilient analytics platform requires understanding how disaster recovery responsibilities differ between Azure Databricks and Microsoft Fabric. While both platforms operate within Azure’s regional architecture, their DR models, failover behaviors, and customer responsibilities are fundamentally different. Recovery Procedures Procedure Databricks Fabric Failover Stop workloads, update routing, resume in secondary region. Microsoft initiates failover; customers restore services in DR capacity. Restore to Primary Stop secondary workloads, replicate data/code back, test, resume production. Recreate workspaces and items in new capacity; restore Lakehouse and Warehouse data. Asset Syncing Use CI/CD and Terraform to sync clusters, jobs, notebooks, permissions. Use Git integration and pipelines to sync notebooks and pipelines; manually restore Lakehouses. Business Considerations Consideration Databricks Fabric Control Customers manage DR strategy, failover timing, and asset replication. Microsoft manages failover; customers restore services post-failover. Regional Dependencies Must ensure secondary region has sufficient capacity and services. DR only available in Azure regions with Fabric support and paired regions. Power BI Continuity Not applicable. Power BI offers built-in BCDR with read-only access to semantic models and reports. Activation Timeline Immediate upon configuration. DR setting takes up to 72 hours to activate; 30-day wait before changes allowed.1.4KViews5likes0CommentsMicrosoft Fabric for those who know nothing about Fabric
This is not any regular blog, don't click on this blog if you don't want to get convinced, if you are curious, click and see. You will end up falling in love with Microsoft Fabric. Yes, that's because you will love it when you get to know what it is.21KViews5likes2CommentsTableau to Power BI Migration: Semantic Layer-First Approach for Cloud Architects
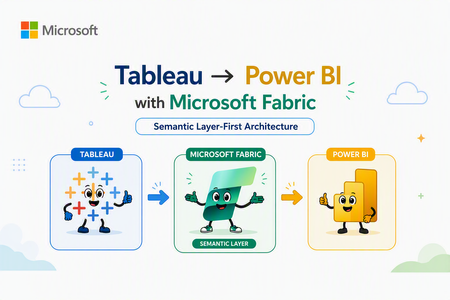
Author's: Mahjabin Ahmed, Yassine El Ouardi, Lavanya Sreedhar LavanyaSreedhar, Peter Lo PeterLo, Aryan Anmol aryananmol, Shreya Harvu shreyaharvu and Rafia Aqil Rafia_Aqil In this guide, we provide practical guidance for migrating from Tableau to Power BI, with a focus on technical best practices and architecture. Unifying business intelligence on the Microsoft Fabric platform, enterprises gain closer integration with Microsoft 365 (Teams, Copilot, Excel). For cloud solution architects and BI developers, a successful migration is not just about rebuilding dashboards in a new tool. It requires thoughtful architectural planning and a shift to a more model-centric approach to BI. Why Semantic Layer-First Architecture Matters The Traditional Migration Challenge Most Tableau to Power BI migrations follow a dashboard-centric approach: teams attempt to replicate existing Tableau workbooks, calculated fields, and LOD (Level of Detail) expressions directly into Power BI reports. While this may seem efficient initially, it creates significant downstream challenges: Duplicated logic: Each report embeds its own calculations and business rules, leading to conflicting KPIs across the organization Maintenance overhead: Changes to business logic require updating dozens or hundreds of individual reports Governance gaps: Without centralized definitions, semantic drift occurs—different teams calculate "Revenue" or "Active Customer" differently Scalability issues: As data volumes grow, report-level transformations become performance bottlenecks The Semantic Layer-First Alternative Microsoft's recommended approach centers on semantic models (formerly called datasets)—centralized, governed data models that separate business logic from visualization. In this architecture: The payoff is substantial: when data evolves or business rules change, you update the semantic model once, and all dependent reports automatically reflect the changes—no manual redesign required. Understanding Migration Complexity: Simple to Very Complex Dashboards Not all Tableau dashboards are created equal. The migration strategy should align with dashboard complexity, and the semantic layer approach becomes increasingly valuable as complexity grows. Follow a Step-by-Step Migration Strategy Migrating from Tableau to Power BI is not a one-click effort – it requires a mix of automated and manual refactoring, plus a sound change management plan. Below are key strategies and best practices for a successful migration: Audit your Tableau estate: Start by taking inventory of all existing Tableau workbooks, data sources, and dashboards. Determine what needs to be migrated (focus on high-value, widely used reports first) and identify any redundant or obsolete content that can be retired rather than converted. Conduct a proof-of-concept (PoC): Before migrating everything, pick a representative complex dashboard (or a subset of your data) and perform a pilot migration. This will help you validate that Power BI can connect to your data (e.g. setting up the Power BI gateways for on-premises sources), test performance (Import vs DirectQuery modes), and experiment with replicating key visuals or calculations. Use the PoC to uncover any surprises early – for example, test that any Level of Detail expressions or table calculations in Tableau can be re-created in DAX. The lessons learned here should inform your overall project plan. Use a phased migration approach: Plan to run Tableau and Power BI in parallel for some period, rather than switching everything at once. Migrate in waves – for example, by business unit or subject area – and incorporate user feedback as you go. This phased approach reduces risk and allows your team to improve the process with each iteration. It also gives end users time to adjust gradually. Migrate high-impact dashboards first: Prioritize the migration of key reports and dashboards that are critical to the business or have the most usage. Delivering these early wins will not only surface any technical challenges to solve but will also help demonstrate the value of Power BI’s capabilities to stakeholders. Early success builds buy-in and momentum for the rest of the migration. Reimagine (don’t just replicate) the experience: It’s rarely possible – or desirable – to exactly re-create every Tableau visualization pixel-for-pixel in Power BI. Embrace the opportunity to focus on business questions and improve user experience with Power BI’s features. For example, rather than replicating a complex Tableau workaround, you might implement a cleaner solution in Power BI using native features (like bookmarks, drilldowns, or simpler navigation between pages). Engage business users and subject matter experts during this redesign to ensure the new reports meet their needs. Enable dataset reusability: One major benefit of the Power BI approach is the ability to create shared datasets and dataflows. As you migrate, look for opportunities to create central semantic models (datasets) that can serve multiple reports. For instance, if several Tableau workbooks are all using similar data about sales, you can create one central Sales dataset in Power BI. Report creators across the organization can then build different Power BI reports on that single dataset without duplicating data or logic. This reduces maintenance and promotes a “build once, reuse often” strategy. Provide training and support: Expect a learning curve for teams moving to Power BI – especially those who are very fluent in Tableau. Plan for user upskilling and training programs. Establish a support community or office hours where new users can ask questions and get help. If possible, identify Power BI champions or recruit a Power BI Center of Excellence (COE) team who can guide others. During the transition, ensure there are subject matter experts (SMEs) available to address questions and validate that the new reports are correct. Manage change and expectations: It’s important to communicate why the organization is moving to Power BI (e.g. benefits like deeper integration, lower TCO, better governance) to get buy-in from end users. Some users may be resistant to change, especially if they’ve invested a lot of time in mastering Tableau. Prepare to handle varying responses – emphasize the personal benefits (like improved performance, new capabilities, or career growth with popular skills) to encourage adoption. Also, involve influential business users early and gather their feedback, so they feel ownership in the new solution. Establish governance from Day 1: Don’t wait until after migration to think about governance. Use this chance to set up Power BI governance aligned to best practices. Decide on important aspects such as workspace naming conventions, who can create or publish content, how you’ll monitor usage and costs, and how to manage data access and security (for example, designing a strategy for RLS/OLS/CLS, and deciding when to use per-user datasets vs. organizational semantic models). Good governance will ensure your shiny new Power BI environment doesn’t sprawl into chaos over time. Allow time for adjustment and iteration: Finally, be patient and iterative. Depending on the scale of your organization and the number of Tableau assets, a full migration can take months or even a year or more. Plan realistic transition periods where both systems might coexist. Continuously refine your approach with each wave of migration. Power BI’s frequent update cadence (monthly releases) means new features may emerge even during your project – stay updated, as new capabilities could simplify your migration (for example, the introduction of field parameters or Copilot might let you modernize certain Tableau features more easily). Reimagine (don’t just replicate) the experience (Step 5): Phase 1: Assessment and Planning 1. Audit Your Tableau Estate Inventory all workbooks, data sources, and calculated fields Identify high-traffic dashboards (prioritize for early migration) Categorize by complexity (Simple/Medium/Complex/Very Complex) 2. Design Your Semantic Architecture Map Tableau data sources to Power BI data sources (DirectQuery, Import, or Direct Lake) Plan star schema for fact/dimension tables Identify shared calculations that should live in semantic models vs. report-specific logic 3. Choose Storage Modes Source Type Recommended Mode Rationale Databricks Delta Lake Direct Lake Real-time analytics, no refresh lag Azure SQL Database DirectQuery or Import Based on data volume and refresh SLAs On-Premises SQL Server Import (via Gateway) Network latency considerations Excel/CSV files Import Small reference data Phase 2: Build the Semantic Layer 1. Create Star Schema Data Models Tableau often relies on flat, denormalized datasets. Power BI performs best with star schemas: Fact tables: Transactional data (sales, orders, events) with foreign keys to dimensions Dimension tables: Descriptive attributes (customers, products, dates) with primary keys Relationships: One-to-many from dimension to fact, leveraging bidirectional filtering sparingly 2. Migrate Calculations to DAX Measures Convert Tableau calculated fields to DAX measures in the semantic model: --Example of DAX: -- Define as measure: Total Revenue = SUMX( 'Sales', 'Sales'[Quantity] * 'Sales'[Unit Price] ) 2.1 Use Copilot to Accelerate DAX Development Leverage Copilot in Power BI Desktop to generate and validate DAX: Describe the calculation in natural language Copilot suggests DAX syntax Review, test, and refine 2.2 Document your Semantic Model Invest in creating an AI-ready foundation for your semantic model. AI systems need to understand unique business contexts in order to prioritize correct information to provide consistent and reliable responses to your end users. Name Tables and Columns Clearly: Avoid ambiguity in your semantic model. Use human-readable, business-friendly names. Avoid abbreviations, acronyms, or technical terms. This improves Copilot’s ability to interpret user intent. Create Meaningful Measures: Define reusable DAX measures for key business metrics (e.g., Revenue, Profit Margin). AI features rely on these to generate insights and summaries. Document Semantic Model objects: Add descriptions and synonyms to your Tables, Columns and measures. This enhances natural language querying and improves Copilot’s contextual understanding. Build an AI Data Schema: prepare your semantic model for AI by utilizing tooling features such as Prep data for AI. Phase 3: Understanding Migration Complexity: Simple to Very Complex Dashboards Not all Tableau dashboards are created equal. The migration strategy should align with dashboard complexity, and the semantic layer approach becomes increasingly valuable as complexity grows. 1. Dashboard Conversion Best Practices Think in "pages" not "sheets": Power BI reports combine multiple visuals per page; group related visuals logically Use slicers for interactivity: Replace Tableau filters with Power BI slicers and filter pane Leverage bookmarks for navigation: Create dynamic report experiences with show/hide containers Simple Complexity Level Category Tableau Feature Power BI Equivalent Microsoft Fabric Enhancements Best Practice Notes Data Model Single custom SQL Power Query for data shaping and ETL. OneLake Shortcuts for unified data access. Use star schema for optimized performance; push logic into the semantic layer rather than visuals. Calculations Basic IF/ELSE, SUM Data Analysis Expressions (DAX) for measures and calculated columns. Copilot for Power BI to assist with DAX creation. Fabric IQ for natural language queries. Centralize calculations in semantic models for consistency and governance. Medium Complexity Level Category Tableau Feature Power BI Equivalent Fabric Enhancements Best Practice Notes Data Model Multiple custom SQL (up to 3) Connect live to databases (Azure Databricks): DirectQuery in Power BI Connect with cloud data sources: Power BI data sources OneLake Shortcuts for unified access without databricks compute cost. Semantic Models can combine multiple sources. Optimize with star schema; Prefer OneLake Shortcuts for performance; avoid heavy transformations in visuals. Calculations Nested IFs, CASE Data Analysis Expressions (DAX) for measures and calculated columns. Copilot for Power BI to assist with DAX creation. Fabric Data Agent for conversational BI. Fabric IQ for natural language queries: Fabric IQ Centralize logic in semantic models; use Copilot for automation and validation; keep calculations reusable. Reporting Tooltip format in Bar and Map visuals Select All/Clear option for Single Select dropdown Standard tooltips offer help tooltips, text, and background formatting. Dynamic tooltip will be able to create the Tooltip page and reuse it in multiple visuals The customization is so much better than the OOB tooltips Create report tooltip pages in Power BI - Power BI | Microsoft Learn Use Clear All Slicers Button. Disable Single Select, Add Clear All Slicers button, Customize the Button and Use the Button Complex Complexity Level Category Tableau Feature Power BI Equivalent Fabric Enhancements Best Practice Notes Data Model Multiple sources Create relationship using more than one column Composite Models in Power BI (DirectQuery + Import) for combining multiple sources, also connect to various cloud services. Dataflows for pre-processing. Power BI allows a relationship between 2 tables based on only one active column. OneLake Shortcuts for unified access without Azure Databricks compute cost; Microsoft Fabric Dataflows Gen2 offers multiple ways to ingest, transform, and load data efficiently. Consolidate sources into semantic models; use Direct Lake for performance; Plan and design data model to comply with star schema supported by Power BI Relationship DAX USERELATIONSHIP DAX for activating relationships in Power BI for a specific calculation Calculations LOD, window functions Data Analysis Expressions (DAX) for measures and calculated columns. Copilot to assist with complex DAX. Fabric IQ Ontology for semantic alignment. Change how visuals interact in a Power BI report. Centralize calculations in semantic layer; use variables in DAX for readability and performance. Fabric Data Agent for a conversational BI. Very Complex Complexity Level Category Tableau Feature Power BI Equivalent Fabric Enhancements Best Practice Notes Data Model Multi-source, Excel, SQL Composite Models in Power BI (DirectQuery + Import) for combining multiple sources, also connect to various cloud services. Dataflows for pre-processing. OneLake Shortcuts for unified access; Connector overview build-in support. Mirroring for real-time sync. Combine multiple sources into well-structured semantic models for consistency and optimized performance. Calculations Predictive logic Data Analysis Expressions (DAX) for measures and calculated columns. Fabric AutoML, ML models, AI Insights, Python/R, Notebook‑based ML (Spark/Scikit‑Learn), Fabric AI Functions, Fabric IQ Ontology Fabric Data Agent for a conversational BI. Centralize logic in semantic models; leverage Copilot for automation and parameter-driven workflows. Prepare for Copilot. 2. Tableau Feature Equivalents Tableau Feature Power BI Equivalent Microsoft Learn Link Calculated Fields DAX Measures DAX Documentation Parameters Field Parameters / Bookmarks Use report readers to change visuals Actions Drillthrough / Bookmarks Drillthrough Tableau Prep Power Query / Dataflows Differences between Dataflow Gen1 and Dataflow Gen2 Tableau Server Power BI Service What is Power BI? Overview of Components and Benefits Phase 4: Governance and Deployment Workspace Planning (Dev / Test / Prod Separation) A proper workspace strategy is essential for governed deployments in Fabric and Power BI. Fabric supports separate Development, Test, and Production stages using Deployment Pipelines, enabling controlled promotions of semantic models, reports, dataflows, notebooks, lakehouses, and other items. You can assign each workspace to a pipeline stage (Dev → Test → Prod) to ensure safe lifecycle management. Sensitivity Labeling (Microsoft Purview Information Protection) Sensitivity labels allow governed classification and protection of data across Fabric items. Sensitivity labels can be applied directly to Fabric items (semantic models, reports, dataflows, etc.) through the item's header flyout or the item settings. Labels from Microsoft Purview Information Protection enforce data access rules and help organizations meet compliance requirements. Endorsement & Certification (Promoted, Certified, Master Data) Endorsement improves discoverability and trust in shared organizational content. Promoted: Item creators mark content as recommended for broader use. Certified: Administrators or authorized reviewers validate content meets organizational quality standards. Master Data: Indicates authoritative single‑source‑of‑truth items such as semantic models or lakehouses. All Fabric items except dashboards can be promoted or certified; data‑containing items can be designated as Master Data. Monitoring & Capacity Planning Determine the appropriate size for fabric capacity when migrating from Tableau to PowerBI. The Fabric SKU Estimator can generate a SKU recommendation (estimate) for your capacity requirements. Ensuring performance and cost efficiency requires ongoing monitoring of your Fabric capacity. Microsoft recommends evaluating workloads using Fabric Capacity Metrics and planning SKU sizes based on real usage. Fabric uses bursting and smoothing to handle spikes while enforcing capacity limits. Monitoring helps identify high compute usage, background refreshes, and interactive workloads to optimize performance. Fabric Data Source Connections (OneLake+ Manage Connections) Microsoft Fabric is designed as an end‑to‑end analytics platform that integrates data from many different source systems into a unified environment powered by OneLake, Data Factory, Real‑Time Analytics, Dataflows , Lakehouses, Warehouses, and Mirrored Databases. The Strategic Advantage: Semantic Layer + Fabric IQ The semantic layer-first approach sets the foundation for the next evolution in enterprise analytics. Fabric IQ (announced at Ignite 2025) is Microsoft's semantic intelligence platform that auto-elevates semantic models into ontologies—structured knowledge graphs that power AI agents, Copilot experiences, and cross-domain data reasoning. What this means for your migration: Semantic models you build today become the foundation for AI-driven analytics tomorrow Data Agents can reason across multiple semantic models, answering questions that span domains Business users transition from "report consumers" to "data explorers" via natural language interfaces Conclusion: Build for the Future, Not Just for Today Migrating from Tableau to Power BI is more than a technology swap—it's an opportunity to re-architect your analytics strategy for the cloud-native, AI-powered era. The semantic layer-first approach requires upfront investment in data modeling, DAX expertise, and Fabric platform adoption. But the payoff is transformative: Consistency: Single source of truth for all business metrics Scalability: Semantic models that serve hundreds of reports and thousands of users Agility: Changes to business logic propagate instantly across the enterprise Future-readiness: Foundation for Fabric IQ, Data Agents, and AI-driven insights Start your migration with the end in mind: not just convert dashboards, but a modern, governed, AI-ready analytics platform that scales with your business. Addressing Key Migration Concerns (1) Why a semantic‑layered model approach is better than recreating Tableau dashboards A semantic‑layered modeling approach is the optimal strategy for migration and is significantly more effective than attempting to recreate Tableau dashboards exactly as they exist. By contrast, Power BI and Fabric encourage a semantic model–first architecture, where all business rules, relationships, calculations, and transformations are centralized in a governed model that serves many dashboards. The approach not only provides consistency and reuse across the enterprise but also ensures that report authors build on a single certified version of the truth. (2) How semantic-layered model approach reduces the constant redesign caused by changing data needs. A semantic‑layered modeling approach directly addresses concern about constant changes and frequent redesigns of dashboards when data evolves. With a semantic layer, changes are absorbed in the model layer—so the logic is updated once and flows automatically into all dependent reports. Combined with Fabric features like OneLake shortcuts, Direct Lake mode, and centralized governance, the semantic layer drastically reduces breakage, minimizes rework, and ensures scalability as data continues to grow and shift. Additional Resources Direct Lake in Microsoft Fabric Create Fabric Data Agents OneLake Shortcuts Write DAX queries with Copilot - DAX Prepare Your Data for AI - Power BI | Microsoft Learn4.8KViews4likes2Comments
Elevating care management analytics with Copilot for Power BI
Healthcare data solutions care management analytics capability offers a comprehensive template using the medallion Lakehouse architecture to unify and analyze diverse data sets of meaningful insights. This enables enhanced care coordination, improved patient outcomes, and scalable, sustainable insights. As the healthcare industry faces rising costs and growing demand for personalized care, data and AI are becoming critical tools. Copilot for Power BI leads this shift, blending AI-driven insights with advanced visualization to revolutionize care delivery. What is Copilot for Power BI? Copilot is an AI-powered assistant embedded directly into Power BI, Microsoft's interactive data visualization platform. By leveraging natural language processing and machine learning, Copilot helps users interact with their data more intuitively whether by asking questions in plain English, generating complex calculations, or uncovering patterns that might otherwise go unnoticed. Copilot for Power BI is embedded within healthcare data solutions, allowing care management—one of its core capabilities—to harness these AI-driven insights. In the context of care management analytics, this means turning a sea of clinical, claims, and operational data into actionable insights without needing to write a single line of code. This empowers teams across all technical levels to gain value from data. Driving better outcomes through intelligent insights in care management analytics The Care Management Analytics solution, built on the Healthcare data solutions platform, leverages Power BI with Copilot embedded directly within it. Here’s how Copilot for Power BI is revolutionizing care management: Enhancing decision-making with AI Traditionally, deriving insights from healthcare data required technical expertise and hours of analysis. Copilot simplifies this by allowing care managers and clinicians to ask questions like “Analyze which medical conditions have the highest cost and prevalence in low-income regions.” The AI interprets these queries and responds with visualizations, trends, and predictions—empowering faster, data-driven decisions. Proactive care planning By analyzing historical and real-time data, Copilot helps identify at-risk patients before complications arise. This enables care teams to intervene earlier, design more personalized care plans, and ultimately improve outcomes while reducing unnecessary hospitalizations. Operational efficiency From staffing models to resource allocation, Copilot provides visibility into operational metrics that can drive significant efficiency gains. Healthcare leaders can quickly identify bottlenecks, monitor key performance indicators (KPIs) and simulate “what-if” scenarios, enabling more i nformed, data-backed decisions on care delivery models. Reducing costs without compromising quality Cost containment is a constant challenge in healthcare. By highlighting areas of high spend and correlating them with clinical outcomes, Copilot empowers organizations to optimize care pathways and eliminate inefficiencies ensuring patients receive the right care at the right time, without waste. Democratizing data access Perhaps one of the most transformative aspects of Copilot is how it democratizes access to analytics. Non-technical users from care coordinators to nurse managers can interact with dashboards, explore data, and generate insights independently. This cultural shift encourages a more data-literate workforce and fosters collaboration across teams. Real-world impact Consider a healthcare system leveraging Power BI and Copilot to manage chronic disease populations more effectively. By combining claims data, social determinants of health (SDoH) indicators, and patient-reported outcomes, care teams can gain a comprehensive view of patient needs- enabling more coordinated care and proactively identifying care gaps. With these insights, organizations can launch targeted outreach initiatives that reduce avoidable emergency department (ED) visits, improve medication adherence, and ultimately enhance outcomes. The future is here The integration of Copilot for Power BI marks a pivotal moment for healthcare analytics. It bridges the gap between data and action, bringing AI to the frontlines of care. As the industry continues to embrace value-based care models, tools like Copilot will be essential in achieving the triple aim: better care, lower costs, and improved patient experience. Copilot is more than a tool — it is a strategic partner in you care transformation journey. Deployment of care management analytics Showcasing how a Population Health Director uncovers actionable insights through Copilot Note: To fully leverage the capabilities of the solution, please follow the deployment steps provided and use the sample data included with the Healthcare Data Solution. For more information on care management analytics, please review our detailed documentation and get started with transforming your healthcare data landscape today Overview of care management analytics - Microsoft Cloud for Healthcare | Microsoft Learn Deploy and analyze using Care management analytics - Training | Microsoft Learn. Medical device disclaimer: Microsoft products and services (1) are not designed, intended or made available as a medical device, and (2) are not designed or intended to be a substitute for professional medical advice, diagnosis, treatment, or judgment and should not be used to replace or as a substitute for professional medical advice, diagnosis, treatment, or judgment. Customers/partners are responsible for ensuring solutions comply with applicable laws and regulations.
Upgrade performance, availability and security with new features in Azure Database for PostgreSQL
At Microsoft Build 2025 the Postgres on Azure team is announcing an exciting set of improvements and features for Azure Database for PostgreSQL. One area we are always focused on is the enterprise. This week we are delighted to announce improvements across the enterprise pillars of Performance, Availability and Security. In addition, we're improving Integration of Postgres workloads with services like ADF and Fabric. Here's a quick tour of the enterprise enhancements to Azure Database for PostgreSQL being announced this week. Performance and scale SSD v2 with HA support - Public Preview The public preview of zone-redundant high availability (HA) support for the Premium SSD v2 storage tier with Azure Database for PostgreSQL flexible server is now available. You can now enable High Availability with zone redundancy using Azure Premium SSD v2 when deploying flexible server, helping you achieve a Recovery Point Objective (RPO) of zero for mission-critical workloads. Premium SSD v2 offers sub-millisecond latency and outstanding performance at a low cost, making it ideal for IO-intensive, enterprise-grade workloads. With this update, you can significantly boost the price-performance of your PostgreSQL deployments on Azure and improve availability with reduced downtime during HA failover. The key benefits of SSD v2 include: Flexible disk sizing from 1 GiB to 64 TiB, with 1-GiB increment support Independent performance configuration: scale up to 80,000 IOPS and 1,200 MBps throughput without needing to provision larger disks To learn more about how to upgrade and best practices, visit: Premium SSDv2 PostgreSQL 17 Major Version Upgrade – Public Preview PostgreSQL version 17 brings a host of performance improvements, including a more efficient VACUUM process, faster sequential scans via streaming IO, and optimized query execution. Now, with the public preview of in-place major version upgrades to PostgreSQL 17 there is an easier path to v17 for your existing flexible server workloads. With this release, you can upgrade from earlier versions (14, 15, or 16) to PostgreSQL 17 without the need to migrate data or change server endpoints, simplifying the upgrade process and minimizing downtime. Azure’s in-place upgrade capability offers a native, low-disruption upgrade path directly from the Azure Portal or CLI. For upgrade steps and best practices, check out our detailed blog post. Availability Long-Term Backup (LTR) for Azure Database for PostgreSQL flexible server - Generally Available Long-term backups are essential for organizations with regulatory, compliance, and audit-driven requirements, especially in industries like finance and healthcare. Certifications such as HIPAA often mandate data retention periods up to 10 years, far exceeding the default 35-day retention limit provided by point-in-time restore (PITR) capabilities. Long-term backup for Azure Database for PostgreSQL flexible server, powered by Azure Backup is now generally available. With this release, you can now benefit from: Policy-driven, one-click enablement of long-term backups Resilient data retention across Azure Storage tiers Consumption-based pricing with no egress charges Support for restoring backups well beyond community-supported PostgreSQL versions This LTR capability uses a logical backup approach based on pg_dump and pg_restore, offering a flexible, open-source format that enhances portability and ensures your data can be restored across a variety of environments including Azure VMs, on-premises, or even other cloud providers. Learn more about long term retention: Backup and restore - Azure Database for PostgreSQL flexible server Azure Databases for PostgreSQL flexible server Resiliency Solution accelerator When it comes to ensuring business continuity, your database infrastructure is the most critical component. In addition to product documentation, it is important to have access to opinionated solution architecture, industry-proven recommended practices, and deployable infra-as-code that you can learn and customize to ensure an automated production-ready resilient infrastructure for your data. The Azure Database for PostgreSQL Resiliency Solution Accelerator is now available, providing a set of deployable architectures to ensure business continuity, minimize downtime, and protect data integrity during planned and unplanned events. In additional to architecture and recommended practices, a customizable Terraform deployment workflow is provided. Learn more: Azure Database for PostgreSQL Resiliency Solution Accelerator Security Automatic Customer Managed Key (CMK) version updates - Generally Available Azure Database for PostgreSQL flexible server data is fully encrypted, supporting both Service Managed and Customer Managed encryption keys (CMK). Automatic version updates for CMK (also known as “versionless keys”) is now generally available. This change simplifies the key lifecycle management by allowing PostgreSQL to automatically adopt new keys without needing manual updates. Combined with Azure Key Vault's auto-rotation feature this significantly reduces the management overhead of encryption key maintenance. Learn more about automatic CMK version updates. Azure confidential computing SKUs for flexible server - Public Preview Azure confidential computing enables secure sensitive and regulated data, preventing unwanted access of data in-use, by cloud providers, administrators, or external users. With the public preview of Azure confidential SKUs for Azure Database for PostgreSQL flexible server you can now select from a range of Confidential Computing VM sizes to run your PostgreSQL workloads in a hardware-based trusted execution environment (TEE). Azure confidential computing encrypts data in TEE, processing data in a verified environment, enabling you to securely process workloads while meeting compliance and regulatory demands. Learn more about confidential computing with the Azure Database for flexible server. Integration Entra Authentication for Azure Data Factory & Azure Synapse - Generally Available In an era of bring-your-own-device and cloud-enabled apps it is increasingly important for enterprises to maintain central control an identity-based security perimeter. With integrated Entra ID support, Azure Database for PostgreSQL flexible server allows you to bring your database workloads within this perimeter. But how do you securely connect to other services? Entra ID authentication is now supported in the Azure Data Factory and Azure Synapse connectors for Azure Database for PostgreSQL. This feature enables seamless, secure connectivity using Service Principal (key or certificate) and both User-Assigned and System-Assigned Managed Identities, streamlining access to your data pipelines and analytics workloads. Learn more about How to Connect from Azure Data Factory and Synapse Analytics to Azure Database for PostgreSQL. Fabric Data Factory – Upsert Method & Script Activity - Generally Available The Microsoft Fabric has become to go-to data analytics platform with services and tools for every data lifecycle state. To improve customization and fine-grained control over processing of PostgreSQL data, the Upsert Method and custom Script Activity are now generally available in Fabric Data Factory when using Azure Database for PostgreSQL as a source or sink. Upsert Method enables intelligent insert-or-update logic for PostgreSQL, making it easier to handle incremental data loads and change data capture (CDC) scenarios without complex workarounds. Script Activity allows you to embed and execute your own SQL scripts directly within pipelines—ideal for advanced transformations, procedural logic, and fine-grained control over data operations. These capabilities offer enhanced flexibility for building robust, enterprise-grade data workflows, simplifying your ETL processes. Connect to VS Code from the Azure Portal - Public Preview With the exciting announcement of a revamped VS Code PostgreSQL extension preview this week, we're adding a new connection option to the Azure Portal to connect to your flexible server with VS Code, creating a more unified and efficient developer experience. Here's why it matters: One Click Connectivity: No manual connection strings or configuration needed. Faster Onboarding: Go from provisioning a database in Azure to exploring and managing it in VS Code within seconds. Integrated Workflow: Manage infrastructure and development from a single, cohesive environment. Productivity: Connect directly from the Portal to leverage VS Code extension features like query editing, result views, and schema browsing. Where to learn more The Build 2025 announcements this week are just the latest in a compelling set of features delivered by the Azure Database for PostgreSQL team and build on our latest set of monthly feature updates (see: April 2025 Recap: Azure Database for PostgreSQL Flexible Server). Follow the Azure Database for PostgreSQL Blog where you'll see many of the latest updates from Build, including What's New with PostgreSQL @Build, and New Generative AI Features in Azure Database for PostgreSQL.716Views4likes0CommentsBuilding Healthcare Research Data Platform using Microsoft Fabric
Co-Authors: Manoj Kumar, Mustafa Al-Durra PhD, Kemal Kepenek, Matt Dearing, Praneeth Sanapathi, Naveen Valluri Overview Research data platforms in healthcare providers, academic medical centers (AMCs), and research institutes support research, clinical decision making, and innovation. They consolidate data from various sources, making it accessible for comprehensive analysis and fostering collaboration among research teams. These platforms automate data collection, processing, and delivery, reducing time and effort needed for data management. This allows researchers to focus on their core activities while ensuring data security and regulatory compliance. The ability to work with multimodal data encourages interdisciplinary and interorganizational collaboration, uniting experts to address complex healthcare challenges. Current challenges Researchers face many common challenges as they work with multimodal healthcare data: Data integration and curation: The process of integrating various data types, such as clinical notes, imaging data, genomic information, and sensor data, presents significant challenges due to differences in formats, standards, and sources. Each AMC employs unique methods for data curation, with some utilizing on-premises solutions and others adopting hybrid cloud systems. No standardized approach currently exists for data curation, necessitating considerable organizational efforts to ensure data consistency and quality. Furthermore, data deidentification is often required to safeguard patient privacy. Data discovery and building cohorts: The lack of a unified multimodal data platform leads to the segregation of data across different modalities. Cohort discovery for each modality is performed separately and often lacks a self-service option, necessitating additional human resources to assist researchers in the data discovery process. This issue is particularly significant because researchers who require Institutional Review Board (IRB) approval cannot access the data beforehand but still need an effective method to identify and explore cohorts. Data delivery: Sensitive patient data, after institutional review board approval, must comply with privacy regulations like the Health Insurance Portability and Accountability Act (HIPAA) and the General Data Protection Regulation (GDPR), requiring secure transfer to prevent breaches. The data, sourced from various systems, needs processing for research readiness. Delivering unified data from modalities like imaging, genomics, and health records is challenging. Typically, research IT teams curate cohort data and deliver it to an SQL database or a file share, accessed by researchers via secure virtual machines. This method often leads to data duplication, creating significant overhead due to numerous ongoing research projects. Cost management: Research projects are funded by government grants and private organizations. Managing these costs is challenging. Research IT departments often implement chargebacks for transparency and accountability in resource use. However, there is a disconnect between funding models and operations. Research teams favor capital expenditure (CapEx) with upfront funding for long-term resources, while cloud platforms operate on operational expenditure (OpEx), incurring ongoing costs based on usage. This shift can lead to concerns about unpredictable costs and budgeting difficulties. Bridging this gap requires careful planning, communication, and hybrid financial strategies to align research needs with cloud-based systems. Compliance with regulations: Healthcare research uses sensitive patient data, requiring strict adherence to HIPAA and GDPR. Transparency in data handling is essential but complex. Researchers must document disclosures thoroughly, detailing who accessed the data and for what purpose. However, tracking and auditing are often fragmented due to inconsistent systems. Variability in disclosure requirements from different agencies adds to compliance challenges. Balancing an auditable trail with privacy and manageable administrative tasks is crucial. Research data platform requirements Ability to curate multi modal data into the research data platform Ability for researchers to identify cohorts (without seeing data) to submit data requests to IRB Automated data delivery after IRB workflow approves the request to access relevant data Tools for researchers as part of the same platform Secure and regulatory-compliant environment for research. An approach to building a research data platform using Microsoft Fabric This article serves as a guide to healthcare organizations, offering a point of view and a prescriptive guidance on building a research data platform using Microsoft Fabric. The solution uses several features from healthcare data solutions in Microsoft Fabric, including its discover and build cohorts capability, and features from the Fabric platform. Microsoft Fabric: is a unified, AI-powered data platform designed to simplify data management and analytics. It integrates various tools and services to handle every stage of the data lifecycle, including ingestion, preparation, storage, analysis, and visualization. Fabric is built on a Software as a Service (SaaS) foundation, offering seamless experience for organizations to make data-driven decisions. For additional details, refer to the following link: What is Microsoft Fabric - Microsoft Fabric | Microsoft Learn Healthcare data solutions in Fabric: Healthcare data solutions in Fabric help you accelerate time to value by addressing the critical need to efficiently transform healthcare data into a suitable format for analysis. With these solutions, you can conduct exploratory analysis, run large-scale analytics, and power generative AI with your healthcare data. By using intuitive tools such as data pipelines and transformations, you can easily navigate and process complex datasets, overcoming the inherent challenges associated with unstructured data formats. For additional details, refer to the following links: Healthcare data solutions in Microsoft Fabric - Microsoft Cloud for Healthcare | Microsoft Learn Discover and build cohorts: Discover and build cohorts (preview) capability in healthcare data solutions enables healthcare organizations to efficiently analyze and query healthcare data from multiple sources and formats. It simplifies the preparation of data for health trend studies, clinical trials, quality assessments, historical research, and AI development. It supports natural language queries for multimodal data exploration and cohort building, making it ideal for research and AI-driven projects. For additional details, refer to the following link: Overview of discover and build cohorts (preview) - Microsoft Cloud for Healthcare | Microsoft Learn The proposal for research data platform architecture builds upon the following foundational premises: Recognition of Fabric as the all-in-one data storage, processing, management and analytics platform with enterprise-level features around security, availability and self-service. Adoption of Fabric Workspace(s) as the security boundary (a secure logical container) for maintaining data platform items (data storage and processing assets). Fabric workspaces may be provisioned for and used by different research data platform stakeholders (groups of users) with different requirements around use cases, data privacy, data sensitivity and access security. Use of healthcare data solutions in Fabric, as the core capability to maintain healthcare data assets in a standard (interoperable) manner. Healthcare data solutions enables the storage and processing of several healthcare data modalities and formats that follow industry standards (for example, clinical modality in FHIR® NDJSON format and Clinical-Imaging modality’s DICOM® format). Industry standards make it easier for research data platform stakeholders to share (exchange) data and insights within their own organization as well as (when needed) with other organizations that they collaborate with. Use of Fabric native capabilities to address requirements that may not (yet) have been implemented for healthcare specific needs. This provides the research data platform stakeholders with the flexibility to develop various data storage and processing workloads easily in a low (or no) code manner. Fig – Conceptual architecture of research data platform in Microsoft Fabric Note: This diagram is an architectural pattern and does not constitute one to one mapping of existing Microsoft products. Organizing source data in data workspace (One Data Hub in the above diagram) Organize your enterprise data into a data workspace that could be leveraged for research purposes. This acts as a ‘One Data Hub’ for the research data platform. Multiple Lakehouse can be present in this workspace. There should be at least one Lakehouse that organizes data using ‘unified folder structure’ best practice. Convert data from non-supported format to healthcare data solutions supported format to leverage out of the box transformation for multimodal data: For healthcare data solutions supported modalities: Implement custom transformations to convert data to supported modalities/format. For unsupported modalities: Implement extensions to bronze Lakehouse to accommodate additional data modalities. Epic data availability: Epic supports FHIR data export using Bulk FHIR APIs. If your dataset meets the use cases of Epic Bulk Data, you can store the resulting FHIR resources into One Data Hub for further transformation. Avoid data content duplication: Data duplication cannot be totally avoided. However, the same file and same content are never duplicated. There will be situations when data needs to be transformed to suit the needs of existing transformation pipelines for accelerating research data platform development. Additionally, OneLake in Fabric storage, where Lakehouse is maintained, uses file compression. Healthcare data solutions in Fabric has functionality to compress raw files to zip and always writes structured data to delta parquet which is a higher compressed format. More information can be found here - Data architecture and management in healthcare data solutions - Microsoft Cloud for Healthcare | Microsoft Learn Curating data for research (One Analytics workspace in the above diagram) Implement and extend Silver Lakehouse: A flattened FHIR® data model is provided by healthcare data solutions out of the box within the Silver Lakehouse. Extending the existing data model is possible through adding new columns to existing tables or through adding new tables in the Silver Lakehouse. If there is a need to introduce a different data model altogether, it is best to implement it using a different Lakehouse. Implement and extend Gold Lakehouse: Deploy and extend Observational Medical Outcomes Partnership Common Data Model (OMOP CDM): Deploy OMOP CDM 5.4 out of the box with healthcare data solutions deployment. Extend OMOP CDM to accommodate additional modalities. For example, implement Gene sequencing, Variant occurrence and Variant annotation tables to add genomics modality into OMOP CDM or implement medical imaging data on OMOP CDM as described here - Development of Medical Imaging Data Standardization for Imaging-Based Observational Research: OMOP Common Data Model Extension - PubMed Implement custom Gold Lakehouse(s): Implement other custom Gold Lakehouse using Fabric tools that run your transformation logic from Silver to Gold. These Lakehouse cannot be connected to discover and build cohorts capability within healthcare data solutions. Customers that need access to custom data can connect their custom cohort browsers to the SQL Analytics Endpoint(s) of their custom Gold Lakehouse(s). Enable data de-identification: Microsoft provides several solutions that can be used to implement a comprehensive de-identification solution that customers expect. Refer to the articles below for details. Dynamic data masking in Fabric Data Warehouse - Microsoft Fabric | Microsoft Learn Row-level security in Fabric data warehousing - Microsoft Fabric | Microsoft Learn Column-level security in Fabric data warehousing - Microsoft Fabric | Microsoft Learn Announcing a de-identification service for Health and Life Sciences | Microsoft Community Hub Cohort discovery using cohort builder tool Microsoft’s cohort browser: Today Discovery and Build Cohort supports eyes-on cohort discovery. This is an out of the box solution that is part of healthcare data solutions in Fabric. When eyes off discovery is supported, researchers as well as research IT can benefit from both eyes off and eyes on discovery and cohort building. 3rd-party cohort browser (e.g., OHDSI Atlas): Most 3rd party cohort browsers (E.g. OHDSI Atlas) and home-grown cohort browsers typically support connection to a SQL endpoint. Microsoft Fabric platform provides the capability of exposing SQL endpoint from a Lakehouse that can be connected to a 3rd party cohort browser to perform cohort discovery. Automated data delivery Creating research workspaces with cohort needed for research: Create separate workspaces for different research projects to keep Fabric items distinct and project specific using Fabric APIs. Assign workspaces to a Fabric capacity: Note: When needed, and if the organization has more than one Fabric capacity provisioned, workspace assignment can be spread across different capacities to help manage cost and performance. Next, set up a Lakehouse and provide access for team members (as per IRB approval list). This ensures both access and security at the workspace level. Export data to research workspace (format desired by researchers): Currently, DBC exports data as CSV/JSON files stored in a Lakehouse within the same workspace. Shortcut the destination Lakehouse into research workspace to keep the sanity of cohort data. Tools for researchers: Fabric provides several data engineering and data science tools out of the box that researchers can leverage to perform research. The following are some of the documents that customers can use to enable researchers with the tools of choice. Data science in Microsoft Fabric - Microsoft Fabric | Microsoft Learn Create, configure, and use an environment in Fabric - Microsoft Fabric | Microsoft Learn Migrate libraries and properties to a default environment - Microsoft Fabric | Microsoft Learn Charge back: Fabric compute pricing depends on the chosen Fabric capacity SKU. Assigning different Fabric capacities to different projects or groups within the same cost center can facilitate chargeback. See the step mentioned above on assigning a workspace to a Fabric capacity during workspace creation. Manage historic data migration to the research data platform on Fabric In most instances, customers already possess a research data platform. They seek to transition to this proposed solution without disrupting their current research data flow and obligations. Follow this approach to migrate or use data from the existing platform to the new one: Use your current research data platform as a Lakehouse or a Data Warehouse in Fabric (take advantage of Shortcut and Mirroring features available in Fabric). Fabric offers cross-database query, i.e. allowing to query and join multiple Lakehouse and data warehouses in a single query. Customers can choose how and where to implement such queries to augment the healthcare data solutions datasets with their existing datasets, all natively in Fabric. A bridge/mapping layer can be built to link the old and the new in a cross-relational way. Conceptually, such an approach has also ties to Bring Your Own Database (BYO-DB) requirement, which is the ability to bring custom defined format and still be able to easily convert to healthcare data solutions specific format. Other workflow integration Integrate research data platform with IRB workflow: IRB workflows are dependent on the tools utilized. For instance, eIRB solution from Huron. While there is currently no direct integration between IRB workflows and the research data platform on Fabric, it is possible to develop a connector using Power Platform integration with Fabric. Specific details are not available at this time as this remains an exploratory initiative. Another approach will be to use Fabric REST APIs (as a pro-code method) that can enable richer integration between Fabric and the 3 rd -party system, and a better consuming user experience at the end. Capture logs necessary for “accounting of disclosures”: Logs in Fabric can be captured at event level. It’s up to the customer to decide the level and type of logs that need to be captured for accounting of disclosure. This will need some custom implementation. One such capability of Fabric that can be used is: Track user activities in Microsoft Fabric - Microsoft Fabric | Microsoft Learn FHIR® is a registered trademark of Health Level Seven International, registered in the U.S. Trademark Office and is used with their permission. DICOM® is the registered trademark of the National Electrical Manufacturers Association (NEMA) for its Standards publications relating to digital communications of medical information. If you are a Microsoft customer needing further information, support, or guidance related to the content in this blog, we recommend you reach out to your Microsoft account team in order to set up a discussion with the authors.