hyperscale
48 Topics
Public Preview: Auto-pause and auto-resume for Azure SQL Database Hyperscale Serverless
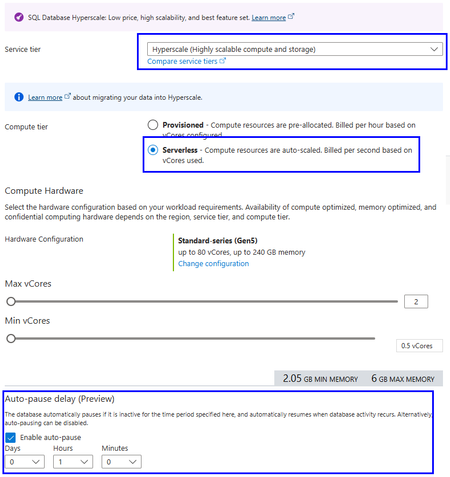
Auto-pause and auto-resume are now available in public preview for Azure SQL Database Hyperscale Serverless. You can now combine Hyperscale's independent scaling of compute and storage with the ability to automatically pause inactive databases, helping reduce compute costs for workloads with extended or predictable idle periods.109Views0likes0CommentsDatabase Hub in Fabric: Now in Public Preview -Turn Database Signals into Guided Action
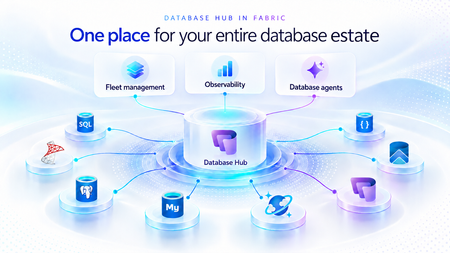
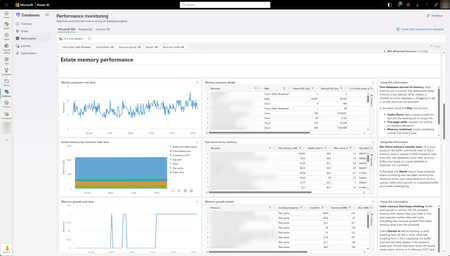
As applications grow, so does the database estate behind them. What starts with a handful of databases can become hundreds or thousands of resources spread across services, subscriptions, and environments. For the teams responsible for keeping them healthy, the challenge is no longer just collecting signals. It is knowing what needs attention, why it matters, and what to do next. Now in public preview, Database Hub in Microsoft Fabric brings inventory, health, performance, security, and optimization insights into one connected experience. It helps administrators and developers see the bigger picture, identify affected resources, and move from estate-wide visibility to focused investigation, without losing the context that brought them there. The preview brings together supported resources across Azure SQL Database, SQL Server enabled by Azure Arc, Azure Database for PostgreSQL, Azure Cosmos DB, and SQL database in Fabric. Available capabilities and signals vary by service and preview configuration. Database Hub Overview brings together estate-wide findings and cross-engine performance trends to help you prioritize what needs attention. Start with what needs your attention When you manage a large database estate, another dashboard is only useful if it helps you decide where to spend your time. The Overview page provides that starting point, bringing together findings across security, performance, and optimization. It distinguishes Issues, which require timely attention, from Suggestions, which highlight opportunities to improve your estate over time. You might begin with a security configuration that needs review or a performance signal that warrants investigation. Selecting a finding opens Estate with the relevant filters already applied, so you can see the affected resources rather than search for them again. The result is a more direct path from “something needs attention” to “these are the resources I should investigate.” Overview highlights issues across Security, Performance, and Optimization, with affected-resource counts and direct links to investigate further. Bring your estate into one view, and make it relevant to you The Estate experience brings supported resources into a unified inventory, scoped to your existing permissions. Search and filters help you narrow that inventory to the service, subscription, or resource group you manage. This is especially useful when your responsibilities span database engines. You can begin with a broader view, then focus on Azure SQL databases, Arc-enabled SQL Server resources, or Azure Database for PostgreSQL flexible servers without rebuilding the resource list in separate portals. Each resource brings its associated Issues and Suggestions into context. Open a finding to review the affected resource, supporting information, and recommended next step. The inventory also respects the resource model of each service. For example, the PostgreSQL view represents flexible server instances, rather than every database hosted within them. A unified view does not mean moving your databases. Your Azure resources remain in their existing subscriptions, and on-premises SQL Server instances remain on-premises, connected through Azure Arc. Database Hub brings operational context together; it does not require relocating or mirroring your application data into Fabric. Estate brings resource inventory, Issues, and Suggestions into one view, with quick actions to continue investigation in the Azure portal, VS Code, or SSMS. Understand security posture and performance in context Database Hub helps you identify configurations worth reviewing and resources that need a closer look. For security, supported signals can include Microsoft Entra authentication, customer-managed keys, and auditing coverage, depending on the database service. These findings provide a starting point for investigation, not a blanket judgment that every flagged resource is insecure or noncompliant. For example, a suggestion to review customer-managed keys should be evaluated against your organization’s requirements. A resource using service-managed keys is still encrypted at rest. For performance, built-in dashboards bring supported utilization and activity signals into view, including CPU, memory, storage, I/O, and connections. Review trends across your estate, then narrow the scope and time range to investigate individual resources. Metric availability varies by engine and monitoring configuration; missing data should not be interpreted as good health. For supported SQL monitoring scenarios, you can also create a custom monitoring dashboard from a template and tailor its charts and layout to the resources your team follows regularly. Together, these experiences help answer two practical questions: Where is pressure building, and where is there an opportunity to improve? Performance summaries highlight recent capacity signals and trends across Microsoft SQL, PostgreSQL, and Cosmos DB. The Security dashboard summarizes Microsoft Entra authentication, audit logging, and customer-managed key coverage, helping you identify configurations that warrant review across your estate. The Performance monitoring dashboard combines memory-pressure trends, resource-level details, and interpretation guidance to help focus your investigation. Move from a finding to an informed next step Estate-wide visibility is the beginning of an investigation, not a replacement for database expertise. When a finding needs deeper analysis, Database Hub helps you review the evidence and continue in the appropriate native experience, such as the Azure portal or SQL Server Management Studio (SSMS). Engine-specific diagnostics and configuration changes remain in the tools designed for that work. Consider a performance issue that occurred before an administrator could inspect it. In supported agent-assisted scenarios, captured incident evidence can help establish what happened, when it happened, and which queries or sessions were involved. That context gives the administrator a more informed starting point for investigation. The operator remains in control: review the evidence, evaluate the recommendation, and apply authorized changes through the appropriate service tools. The preview investigation workflow does not automatically remediate issues, and existing permissions and approval requirements continue to apply. Bring database expertise into agent-assisted workflows We are also making database operational intelligence available through agent skills: reusable capabilities that agents can call to support observability, monitoring, diagnostics, optimization, and other database operations. Database Hub provides estate context; skills provide a way to bring database expertise into an agent-assisted investigation. This creates a foundation for helping teams move from identifying an affected resource to understanding its signals and evaluating the next step. We’re building toward making this expertise available in the AI companions and development tools teams already use, with recommendations grounded in evidence, the specific database, and your organization’s operational controls. If we take a step back, our broader vision brings together a free, extensible Database Hub experience, agentic observability, and OneLake integration, all within Microsoft Fabric. It’s a foundation for connecting database operations with analytics and AI and helping teams turn signals into informed action. Get started with Database Hub Start with the Database Hub documentation to review preview availability, supported services, and setup requirements. Ask your Fabric administrator to enable the preview where required, confirm that you have the appropriate resource permissions, and complete any service-specific monitoring prerequisites. Then open Microsoft Fabric, select Databases in the left navigation, and begin with Overview. Choose a finding, explore the affected resources in Estate, and follow the evidence into your next investigation. For more details on supported services and getting set up, the Database Hub documentation is also available on Microsoft Learn.209Views2likes1Comment
Public Preview: Performance monitoring for Azure SQL
Today we're excited to announce the public preview of performance monitoring for Azure SQL. Performance monitoring gives you deep visibility into the health and performance of your SQL estate, built directly into the Azure SQL platform. It works across: Azure SQL Database Azure SQL Managed Instance (coming soon) SQL Server on Azure Virtual Machines SQL Server enabled by Azure Arc Microsoft collects performance-related telemetry, runs the pipeline, and stores the data for you. There's nothing you need to deploy and nothing to operate. You get direct query access to your telemetry. And in Fabric Database Hub, you get prebuilt dashboards and a single view of your whole estate. Why we built this Monitoring SQL performance at scale often meant building and running your own monitoring stack. Before you could effectively answer, "which of my databases need attention right now?", you typically had to: Deploy and configure a collection resource, such as a watcher or an agent Build a telemetry pipeline to move the data Provision a data store, and then pay for it, secure it, and keep it running Build dashboards on top of all of it Repeat for every new server, database, or region That's a lot of work before you see your first chart. And every step is another thing that can break, drift, or quietly stop collecting data. Customers are also turning to AI to make sense of their database estate. They want an AI agent that can spot a performance problem, explain what's causing it, and recommend a fix. But an AI agent is only as good as the data it can reach. It operates best with one consistent source of performance data across every database, not a patchwork of tools and data stores. We heard this feedback loud and clear from customers. You told us you love having at-scale dashboards, query-level visibility, and ownership of your performance data. You also told us that setting up a telemetry stack was time consuming, scale limits got in the way, and running the data store added operational burden and cost overhead. One customer put it simply: They wanted to spend less time managing their telemetry infrastructure and more time managing and improving their databases. Performance monitoring keeps the parts you valued and removes the infrastructure you had to manage. No infrastructure to manage With performance monitoring, you don't need to: Create or manage watcher resources or collection agents Build or operate telemetry pipelines Provision, size, or pay for your own data store Worry about scale limits on how many targets you can monitor It's all managed by Microsoft. Telemetry is collected close to the database engine and sent to a Microsoft-managed telemetry pipeline and data store. Access to that data is governed by Azure role-based access control (RBAC), so people only see telemetry for the resources they already have access to. Key capabilities Consistent telemetry across your SQL estate Performance monitoring collects the same core set of performance data across every supported SQL deployment, whether it runs in Azure, on-premises, or in another cloud. That means one mental model and one set of dashboards, instead of a different tool for every flavor of SQL. The preview collects performance-related telemetry including: CPU and memory utilization Wait statistics Active sessions Storage I/O and database storage utilization Performance counters Client connections Database properties Availability group, replica, and database replica health Prebuilt dashboards in Fabric Database Hub Performance monitoring comes with prebuilt dashboards in Fabric Database Hub, so you can see performance at a glance without building anything yourself. The dashboards are designed to quickly answer two questions: Are my databases healthy? Which ones need my attention? From there, you can drill into resource usage, waits, and session activity to understand what's driving a change in performance. Query your telemetry directly Your telemetry is available through a Microsoft-managed, RBAC-governed Azure Data Explorer endpoint. You can connect from the Azure Data Explorer web UI and query it with Kusto Query Language (KQL). You don't need to create or pay for your own Azure Data Explorer cluster. This opens a lot of options: Build your own reports and dashboards Connect tools you already use, such as Grafana or Power BI Give an AI agent access to investigate performance across your estate Here's a quick example that ranks the resources you can see by 95th-percentile CPU over the last hour: SqlServerCPUUtilization | where SampleTimeUTC > ago(1h) | summarize AvgCPU = round(avg(AvgCPUPercent), 1) , P95CPU = round(percentile(AvgCPUPercent, 95), 1) by ResourceID, ResourceTypeK | top 10 by P95CPU desc To get started, see Query performance monitoring telemetry. The article includes the schema, connection steps, and a set of ready-to-run starter queries. See your entire database estate in Fabric Database Hub Performance monitoring is integrated with Fabric Database Hub, where you can see your entire database estate from Azure in one place, including: Azure SQL Azure Database for PostgreSQL Azure Cosmos DB Fabric Database Hub is built for when you need to look across all your databases, not just one at a time. With Fabric Database Hub, you can: Use prebuilt performance dashboards for your SQL resources Get estate-wide visibility into health and performance across database types Investigate root cause and query performance across many databases Use AI-assisted analysis to find and explain issues faster Build Real-Time Dashboards on top of your performance telemetry Performance monitoring data flows into Fabric Database Hub automatically. There's no separate onboarding step to connect the two. To learn more about Fabric Database Hub, click here. Getting started How you turn on performance monitoring depends on the resource type. Resource type How monitoring is enabled in preview Step-by-step guidance Azure SQL Database Add an extended property to each database you want to monitor. Performance monitoring for Azure SQL Database Azure SQL Managed Instance (coming soon) Coming soon Coming soon SQL Server on Azure VMs Turn on a feature flag in the SQL IaaS Agent extension. Performance monitoring for SQL Server on Azure VMs SQL Server enabled by Azure Arc On by default once the server is connected to Azure Arc. Monitor SQL Server enabled by Azure Arc To view performance monitoring data, you need: The Reader role, or a role with higher privileges, on each subscription that contains the resources you want to query. The Microsoft.AzureArcData resource provider registered on the subscription. Availability Performance monitoring is available in public preview in the following Azure regions: Americas: Brazil South, Canada Central, Canada East, Central US, East US, East US 2, North Central US, South Central US, West Central US, West US, West US 2, West US 3 Europe, Middle East, and Africa: France Central, North Europe, Norway East, South Africa North, Sweden Central, Switzerland North, UAE North, UK South, UK West, West Europe Asia Pacific: Australia East, Central India, Japan East, Korea Central, Southeast Asia Learn more Query performance monitoring telemetry Fabric Database Hub Monitor SQL Server enabled by Azure Arc Supplemental Terms of Use for Microsoft Azure Previews432Views1like1CommentICYMI: New Azure SQL Foundations video series with GitHub samples
Bob Ward and I recently released a series of videos, read more in the original blog post or go directly to the series on YouTube. The Azure SQL Database Foundations series are four videos that take you from your first Hyperscale database to AI features running against your own operational data. We also included how to assess and migrate (with AI and skills!) to Hyperscale in the first place, and the common optimizations you should consider. Every episode ships with a repo, so you can follow along in your own environment instead of watching someone else’s terminal.313Views0likes0CommentsSQLCon is Back: 5 Reasons to Attend the European Microsoft Fabric + SQL Community Conference
5 Reasons to Attend the European Microsoft Fabric + SQL Community Conference This year the SQL community joins Fabric in Europe for the first time at the Microsoft Fabric + SQL Community Conference happening September 28th - October 1st in Barcelona, Spain. Hear the latest announcements and roadmap directly from Microsoft leaders. With a full week of deep technical sessions and workshops covering the topics you care about most across and see how we’re helping solve your most pressing data challenges, from strengthening data sovereignty to powering agentic AI and unlocking trusted, actionable intelligence. And while there’s no shortage of topics, here are a couple of things we’re the most excited about heading to Barcelona: Unify your data (conference) experience With one registration, this event doubles your opportunity to sharpen your skillset with 130+ expert led sessions, workshops, and keynotes coming together in one high- impact week. Mix and match sessions to best meet your learning goals while you move seamlessly across tracks, visit the shared expo, and connect with peers in the community hub, all under one roof. The ultimate SQL experience, like only Microsoft can deliver With more than 25 dedicated SQL sessions, whether you’re a DBA or, a developer building AI apps, you can create your custom agenda with the topics you care about most. Pre-day programming is for the builders; bring your laptop and start your week with any of our full- day SQL workshops for the demos, practical guidance, and repeatable patterns you can start using immediately. Tuesday kicks off the official event with our opening keynote, three corenotes, and general sessions focused on SQL Server 2025, Azure SQL, and SQL in Fabric. Learn the latest in performance, tuning and tools like SSMS and VS Code delivered directly from SQL experts, MVPs, and community leaders. Ready to start building your agenda? Try our new session planner to curate your schedule based on your interests. The backdrop: Barcelona This year’s conference takes place in the historic, vibrant city of Barcelona, set along the Mediterranean Sea, the ideal setting for the first European SQLCon. When you’re ready for a break, you’re only a 15-minute ride away from the city center, perfect for exploring Gaudí’s iconic architecture or enjoying some local bites. Don’t miss the wrap- up celebration taking place in Barcelona’s exclusive Sutton Club. Community Connection SQLCon is more than just sessions; we’re bringing together more than 4,000 of the most dedicated Microsoft community members together for a week of endless connection opportunities. The Community Hub will bring some of our most popular experiences to life, from in-person meetups and user group connections to hands-on learning and certification opportunities all designed to help you grow your skills and expand your network. Launching Soon: SQLCon TV Enjoyed catching all the behind-the-scenes action on FabCon TV? In Barcelona we’ll bring SQLCon TV to the stage, with the content, demos, and interviews every SQL fan will want to see. Save your spot today. The earlier you register, the more opportunities you have to take advantage of early pricing specials. See you in Barcelona!333Views0likes0Comments3 Reasons Enterprise SQL Server Migrations Slow Down - and How to Avoid Them
Summary Many of Enterprises around the globe have relied on SQL Server for over 3 decades to run their mission critical business applications. Their SQL Server estates face pressure from downtime risk, cost volatility, end of support timelines and modernization demands. As these customers get ready to modernize their data to use the latest capabilities of A.I and cloud native application trends, they want to migrate and modernize their SQL Servers to use Azure SQL with a modernization strategy built on confidence of customer success. Enterprise migrations rarely fail because of migration tools. They slow down because organizations struggle to answer three questions: How much downtime can we tolerate? What will it cost after migration? Are we choosing the right target platform? The organizations that answer these questions early move faster and with less risk. For the DB Administrators, Data architects, application architect and cloud-cost decision makers there are important technical considerations before, during and after data modernization to avoid long term costs and operational concerns. The Microsoft SQL Team has helped many customers modernize their SQL. We discuss important guidelines that can help resolve the 3 major concerns that block or slow SQL Server migration and modernization in Enterprises. This is covered in the episode of DataExposed for which this companion blog goes into the details. What are important triggers that cause customers and partners to consider SQL modernization? There are many business triggers that force Enterprises to migrate their data to public cloud. As SQL Server 2012 to SQL Server 2016 are already in the end of support stage of their lifecycle, customers need to upgrade SQL Server in place or migrate to AzureSQL. Due to cyber security threats, customers are feeling more vulnerable to attackers. Moving their data into a secure environment is essential for protecting not just their data but their business. Customers are reporting the need to free up IT dollars to invest into other parts of the business that may need it more. These may be anything from datacenter contract expirations, need for Hardware refreshes to software license renewals. As the business grows or becomes cyclical, there is surge in demand. Capacity constraints become a barrier for such expansions. These are triggers that cause them to rethink their data modernization strategy. Data modernization and moving the data to a elastic, scalable, secure and resilient data platform such as Azure SQL, becomes essential. The Three Migration Blockers However, data modernization and migration is not without any risk. Based on our customers experience, here are three key reasons that we have commonly encountered that halt or slow down SQL modernization. 1. Downtime Risk Business stakeholders often require strict service level commitments before authorizing production cutovers. Even when migrations are technically feasible, organizations may delay projects if they believe downtime windows could impact revenue, customer experience, or regulatory obligations. Most customers are still offered offline migration paths which can take hours to days, even though zero-downtime migrations are possible which take seconds to minutes. 2. Cost uncertainty Many modernization projects are approved based on expected cost savings. However, if infrastructure sizing, licensing assumptions, storage consumption, or disaster recovery requirements are not evaluated properly, the actual operational cost can exceed initial expectations. Cost uncertainty often slows executive approval processes and extends migration timelines. 3. Compatibility and Feature Fit When migrating SQL Server, Azure SQL has several deployment offerings from IaaS to PaaS. These include SQL Server on Azure VM, Azure SQL Managed Instance, Azure SQL DB Hyperscale and Azure SQL in Microsoft Fabric. Many customers maybe using SQL Server features like Cross-database queries, CLR, SSIS, SQL Agent, and linked servers. They make a safe decision to lift and shift migrate to SQL Server on Azure VMs IaaS instead of modernizing to a PaaS service like Azure SQL Managed Instance. However, in the process, they lose the opportunity to use the PaaS capabilities, manageability and AI/Fabric capabilities in Azure by making this choice. Enterprise Architects, Application Architects, Database developers and DB Administrators have to make the right choice taking both development as well as operational costs and compatibility when they make their SQL modernization decisions. Here are best practices some of the biggest and successful SQL migrations have used to make the migration and modernization journey with confidence. While we cannot disclose specific customer names, these guidelines are based on helping many large to small Enterprise customers. Azure SQL Managed Instance as the Resiliency Anchor Azure SQL Managed Instance is often the platform that helps organizations overcome all three concerns simultaneously because it combines near-full SQL Server compatibility with platform-as-a-service benefits. Azure SQL Managed Instance (Azure SQL MI) Next-gen General Purpose is now generally available, bringing a built-in performance and scale upgrade for General Purpose workloads, including up to 500 databases per instance, up to 32 TB storage, lower latency, and higher IOPS. The release also adds more flexible cost-performance tuning with independent vCore, IOPS, and memory scaling, plus faster management operations to adapt to changing workload demand. For enterprise SQL Server modernization, this positions Azure SQL MI as a stronger path for high-compatibility migrations that need better price-performance without moving to a full replatform. Let us dive deeper into how this helps address the downtime risk concerns by enables three levels of resiliency and high availability features. Local Redundancy Azure SQL Managed Instance provides first layer of Local Redundancy — built into every Azure SQL MI instance at no extra cost. Azure SQL Managed Instance uses local redundancy by default to keep workloads available during node, VM, rack, maintenance, and other local failures within a single datacenter, with Service Fabric orchestrating failover. In General Purpose (including Next-gen GP), this is implemented as stateless compute plus remote stateful storage; during failover, the engine process moves to another compute node and reattaches data, which can cause temporary performance impact due to cold cache. In Business Critical, local redundancy uses multiple synchronized replicas with local SSD storage (Always On-like architecture), enabling fast failover and read scale-out on secondaries.Next-gen General Purpose is an architectural upgrade to the existing General Purpose service tier that uses an upgraded remote storage layer that stores instance data and log files on Elastic SAN instead of page blobs and maintains it locally. Local redundancy protects against local infrastructure issues. This gives you a 99.99% SLA but not full datacenter/zone disasters, so zone redundancy (where supported) or disaster recovery (DR) options like failover groups/geo-restore are needed for broader resilience. Zone Redundancy The second layer is Zone Redundancy, which is accomplished placing data replicas across availability zones. Your Azure SQL MI resources are distributed across multiple availability zones within a region. This protects against the failure of an entire datacenter because each Azure availability zone is a separate physical location with independent power, cooling and networking. It relies on synchronous replication using zone-redundant storage for General Purpose. For Business critical, it uses Always On Availability group replicas across zones for Business Critical. Always On availability group technology replicates data changes from the primary instance to standby replicas in other availability zones. In the event of an outage, there's an automatic failover that seamlessly transitions one of the standby replicas to be prima. These replicas are always in sync — which means zero data loss. Failover typically happens in under 30 seconds, and your SLA jumps to 99.995%. Failover Groups The third layer is Failover Groups. This is your cross-region disaster recovery solution. It asynchronously replicates all user databases to a secondary Azure SQL MI instance in a different Azure region. Because it is asynchronous replication, there is potential for momentary data loss in the case of a datacenter outage. But it still protects the data against the worst case failure — a full regional outage. If the replica is a standby replica, there is no license required and it is used only for disaster recovery. Using these options, business stakeholders can get their assurance that they have Enterprise grade availability and resiliency platform of AzureSQL for running their mission critical workloads. You can read more about these HA and Resiliency options in Microsoft Learn. Cost Governance for Enterprise Buyers The total cost of data modernization and migration is not a one-time estimate but an ongoing one. In this case, Azure SQL MI provides Enterprise DB Administrators many levers through pricing model choice, right-sizing, elasticity, serverless options and dev/test free tiers. Let us explore how these can be combined for smart cost estimations. Lets also look at the best offering for the cost-conscious Enterprises - Azure SQL DB Hyperscale. With Azure SQL DB Hyperscale, you get the SQL Server engine, T-SQL compatibility, High Availability, Disaster recovery, security, backups, and management all bundled into the service price. No separate cost for SQL Server license. Hyperscale separates compute and storage that can scale independently and does not force you to overprovision. You have to only pay what you use which is ideal for seasonal workloads, Dev/Test, SaaS applications, predictable daytime trends, and up to 60% savings when you use Elastic pools. Azure Hybrid benefit (AHB)- Azure Hybrid Benefit lets you bring your existing SQL Server investments to Azure and reduce compute costs, accelerating your ROI from cloud migration while preserving all the benefits of Azure SQL Azure SQL DB Free offer – is the strongest product offering. Enterprises can use all features of Azure SQL at no cost for up to 10 Azure SQL DB free-tier. 100,000 vCore-seconds of serverless compute per month, 32GB data storage, 32 GB backup storage, serverless auto-scaling and auto-pause if you hit the limit per month. Run your POCs at no cost and evaluate before you move to Azure SQLDB, especially SMB& some enterprise Azure SQL Managed Instance also offers 1 free Azure SQL MI instance per Azure subscription giving you 720vCore hours per month, 64GB storage, up to 500 databases, automated backups and 12 months free. And if data migration is not possible due to data compliance or data proximity purposes, Azure Arc Pay-As-You-Go (PAYG) gives you cloud-style SQL licensing for servers running anywhere—on-premises, at the edge, or in other clouds. Instead of making large up-front licensing investments, you only pay for SQL Server while it's running, while still gaining access to Azure Arc management, security, monitoring, and modernization capabilities. For seasonal, variable, or growth-oriented workloads, PAYG can improve cash flow and reduce licensing complexity. Reserved instances allow Enterprise customers to commit to using Azure SQL resource for a period of one or three years to receive a significant discount. This option combined with AHB can save you even more up to 80%. We have a comprehensive licensing guide for on-premises SQL Server for your reference. Azure SQL enables a variety of cloud cost-models for a wide range of enterprise workload needs to help Enterprise cloud cost decision makers and DB Administrators make the right choice for their workloads. Target selection guidance While Azure SQL has multiple deployment options to migrate your on-premises work loads, it is critical to make the right choice long term. Customers can install SQL Server on-premises, they can use Azure SQL deployment options, and also run SQL Server in other clouds like Amazon Web Services and Google Cloud. If there is an Enterprise workload that is not ready to modernize, you have the ability to lift and shift into SQL Server in Azure VM. It is a low cost migration option, because the application does not need any modification and it gives DB Administrators full control over the SQL server and underlying Windows or Linux OS. This can be a first step to modernization for some customers who are risk-averse. For those Enterprise customers who are willing to modernize their workloads and SQL Server instances, Azure SQL DB Hyperscale is the best option. Azure SQL Database Hyperscale helps organizations modernize their most demanding database workloads with virtually unlimited growth, high performance, and cloud-scale economics. Customers can scale storage and compute independently, support large multi-terabyte databases, accelerate application performance with read-scale replicas, and eliminate the operational complexity of managing infrastructure, backups, patching, and high availability. They can build cloud-native applications or cloud-enable existing applications. However, if Enterprise customers want good compatibility with their on-premises SQL Server but continue down the modernization path - their best option is Azure SQL Managed Instance. They can modernize the instance and not impact the application as there is no application change required. Applications will continue to work and the DB Administrators do not need to worry about managing infrastructure and all the overhead that comes with managing, self-managing your SQL Server virtual machines. For SQL Server customers, PostgreSQL may look like an attractive low cost option. However, it requires re-platforming that could add significant hidden cost due to retraining all their DBAs and their developers to do performance optimization, performance best practices and operational maintenance. Lastly, our same SQL engine is also available to customers as a SaaS-ified version, Fabric SQL database as well. All these options use the exact same SQL engine which makes it easier for Database developers and DB Administrators continue to use the same expertise, tools and process. Making the right choice of Azure SQL deployment is not just on the fastest way to modernize but the right long term approach. Conclusion and Next steps Enterprise SQL Server migrations rarely stall because of migration technology. More often, they are delayed by concerns around downtime, cost predictability, and platform selection. Organizations that address these questions early can accelerate modernization while reducing operational risk. Azure SQL provides multiple modernization paths—from SQL Server on Azure Virtual Machines to Azure SQL Managed Instance and Azure SQL Database—allowing organizations to balance compatibility, operational simplicity, resiliency, and cost efficiency based on their business requirements. As modernization initiatives accelerate, the most successful projects are those that treat migration not as a one-time infrastructure event, but as a long-term platform strategy. Whether its the newest and the fastest way for us to migrate customers, we have all the comprehensive Copilot enabled AI-assisted migration tooling, technical training and support you need. Look for more blogs, whitepapers, guides and training based on best practices used real-world data modernization projects.425Views0likes0CommentsGenerally Available: Microsoft Entra Server Principals and Server Roles for Azure SQL Database
The problem we're solving Previously, Microsoft Entra identities in Azure SQL Database could only be created as contained database users - principals scoped to a single database with no server-level presence. That meant: No granular server-level delegation. You couldn't assign a server role such as ##MS_ServerStateReader## (to query DMVs across databases) or ##MS_LoginManager## (to manage logins) to an Entra principal. Only the Entra admin or a SQL login could perform these server-scoped tasks. Per-database provisioning overhead. Each Entra principal had to be created separately as a contained database user in every database that required access, with no way to inherit server-scoped permissions. No centralized “disable” switch. Offboarding meant tracking down a contained database user in every database - there was no server-level login to disable. These gaps forced many teams to keep SQL authentication for administrative tasks, even when they wanted to go password-less with Entra. What changes with GA Microsoft Entra logins become first-class server principals in the logical master database, just like SQL logins. This capability has been in public preview on Azure SQL Database (and is already generally available on Azure SQL Managed Instance and SQL Server 2022+); with this release it reaches general availability on Azure SQL Database, unlocking three things for production use: 1. Server role assignment for Entra identities Azure SQL Database's seven fixed server-level roles can be assigned to Entra server principals(logins). These roles cover database connectivity, database management, definition and security-definition reads, login management, and server-state read/manage. This means you can give your monitoring service principal read-only DMV access across all databases (##MS_ServerStateReader##), delegate login management to a security team member (##MS_LoginManager##), or let a DevOps app create databases (##MS_DatabaseManager##). All without SQL auth, all with Entra identities. 2. Server-wide login model Instead of provisioning contained users independently in every database, you can create database users mapped to a server login (CREATE USER ... FROM LOGIN). These users inherit server-scoped permissions automatically. One login, many databases — managed from a single place. For the T-SQL syntax, see Create and utilize Microsoft Entra server logins. 3. Centralized logins enable/disable ALTER LOGIN [user@contoso.com] DISABLE - one command blocks that identity from connecting to every database on the server. No more hunting down per-database users during an offboarding or incident response. When you re-enable the login, access is restored everywhere. Note: ALTER LOGIN ... DISABLE applies only to login-based users, not contained database users. It blocks new connections only; existing sessions remain active until terminated with KILL if needed. For immediate effect, see cache propagation. Microsoft Entra group logins are not supported; see the server principals documentation for alternatives. What does this unlock for your organization Ability to go password-less. With server principals and roles now generally available, organizations can adopt Entra-only authentication without a remaining server-level functionality gap. Entra logins bring parity with SQL logins closer, making it practical to disable SQL authentication entirely and using Entra as the sole authentication path. Least-privilege administration. Server-level roles simplify permission management by enabling customers to delegate common management and monitoring responsibilities without requiring admin privileges, enabling adherence to least privilege and separation of duties at scale, while making administration across databases on the same logical server much easier. Server roles let you scope access precisely, previously, the only server-wide option for an Entra identity was the all-powerful Entra admin. Give your security auditors ##MS_SecurityDefinitionReader## role instead of 'db_owner'. Give your monitoring tools ##MS_ServerStateReader## instead of an over-privileged administrator role. Zero-touch DevOps. A service principal with ##MS_DatabaseManager## and ##MS_LoginManager## can automate database and user provisioning end-to-end. After the initial Entra admin bootstrap, no human needs to be in the loop for routine operations. Faster incident response. When a principal is compromised, disable the login at the server level. New connections are blocked across all databases immediately - without needing to know which databases the user had access to. To cut off active sessions immediately, flush the authentication caches and KILL existing sessions. Geo-replica support. Entra logins created on the primary server are automatically available on geo-replicas, with read-only access to replicated databases. Key things to know Bootstrap requirements. The Microsoft Entra admin must create the first Entra login. After that, any Entra principal with ALTER ANY LOGIN or ##MS_LoginManager## membership can create additional logins. Entra admin takes precedence. If a principal is both the Entra admin and has a login, the admin permissions win. The login permissions have no additional effect. Cache propagation. Role membership and permission changes take effect on the next connection. For immediate effect, clear the auth cache with DBCC FLUSHAUTHCACHE and DBCC FREESYSTEMCACHE('TokenAndPermUserStore'). EXECUTE AS LOGIN is not supported for Entra logins on Azure SQL Database (it is supported on Managed Instance). Get started Configure a Microsoft Entra admin on your logical server Create your first Entra login and assign server roles (step-by-step tutorial) Understand the server roles and their permissions Consider enabling Entra-only authentication to eliminate SQL auth entirely Ready to migrate from SQL Authentication? If you're looking to move your existing SQL logins to Entra, check out Securing Azure SQL Database with Microsoft Entra password-less authentication - migration guide. It walks through the end-to-end journey from SQL auth to Entra, including how to identify SQL login dependencies, convert them to Entra principals, and enable Entra-only mode. Learn more Microsoft Entra server principals (logins) - full reference: syntax, permissions, limitations. Azure SQL Database server roles - role descriptions, permission matrix, examples. Microsoft Entra authentication overview - how Entra auth works with Azure SQL. Manage logins and users - login lifecycle management.803Views1like1CommentLessons Learned #540:Bulk Insert Throughput in Azure SQL Hyperscale with Partitioned Heap Tables
In this lesson learned, I would like to share an interesting scenario working on a service request where our customer was running a high-volume data load process in Azure SQL Database Hyperscale. The workload was based on a common pattern: Recreate a staging table. Load a large number of rows using bulk insert. The bulk insert showed unstable execution times and became the main area to investigate. The process was loading a very large number of rows into an Azure SQL Database Hyperscale database. The process used a staging table that was initially loaded as a heap. The main concern was the inconsistent execution time during the load process. Why Manually Adding Data Files Was Not the Right Direction In Azure SQL Database Hyperscale, the storage architecture is different from a traditional SQL Server deployment. The data layout and storage management are handled internally by the service. Because of this architecture, manually creating or pre-allocating multiple data files is not the same tuning option that we may consider in SQL Server on-premises or SQL Server running on Azure Virtual Machines. For this reason, the troubleshooting focus moved from manual file layout configuration to the actual workload pattern, waits, concurrency, batch size, and staging table design. What We Observed During the bulk insert phase, waits such as PAGELATCH_EX were observed. Since the staging table was loaded as a heap and the clustered primary key was created only after the bulk insert completed, OPTIMIZE_FOR_SEQUENTIAL_KEY was not directly applicable to the bulk insert phase. This changed the direction of the investigation. Instead of focusing on last-page insert contention on an existing clustered index, the analysis moved toward heap insert behavior, allocation contention, concurrency, batch size, and whether a different staging table design could help. First Recommendation: Start with Low-Impact Changes Before changing the table design, the first recommendation was to test the least intrusive changes: Reduce the number of concurrent bulk insert sessions. Increase the batch size, for example from 10,000 rows to 50,000 or 100,000 rows. Test TABLOCK on the dedicated heap staging table. The goal was to avoid assuming that more concurrency would always reduce the total execution time. In some high-volume load scenarios, excessive concurrency may increase contention and make the process less stable. The Interesting Design Option: Partitioned Heap Staging Table One of the most interesting design options was to evaluate a partitioned heap staging table. The idea is simple: instead of loading all rows into a non-partitioned heap staging table, the staging table can be created on the same partition scheme used by the target table, using the same partitioning column. This does not mean that a partitioned heap will always be faster. However, it can be a useful design option when: The bulk load phase is affected by allocation or latch contention. Concurrent load processes can naturally distribute rows across different partition ranges. The staging table is used only as an intermediate structure.Lessons Learned The main lessons from this scenario were: In Azure SQL Database Hyperscale, manually managing multiple data files is not the right tuning direction. PAGELATCH_EX during heap loading may point to concurrency or allocation-related contention. Reducing concurrency can sometimes improve total throughput. Larger batch sizes may provide better results than many small batches. TABLOCK on a dedicated heap staging table is a low-impact test worth evaluating. A partitioned heap staging table can be a valid second-phase design option when the load can be distributed across partition ranges. The best approach is to test small, measurable changes before introducing architectural redesigns. Final Thoughts A partitioned heap staging table can be a powerful option, but only when it is tested carefully and when the workload pattern can benefit from partition distribution.202Views0likes0CommentsRegex support for LOB types in T-SQL—available in Azure SQL & SQL Server 2025
At a glance — Native regular expression (regex) functions in T-SQL now accept varchar(max) and nvarchar(max) inputs of up to 2 MB across all seven regex functions, including the two table-valued functions (REGEXP_MATCHES and REGEXP_SPLIT_TO_TABLE). This capability ships in SQL Server 2025 CU5 and is already available in Azure SQL Database, SQL Database in Fabric and Azure SQL Managed Instance configured with the Always-up-to-date update policy. It will reach Managed Instances on the SQL Server 2025 update policy as part of the CU5 rollout. You no longer need to split log files, HTML documents, or large JSON payloads into 8,000-byte chunks just to run a pattern match. 1. Introduction Regular expressions have long been a cornerstone of modern data processing — used for validation, parsing, transformation, and extracting structured insights from unstructured text. With SQL Server 2025 and Azure SQL, regex is now a first-class T-SQL capability, removing the historical need to rely on SQLCLR functions or application-tier processing. While the initial release made native regex broadly available, large-object (LOB) inputs were not yet supported on every function. CU5 closes that gap. Under the hood, T-SQL regex implements POSIX Extended Regular Expression (ERE) semantics, augmented by a curated set of Perl-style features, and is powered by the RE2 engine. RE2 is a linear-time, non-backtracking implementation, which means it is not susceptible to catastrophic backtracking (a class of denial-of-service issue commonly known as ReDoS). That guarantee becomes far more important when the input is a 1.8 MB log blob than when it is an 8,000-byte string. Release timeline Milestone What shipped Ignite 2025 — General Availability Regex went GA in SQL Server 2025 and Azure SQL. LOB inputs were initially supported only on REGEXP_LIKE, REGEXP_COUNT, and REGEXP_INSTR. LOB support on REGEXP_REPLACE and REGEXP_SUBSTR was deferred, and the two table-valued functions (TVFs) accepted only non-LOB string types. Azure SQL (post-GA service updates) LOB inputs enabled across all seven functions. SQL Server 2025 CU5 LOB inputs up to 2 MB enabled on all seven functions in the SQL Server. What’s new in CU5 varchar(max) and nvarchar(max) inputs are accepted on every regex function. The input string is capped at 2 MB per function call. The pattern is still capped at 8,000 bytes, which is far larger than any maintainable regular expression should ever need. Behavior is consistent between Azure SQL and SQL Server, so code you write today is fully portable. Note — The 2 MB limit applies to the input passed to a single function call, not to the column or row. A single value in a varchar(max) column can still store up to 2 GB; the constraint is that no single regex evaluation can consume more than 2 MB of that value. Prerequisites SQL Server 2025 CU5 or later, or Azure SQL Database, or SQL Database in Fabric or Azure SQL Managed Instance configured with the SQL Server 2025 / Always-up-to-date update policy. The two table-valued functions (REGEXP_MATCHES and REGEXP_SPLIT_TO_TABLE) require database compatibility level 170, unless the database-scoped configuration ALLOW_BUILTIN_TVF_IN_ALL_COMPAT_LEVELS (preview) is enabled. Note — On Azure SQL Managed Instance (Always-up-to-date), this capability is rolling out region by region. It is already live in regions where the rollout has completed and will light up in the remaining regions as the deployment finishes. Instances on the SQL Server 2025 update policy will receive it as part of the CU5 rollout — coming soon. Verify compatibility level (170 required for the TVFs) – SELECT name, compatibility_level FROM sys.databases WHERE name = DB_NAME(); -- If necessary: -- ALTER DATABASE [<your-database>] SET COMPATIBILITY_LEVEL = 170; 2. Working with LOB Data This section demonstrates the CU5 capabilities against a realistic LOB data. We build a LogEntries table whose RawPayload column holds multi-KB to multi-MB chunks of web server and application output, plus an HtmlPages table for HTML cleansing examples. 2.1 Create the sample schema and data IF OBJECT_ID('dbo.LogEntries', 'U') IS NOT NULL DROP TABLE dbo.LogEntries; IF OBJECT_ID('dbo.HtmlPages', 'U') IS NOT NULL DROP TABLE dbo.HtmlPages; CREATE TABLE dbo.LogEntries ( LogId BIGINT IDENTITY(1,1) PRIMARY KEY, Source SYSNAME NOT NULL, IngestedAt DATETIME2(3) NOT NULL DEFAULT SYSUTCDATETIME(), RawPayload VARCHAR(MAX) NOT NULL -- LOB column ); CREATE TABLE dbo.HtmlPages ( PageId INT IDENTITY(1,1) PRIMARY KEY, Url NVARCHAR(2048) NOT NULL, Body NVARCHAR(MAX) NOT NULL -- LOB column (Unicode) ); Now generate realistically large rows. The REPLICATE(CAST(... AS varchar(max)), n) pattern is required because REPLICATE returns NULL when the result would exceed 8,000 bytes unless its first argument is a max type. -- Synthetic web access-log payload (~252 KB in row 1, plus a separate ~586 KB row). DECLARE @logLine VARCHAR(500) = '127.0.0.1 - alice [21/May/2026:10:15:32 +0000] "GET /api/orders/42 HTTP/1.1" 200 1532 ' + 'user-agent="Mozilla/5.0" ip=10.0.0.7 email=alice@contoso.com card=4111-1111-1111-1234' + CHAR(10); DECLARE @bigLog VARCHAR(MAX) = REPLICATE(CAST(@logLine AS VARCHAR(MAX)), 1500) -- ~252 KB + '127.0.0.1 - mallory [21/May/2026:10:16:01 +0000] "POST /login HTTP/1.1" 500 0 ' + 'ip=203.0.113.99 ssn=123-45-6789' + CHAR(10); INSERT INTO dbo.LogEntries (Source, RawPayload) VALUES ('web-01', @bigLog), -- ~252 KB ('web-02', REPLICATE(CAST('OK ' AS VARCHAR(MAX)), 200000)); -- ~586 KB -- Synthetic HTML page (~775 KB / ~396,000 characters). DECLARE @htmlChunk NVARCHAR(MAX) = N'<div class="row"><p>Hello <b>world</b>! Contact <a href="mailto:bob@contoso.com">bob</a>.</p></div>'; INSERT INTO dbo.HtmlPages (Url, Body) VALUES (N'https://contoso.example/page-1', N'<html><head><title>Big Page</title></head><body>' + REPLICATE(@htmlChunk, 4000) + N'</body></html>'); -- Confirm payload sizes in bytes. SELECT LogId, Source, DATALENGTH(RawPayload) AS PayloadBytes FROM dbo.LogEntries; SELECT PageId, DATALENGTH(Body) AS BodyBytes, LEN(Body) AS BodyChars FROM dbo.HtmlPages; Results: LogId Source PayloadBytes 1 web-01 258,110 2 web-02 600,000 PageId BodyBytes BodyChars 1 792,124 396,062 Before CU5, feeding any of these payloads into REGEXP_REPLACE, REGEXP_SUBSTR, REGEXP_MATCHES, or REGEXP_SPLIT_TO_TABLE would have failed with a type-mismatch error or required a LEFT(RawPayload, 8000)-style truncation. The same queries now run end-to-end. 2.2 REGEXP_LIKE — Filter rows by LOB content -- Find logs that contain at least one HTTP 5xx response. SELECT LogId, Source, DATALENGTH(RawPayload) AS PayloadBytes FROM dbo.LogEntries WHERE REGEXP_LIKE(RawPayload, '"[A-Z]+\s[^"]+\sHTTP/1\.[01]"\s5[0-9]{2}\s'); REGEXP_LIKE is a Boolean predicate: it evaluates to true when the pattern matches anywhere in the input and false otherwise. Because it returns a Boolean rather than a bit, use it directly in WHERE, CASE WHEN, IIF, or CHECK constraint contexts — do not compare it with = 1 or = 0 (the parser rejects that syntax). Note — REGEXP_LIKE itself requires database compatibility level 170. The other scalar regex functions (REGEXP_COUNT, REGEXP_INSTR, REGEXP_REPLACE, REGEXP_SUBSTR) are available at all compatibility levels. Results: LogId Source PayloadBytes 1 web-01 258,110 2.3 REGEXP_COUNT — Counting at scale -- Per-row tally of GET requests, POST requests, and 5xx responses -- across the entire LOB payload. SELECT LogId, Source, REGEXP_COUNT(RawPayload, '"GET\s') AS Gets, REGEXP_COUNT(RawPayload, '"POST\s') AS Posts, REGEXP_COUNT(RawPayload, '\s5[0-9]{2}\s') AS ServerErrors FROM dbo.LogEntries; Results: LogId Source Gets Posts ServerErrors 1 web-01 1,500 1 1 2 web-02 0 0 0 2.4 REGEXP_INSTR — Locate the first error -- 1-based character position (or 0 if no match) of the FIRST 5xx response in each payload. SELECT LogId, Source, REGEXP_INSTR(RawPayload, '\s5[0-9]{2}\s', 1, 1, 0) AS FirstErrorPos FROM dbo.LogEntries; Parameter recap: REGEXP_INSTR(string, pattern, start, occurrence, return_option [, flags [, group ]]). A return_option of 0 returns the starting position of the match; 1 returns the position immediately after the last character of the match. Results: LogId Source FirstErrorPos 1 web-01 258,072 2 web-02 0 2.5 REGEXP_REPLACE — Redact sensitive data in place PII redaction over LOB payloads was one of the most-requested CU5 scenarios. Before CU5, it required a custom chunked-replace routine; it is now a single expression. -- Redact credit-card-shaped tokens, U.S. SSN-shaped tokens, and email addresses -- across the entire payload. SELECT LogId, REGEXP_REPLACE( REGEXP_REPLACE( REGEXP_REPLACE( RawPayload, '\b[0-9]{4}[- ]?[0-9]{4}[- ]?[0-9]{4}[- ]?[0-9]{4}\b', '****-****-****-****'), '\b[0-9]{3}-[0-9]{2}-[0-9]{4}\b', '***-**-****'), '\b[A-Za-z0-9._%+\-]+@[A-Za-z0-9.\-]+\.[A-Za-z]{2,}\b', '[redacted-email]' ) AS RedactedPayload FROM dbo.LogEntries; Or strip every HTML tag from an nvarchar(max) page in a single call: SELECT PageId, LEN(Body) AS OriginalLen, LEN(REGEXP_REPLACE(Body, N'<[^>]+>', N'')) AS TextOnlyLen FROM dbo.HtmlPages; Results — the ~775 KB HTML document collapses from 396,062 to 100,008 characters of plain text in a single call: PageId OriginalLen TextOnlyLen 1 396,062 100,008 2.6 REGEXP_SUBSTR — Extract a single value -- Pull the first IPv4 address out of each log payload. SELECT LogId, REGEXP_SUBSTR(RawPayload, '\b(?:[0-9]{1,3}\.){3}[0-9]{1,3}\b', 1, -- start position 1, -- occurrence 'c', -- flags: case-sensitive 0 -- group: 0 returns the whole match ) AS FirstIp FROM dbo.LogEntries; To return the contents of a specific capture group instead of the entire match, pass its 1-based group number as the final argument. Results: LogId FirstIp 1 127.0.0.1 2 NULL 2.7 REGEXP_MATCHES — Every match, set-based This is where the combination of TVF and LOB delivers the largest productivity gain: extract every structured value from a megabyte of unstructured text in a single set-based query, with no client round-trips. REGEXP_MATCHES returns one row per match with these columns: Column Type Description match_id bigint Sequence number of the match (1-based). start_position int 1-based start index of the match. end_position int 1-based end index of the match. match_value same type as string_expression The entire matched substring. substring_matches json JSON array describing each capture group, with the shape [{"value":"…","start":N,"length":N}, …]. -- Every email address in every log payload, alongside its row of origin. SELECT l.LogId, m.match_id, m.match_value AS EmailFound FROM dbo.LogEntries AS l CROSS APPLY REGEXP_MATCHES( l.RawPayload, '\b[A-Za-z0-9._%+\-]+@[A-Za-z0-9.\-]+\.[A-Za-z]{2,}\b' ) AS m ORDER BY l.LogId, m.match_id; Capture groups are even more useful — you can project the parts of every log line as columns by reading from the substring_matches JSON document: -- Parse Common-Log-Format-ish entries into ip, user, status, and bytes columns. -- The pattern has four capture groups, accessed below as $[0] through $[3]. SELECT l.LogId, m.match_id, JSON_VALUE(m.substring_matches, '$[0].value') AS Ip, JSON_VALUE(m.substring_matches, '$[1].value') AS UserName, JSON_VALUE(m.substring_matches, '$[2].value') AS Status, JSON_VALUE(m.substring_matches, '$[3].value') AS Bytes FROM dbo.LogEntries AS l CROSS APPLY REGEXP_MATCHES( l.RawPayload, '^([0-9.]+)\s-\s(\S+)\s\[[^\]]+\]\s"[^"]+"\s([0-9]{3})\s([0-9]+)', 'm' -- multi-line: ^ and $ anchor to each line, not just the whole input ) AS m ORDER BY l.LogId, m.match_id; Important — Without the 'm' flag, the ^ anchor matches only at the start of the entire 250 KB input, so you would receive exactly one match for the first line. The multi-line flag is what unlocks per-line extraction. Results (first two parsed rows): LogId match_id Ip UserName Status Bytes 1 1 127.0.0.1 alice 200 1532 1 2 127.0.0.1 alice 200 1532 2.8 REGEXP_SPLIT_TO_TABLE — Shred a LOB into rows -- Project the entire log payload as one row per non-empty line. SELECT l.LogId, s.ordinal AS [LineNo], s.value AS LineText FROM dbo.LogEntries AS l CROSS APPLY REGEXP_SPLIT_TO_TABLE(l.RawPayload, '\r?\n') AS s WHERE l.LogId = 1 AND s.value <> '' ORDER BY s.ordinal; You now have a tabular projection of a multi-megabyte text blob without leaving the engine. You can feed it into a CTE, aggregate it, join it to dimension tables, or materialize it into a staging table — all set-based. Results (first three rows): LogId ordinal LineText (first 80 chars) 1 1 127.0.0.1 - alice [21/May/2026:10:15:32 +0000] "GET /api/orders/42 HTTP/1.1" 200 1 2 127.0.0.1 - alice [21/May/2026:10:15:32 +0000] "GET /api/orders/42 HTTP/1.1" 200 1 3 127.0.0.1 - alice [21/May/2026:10:15:32 +0000] "GET /api/orders/42 HTTP/1.1" 200 Tip — composing LOB regex pipelines — CROSS APPLY (and OUTER APPLY when you need to preserve rows that produce no matches) is the primary composition primitive. You can stack REGEXP_SPLIT_TO_TABLE (lines) feeding REGEXP_MATCHES (fields per line) feeding ordinary aggregates, all within a single query plan. 2.9 The 2 MB ceiling — strategies for larger inputs The 2 MB limit applies to the input string of a single regex call. If the value passed to a regex function exceeds 2 MB, the call raises an error (error number 19311, severity 16) rather than silently truncating. That is the intended behavior — silent truncation would hide correctness bugs. In practice, 2 MB is a generous ceiling: a single log file or HTML document of that size is already unusual, and most real-world LOB data sit comfortably below it. When individual values do exceed the limit, the most reliable approach is to split them into smaller logical units before they land in the column you want to query — for example, by writing one log line, one document section, or one record per row at ingestion time. Because every regex function (including the two TVFs) shares the same 2 MB ceiling, sharding at query time is not generally feasible; doing it at the load path keeps every regex call well under the limit and avoids per-query workarounds. Bytes vs. characters — The 2 MB limit is measured in bytes, not characters, and the byte count is based on the UTF-8 encoding of the input regardless of the column’s declared type. ASCII characters take 1 byte each, so plain ASCII text can run to roughly two million characters; non-ASCII characters take 2–4 bytes in UTF-8, so fewer characters fit. Keep in mind that DATALENGTH() reports storage size in the column’s own encoding, which may differ from the UTF-8 byte count used by the limit, and LEN() (which counts characters) is best avoided as a sizing check here. To measure the UTF-8 byte length that the limit actually checks, cast the value to varchar(max) under a UTF-8 collation and take its DATALENGTH: SELECT DATALENGTH( CONVERT(varchar(max), Body COLLATE Latin1_General_100_CI_AS_SC_UTF8) ) AS Utf8Bytes FROM dbo.HtmlPages; Anything above 2 * 1024 * 1024 (2,097,152) bytes will be rejected by a regex call on that value. Have a scenario that genuinely needs more than 2 MB? If your workload requires regex evaluation on individual values larger than the current 2 MB ceiling, we would like to hear about it. Please share the details — data shape, payload size, pattern, and business need — on the Azure SQL feedback portal. Customer feedback directly informs how we prioritize future limit changes. 2.10 Cleanup DROP TABLE IF EXISTS dbo.LogEntries; DROP TABLE IF EXISTS dbo.HtmlPages; 3. Summary What changed in CU5 Before CU5 — LOB inputs were accepted on REGEXP_LIKE, REGEXP_COUNT, and REGEXP_INSTR. The remaining functions — REGEXP_REPLACE, REGEXP_SUBSTR, and the two TVFs (REGEXP_MATCHES, REGEXP_SPLIT_TO_TABLE) — required non-LOB string inputs, which often meant truncating with LEFT(..., 8000) or chunking in the application tier. After CU5 (and already in Azure SQL) — All seven functions accept varchar(max) and nvarchar(max) inputs of up to 2 MB. The pattern remains capped at 8,000 bytes. Quick reference Function Returns LOB input (CU5) Common use case REGEXP_LIKE Boolean (predicate) Yes Filter rows in WHERE / CASE / CHECK predicates REGEXP_COUNT int Yes Count occurrences of a pattern REGEXP_INSTR int Yes Position of the nth match REGEXP_REPLACE string Yes Redact, cleanse, or normalize text REGEXP_SUBSTR string Yes Extract a single value REGEXP_MATCHES (TVF) (match_id, start_position, end_position, match_value, substring_matches) Yes Extract every match plus capture groups (via JSON), set-based REGEXP_SPLIT_TO_TABLE (TVF) (value, ordinal) Yes Split a LOB into rows by a regex delimiter Further reading Official documentation: REGEXP_LIKE, REGEXP_COUNT, REGEXP_INSTR, REGEXP_REPLACE, REGEXP_SUBSTR, REGEXP_MATCHES, REGEXP_SPLIT_TO_TABLE. Regular expressions overview. SQL Server 2025 CU5 release notes. Closing thought. Native regex was already a significant quality-of-life improvement when it became generally available. CU5 completes the picture: every function, every input size up to 2 MB, every shape — scalar or table-valued. The next time you are tempted to export a column out of the database in order to grep it, try one of the seven regex functions first. Happy matching. 🧠440Views0likes0CommentsUnexpected PITR Charges from restorableDroppedDatabases After BC → Hyperscale Migration
Why This Behavior Is by Design When migrating an Azure SQL Database from Business Critical (BC) to Hyperscale using a manual cutover, some customers notice unexpected Point-in-Time Restore (PITR) backup storage charges appearing under the following resource: /Microsoft.Sql/servers/<server>/restorableDroppedDatabases/<database> At first glance, this can be confusing—especially when: No customer-initiated drop or delete was performed The database is online and healthy post-migration Test migrations may not have shown similar charges This post explains why this happens, why it is expected by design, and how these charges naturally expire. The Observed Scenario After a BC → Hyperscale manual cutover, customers may see PITR charges tied to: restorableDroppedDatabases/<database-name> Despite the database being active and available in Hyperscale, these charges start appearing immediately after the migration cutover and gradually decrease over time. Why Does the Database Appear as “Dropped”? During a manual cutover migration, Azure SQL performs an internal platform-driven workflow to complete the transition between architectures. From a control-plane perspective: The source Business Critical logical database is internally dropped This drop is not initiated by the customer It is a required system step to complete the Hyperscale migration Telemetry confirms that the migration workflow transitions through states such as: Internal drop of the source physical and logical database Cleanup of metadata and completion of the migration This entire sequence completes within seconds and is fully platform managed. Why Are Backup Charges Generated? Although the source BC database is internally dropped, its pre-migration PITR backups are still retained according to the configured backup retention period. Here’s the key point: Backups taken before upgrading to Hyperscale are retained and billed using the dropped-database backup billing model. Because the source database is now considered dropped (from the BC perspective): The 1× database-size discount no longer applies The full data file size is added to the billable backup size Charges appear under restorableDroppedDatabases This behavior is explicitly documented as expected in internal Azure SQL billing guidance. Why Do Charges Decrease Over Time? These charges are not permanent. They: Decrease daily Continue only while the pre-migration PITR backups are retained Automatically stop once the retention window expires In practical terms: Charges stop when: days_since_migration > configured_backup_retention_days No cleanup action is required from the customer—the platform handles this automatically. Why Didn’t Test Migrations Show Similar Charges? In many reported cases, test or smaller databases migrated using the same method did not generate noticeable charges. This can be explained by two documented optimizations: Backup size threshold – very small backup footprints are not charged Low activity optimization – inactive or low-change databases generate fewer snapshots As a result, smaller or lightly used test databases may fall below the billing threshold, while larger production databases do not. Is This a Billing Error or Credit Scenario? No. Although the operation is platform-driven: The behavior is by design The charges are for temporary retention of valid PITR backups They naturally expire based on retention Therefore, this scenario is not considered a billing defect and does not typically warrant credits. How Can Customers Reduce Charges Faster? If needed, customers can: Reduce the PITR backup retention period (minimum is 1 day) Wait up to 24 hours for billing to reflect the change This shortens how long the pre-migration backups are retained and billed. FAQ – restorableDroppedDatabases Charges After BC → Hyperscale Migration Q1: Why am I seeing PITR charges for restorableDroppedDatabases when my database is still online? A: During a Business Critical → Hyperscale manual cutover, Azure SQL internally drops the source BC database as part of the migration workflow. While the Hyperscale database is active and healthy, the pre‑migration BC backups are retained and billed under restorableDroppedDatabases. Q2: Did the customer initiate a drop or delete operation? A: No. This drop is platform‑driven and required to complete the migration. It is not initiated by the customer. Q3: What exactly is being billed? A: The charges are for Point‑in‑Time Restore (PITR) backups taken before the migration. These backups are retained according to the configured backup retention period and are billed using the dropped database billing model. Q4: Why does the cost appear higher than expected? A: Once a database is considered “dropped” (from the BC perspective), the 1× database-size discount no longer applies, and the full data file size is included in the billable backup size. Q5: Will these charges continue indefinitely? A: No. The charges decrease daily and automatically stop once the pre‑migration backups expire based on the configured PITR retention period. Q6: Why didn’t this happen with smaller or test databases? A: Smaller or low‑activity databases may fall below the backup billing threshold, or benefit from low‑activity snapshot optimizations, resulting in no visible charges. Q7: Is this a billing bug or credit-worthy scenario? A: No. This behavior is by design and expected. The charges reflect valid backup retention and do not typically qualify for credits. Q8: Can the customer reduce these charges sooner? A: Yes. The customer can reduce the PITR backup retention period (minimum 1 day). Billing changes usually reflect within up to 24 hours. Key Takeaways The behavior is expected and by design Charges come from pre-migration BC backups, not the active Hyperscale database The database was internally dropped as part of migration, not by the customer Charges decrease daily and stop automatically No action is required unless the customer wants to reduce retention early Final Note As of the time of writing, this behavior is not clearly described in public customer-facing documentation, which explains why it often appears unexpected. Awareness of this mechanism can help set correct expectations when planning BC → Hyperscale manual cutover migrations.238Views0likes0Comments