evaluation
29 Topics
Your Agents Need More Than a Place to Run
In architecture reviews with enterprise teams moving their first agentic applications toward production, I often hear the same plan: the team has containerized their agent and intends to run it on the managed Kubernetes cluster the organization already trusts. The reasoning is sensible, since the platform team knows the tooling and security has approved the network model, and for the first use case or two it is often the right call. Having watched this unfold in my years leading AgenticAI customer engineers and forward deployed engineers, and now helping customers reach production on Azure, I want to describe what happens next, before leaders commit rather than after. One thing to note is Azure supports multiple ways to build and operate agents. Foundry Agent Service provides an integrated managed runtime around your agent code. Azure Kubernetes Service supports teams that need Kubernetes-level control or want to extend an established platform, while Azure Container Apps provides managed container hosting. These services can work together. The decision is which capabilities and responsibilities best fit the workload. Where the cluster is the right answer A stateless retrieval application, a document extraction pipeline, or a classification job is a web service that happens to call a model, and a container platform runs web services well. A large retail customer of mine ran an invoice extraction agent on containers for over a year with almost no issues, and I never suggested they move it. The cluster remains the right home for several other situations as well. LLM invocations embedded inside existing microservices, event driven, or batch pipelines fit container platforms naturally. Genuine constraints such as air-gapped or sovereign environment, regions where a managed service is not yet offered are a good reason to run your own stack, and strong engineering team that already operates at that level can be a real asset. Even when the agents themselves move to a managed runtime, the tool servers, business APIs, and data services those agents call, often stay on your cluster, so they are complementary far more often than they are competitors. The problem is that these early wins can make agents seem like just another workload. Where the wheels come off The first failure is the state. A research agent that plans, searches, and synthesizes for ninety minutes is a long-running stateful process, while a Kubernetes pod is a disposable container the scheduler may restart at any time. A financial services team I worked with lost costly research run to a routine node upgrade, and responded as capable engineers do by building checkpointing, a durable store, and a resume mechanism. It worked, but they now owned a piece of infrastructure they had to keep correct as their agent's framework changed beneath it. A managed agent runtime absorbs this. Hosted agents in Foundry Agent Service, as one example, give every session a VM-isolated sandbox with a persistent file system, a durable state store that survives crashes and restarts and can hold checkpoints for frameworks such as LangGraph or Microsoft Agent Framework, and a resilient execution mode that recovers long-running work after a process interruption. The second is the human-in-the-loop. A commercial insurance customer’s claims agent needed sign-off from an adjuster and sometimes a second reviewer, with days between steps. Stopping an agent cleanly at the moment it needs a decision, holding its full session for four days without paying to keep it running, and resuming it correctly when the approval arrives is not something a container orchestrator gives out the box. The team built agent session suspend and resume, a queue, a durable state store, notifications, and an approval interface, and ended up with a small workflow engine nobody had planned to own. In hosted agents, an idle session is deprovisioned with its state persisted and restored onto fresh compute when the same session ID returns, so an agent waiting on an approval cost nothing while it waits, and sessions are retained for up to thirty days of inactivity. The approval experience remains yours to design, which is where your engineers' time should go. The third is multi-turn conversation, which quietly pushes teams into building their own context management system. The first version appends each turn to history, and within few turns the history outgrows the context window while cost and latency climb. So, the team adds truncation, then summarization, then retrieval of earlier turns, then per-user and per-tenant scoping, then expiry and deletion rules for privacy. An industrial customer's safety compliance assistant, with conversations stretching across days, followed exactly this path and ended up with a bespoke thread store and summarization pipeline nobody had budgeted for. Its first serious incident came when a summary silently dropped a compliance-relevant instruction. With the Responses protocol in hosted agents in Foundry, conversation history is a durable, platform-managed record keyed by a conversation ID and reachable from any channel, so the thread store is no longer yours to build, although deciding what to summarize or retrieve remains a design choice for your agent. The fourth is identity. On a cluster, the path of least resistance is a shared service account, and in one review a security architect asked which actions had been taken on behalf of which user, only to learn that the logs could not say. Hosted agents create a dedicated Microsoft Entra agent identity for each agent at deploy time, use on-behalf-of flows to act with the user's delegated permissions in interactive scenarios and the agent's own identity in autonomous ones, and keep the agent identifiable for audit in both cases. The fifth is per-user session isolation, which is the difference between an agent that serves many people and an agent that mixes them up. Agents read files, run code, and hold working data, and on a shared pod the default is that many users share a process, a file system, and often a cache. Giving every user session its own sandboxed environment and storage, so that one person's documents and intermediate results can never surface in another's, means engineering hard isolation boundaries and proving them to your security team. Hosted agents make a VM-isolated sandbox per session the default, and their durable state store can partition items per end user, so one store is safe to share across the users of a multitenant agent. And lastly, Evaluation and optimization are where the gap widens. The largest difference between teams that scale and those that stall is evaluation. Because agents are probabilistic and multi-step, staging tests often miss failures such as a wrong tool choice or a policy violation deep in a task. One customer’s agent passed every offline check but degraded unnoticed for weeks after a model update because evaluation stopped at release. Mature teams continuously evaluate production traces, combine automated judges with sampled human review, and red-team regularly.Once quality is measurable, teams can deliberately balance prompts, models, tools, latency, and cost. One team cut per-task cost by routing simple steps to smaller models after evaluation confirmed quality held. Self-built stacks require teams to assemble and maintain tracing, datasets, judges, and release gates. Hosted agents instead combines default OpenTelemetry traces with continuous evaluation, adversarial testing, and datasets generated from agent instructions. Staged closed-loop optimization uses those traces to improve instructions, tool descriptions, and model selection without extra plumbing. The real cost is the velocity gap Leaders usually expect me to quantify the initial build, and that is the smaller number. A team of four building the first agent often becomes ten or twelve within a year, and a growing share of them are maintaining a runtime for agents rather than building agents that serve the business. The enterprise has quietly created an internal agent infrastructure company in a field where the patterns for memory, tools, evaluation, and safety are rewritten every few months, while hyperscalers put hundreds of engineers on exactly this problem and ship at a cadence no single platform group can match. Foundry Agent Service, for instance, bundle content safety guardrails into the runtime and route outbound traffic through a customer virtual network, capabilities that platform teams otherwise assemble one integration at a time. This plumbing does not differentiate your organization, so the question is whether your scarcest engineers should spend years on it or on the workflows, data, and judgment only your company has. This is also why the technology companies held up as examples are a poor template. Many built their own runtimes because managed options did not yet exist and had large platform organizations to carry the load. Even they tend to invest in a custom runtime for the first handful of use cases and then migrate as managed services mature, because the maintenance burden compounds while the strategic value of owning the plumbing does not. What I would do as the leader I am not arguing against Kubernetes or for moving everything tomorrow. Comparable managed runtimes exist across the hyperscalers, and I use hosted agents as the running example only because it is the one I know best from the inside. Managed agent services are still maturing, some workloads have real data residency or customization needs, and abstraction always constrains something. What I am arguing for is a deliberate choice for each use case, guided by three questions: whether the agent must outlive a single request by running long, waiting on humans, or remembering across sessions whether it must act with its own identity, auditable delegation, and policy enforcement whether your team would be building anything a managed service already provides, and who will still maintain it in two years. Key takeaways Match the runtime to the workload. Containers on your existing cluster suit stateless, short-lived agents, while long-running, human-in-the-loop, and memory-dependent agents need capabilities your platform team was never hired to build. Count the hidden team. The real cost of self-hosting is the growing group of engineers maintaining state, identity, memory, guardrails, and tracing instead of solving business problems. Make evaluation continuous and connected to production traces. Pre-release testing alone will miss the drift and trajectory failures that hurt you, and optimization of quality, cost, and latency depends on that evaluation data. Follow the pattern of the leaders, not their early architecture. Companies that built custom runtimes did so before managed options matured, and most of them move toward managed services as those options improve. A practical place to begin is your roadmap for the next twelve months. Sort each use case into stateless and short-lived or long-running and human-dependent, and for every agent in the second group put a price on the engineers who would maintain the runtime rather than the business logic. I would like to hear how you have drawn this line, and where a managed service was not yet ready for something you needed.339Views1like0CommentsBeyond the Trace: The Science of Insight Quality
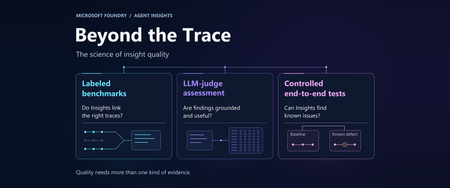
Co-authors and reviewers: Morteza Ziyadi, Hanchi Wang, Han Che, Billy Hu, Sean Gayler, Nishal Dsilva, Avinav Jami, Ankit Singhal, Augustus Arthur TL;DR. Insights in Foundry turns recurring agent behavior into evidence-linked findings developers can review and act on. We evaluate trace linkage, finding quality, and detection of known issues using labeled benchmarks, LLM-judge assessment, and controlled end-to-end tests. What is an Insight? An Insight is a reviewable finding about recurring agent behavior. It brings together an explanation, supporting trace evidence, and a possible next step, helping developers investigate a pattern rather than inspect each execution in isolation. Depending on the available evidence and supported configuration, an Insight can include: Part of an Insight What it gives the reviewer Title and description The recurring behavior and an evidence-based explanation of a possible cause. Linked traces The broader group of traces associated with the finding. Highlighted traces Representative examples to open and check against the explanation. Category, severity, and status Context for triaging the finding, not a substitute for a risk assessment. Agent version and recency Which version is represented and when the finding was created. Proposed action or fix An investigation or improvement path; concrete proposals depend on the configuration. Figure 1. An Insight detail view in Microsoft Foundry, cropped from public Microsoft Learn documentation. The description, evidence, and proposed fix support human review. This UI illustration is not a benchmark result; the source link provides a full-size view. UI source and field definitions: Insights in Foundry documentation. From trace search to an actionable review queue Production agents can generate thousands of traces containing model calls, tool calls, latency, token usage, errors, and final responses. Observability shows what happened, while evaluations test criteria a team already knows to measure. The harder problem is discovering repeated behavior that the team did not know to predefine. Insights in Foundry analyzes traces from the Application Insights resource connected to a Foundry project and organizes recurring behavior into reviewable Insights. Depending on the evidence and supported configuration, an Insight can include representative traces, affected agent versions, severity, an explanation of a possible cause, and a recommended next action. Concrete prompt or code proposals are available only for supported agent types and configurations; other Insights provide general investigation or remediation guidance. Insights in Foundry is now available in public preview. It analyzes production traces to surface recurring behaviors and regressions with supporting evidence and suggested areas for investigation or improvement. Developers remain in control: review the cited traces and validate proposed changes through normal evaluation and deployment practices. During public preview, we will continue expanding the experience based on customer feedback. To make this concrete, Figure 2 maps 220 inputs from TraceElephant, a public agent-trace benchmark, to seven generated Insights. Figure 3 examines one linked trace. Figure 2. Recorded links from 220 public TraceElephant inputs to seven generated Insights in the September 17 benchmark. The 80-input finding includes the looping trace examined in Figure 3. Titles are editorial paraphrases; the layout is editorial, not a product screenshot or a validation of each diagnosis. Figure 3. A public TraceElephant trace contains 54 model calls; steps 26, 30, 34, 38, 42, 46, and 50 repeat an identical extraction plan. The September 17 benchmark run of the production pipeline links this trace to a finding about missing progress-aware termination. Wording is paraphrased; this is an illustration, not product UI. The proposed intervention still needs evaluation. Three complementary ways to evaluate Insight quality Insight quality involves which inputs a finding links, how well it explains the evidence, and whether it identifies known issues in controlled tests. We combine labeled trace evaluation, unlabeled finding assessment, and controlled end-to-end testing. These are complementary sources of evidence, not mutually exclusive dataset categories. Evidence Question Assessment / results Labeled trace evaluation Do Insights link inputs that reference annotations mark as failing? Reference labels; trace precision and trace recall (%). Unlabeled finding assessment Are generated findings grounded and useful? Eight-dimension LLM judge; mean score (1-5). Controlled end-to-end tests Do Insights identify known injected issues? Known issues and healthy baselines; detections, misses, unsupported findings, duplicates, and unscored cases. Here, 'unlabeled' means reference failure labels are not used for the evaluation; the sources can still contain annotations or reference answers. Public versus internal describes where data comes from, not how it is evaluated. LLM judges can also assess findings from labeled or controlled scenarios. Labeled evaluation: Do Insights link the right traces? Trace precision: among unique benchmark inputs linked by at least one generated Insight, the fraction marked as failing. This measures discrimination only when a dataset includes healthy inputs, and it does not validate the diagnosis. Trace recall: the percentage of failure-labeled benchmark inputs linked by at least one generated Insight. It does not measure how many distinct failure modes were discovered. We evaluated the production pipeline on the same 746 benchmark inputs (653 failure-labeled) on September 15, 16, and 17, 2026. Repeating these inputs does not create 2,238 distinct examples. The six benchmark corpus slices come from public agent-trace research datasets with human reference annotations: AgentRx (Tau-bench retail), AgentRx Magentic-One, TRAIL, AgentErrorBench, TraceElephant, and the MAST-Data human subset. AgentErrorBench is the annotated failure-trajectory dataset released with AgentDebug, a framework for detecting and recovering from agent failures. The two AgentRx slices come from the same public release. The benchmark uses selected and normalized inputs from these releases, not a representative sample of customer production traffic. For each dataset, the chart shows daily generated-Insight counts and trace recall. The table reports equal-weight means of daily trace precision and recall. These datasets support ongoing development; results depend on the dataset and model used. Labeled results Figure 4. Generated Insight count versus trace recall for all six public corpus slices. Each point is one daily run; labels retain values where markers overlap. Recall measures linkage to failure-labeled inputs, not diagnosis correctness. Three-day mean precision and recall follow in the table. Dataset Inputs/day Failure-labeled/day Linked/day range Mean trace precision Mean trace recall AgentRx (Tau-bench retail) 102 29 43-45 37.8% 57.5% AgentRx Magentic-One 58 44 54-57 75.3% 94.7% TRAIL 148 143 139-140 96.9% 94.6% AgentErrorBench 200 200 194-196 100.0%** 97.3% TraceElephant 220 220 218-220 100.0%** 99.7% MAST-Data (human subset) 18 17 14-16 93.3% 82.4% ** When every input is failure-labeled, 100% trace precision cannot measure false-positive control. What the labeled results show High precision can reflect the corpus base rate. AgentErrorBench and TraceElephant contain only failure-labeled inputs, so their measured precision is 100% by construction. TRAIL, AgentRx Magentic-One, and the MAST subset also contain mostly failures; their precision values are close to their underlying failure-label prevalence. Read precision beside trace recall and each dataset's label prevalence rather than as a standalone quality score. AgentRx (Tau-bench retail) is the clearest mixed-traffic stress test. Only 29 of 102 inputs were failure-labeled. Across the three days, trace precision was 43.2%, 37.8%, and 32.6%, averaging 37.8%; trace recall was 65.5%, 58.6%, and 48.3%, averaging 57.5%. Daily linked counts were 44, 45, and 43, including 19, 17, and 14 labeled failures respectively. These daily rates are averaged before rounding. Some linked inputs without failure labels could contain issues outside the reference labels, such as cost or latency, but this benchmark cannot confirm that. Trace precision and trace recall measure whether Insights link inputs that reference annotations mark as failing. They do not establish whether an explanation is correct or a proposed action is useful. Our unlabeled evaluation examines those qualities using an eight-dimension LLM judge. Unlabeled evaluation: Are the findings grounded and useful? For this evaluation, a separate LLM judge scores generated Insights against the supplied input evidence, without using reference failure labels to compute precision or recall. These scores are automated assessments produced by an LLM judge. They are not human ratings and do not establish that a proposed action will improve the agent. This evaluation covers PUPA, FailSafeQA, tau2-bench, synthetic scenarios, and an internal production dataset for the monitoring dashboard agent compiled from Microsoft employee usage. These sources are normalized into benchmark inputs; not every input is a complete execution trace. The eight-dimension judge rubric Each generated Insight receives a score from 1 to 5 on eight dimensions. The rubric separates the quality of the explanation, the importance of the issue, and the usefulness of the suggested action: Dimension Question the judge considers Actionability Does the Insight tell a developer what to investigate, evaluate, or change next? Specificity Does it name concrete behavior, tools, or prompt elements rather than offer generic advice? Novelty Does it surface a pattern beyond an obvious dashboard signal? This is an estimate, not a measurement of what a team already knows. Correctness Is the claim supported by the supplied evidence? Severity calibration Does the assigned severity match the evidenced impact? Impact How consequential does the underlying issue appear, rather than just how well it is described? Fix specificity Does the proposed fix identify an exact asset or behavior to change? Fix applicability Is that proposed change plausibly on target for the issue? For example, a concrete next step earns a stronger actionability rating than generic advice. Severity calibration and impact are deliberately separate: a minor issue can have a well-calibrated severity label without being high-impact. Fix applicability is judged from the proposal and evidence; the fix is not executed as part of this scoring. Unlabeled results Results compiled from two recent benchmark runs cover 4,496 inputs and 40 generated Insights. Every emitted Insight in these selected snapshots was scored with the same judge rubric. Each Insight's overall score is the mean of its eight dimension scores; the table then averages those overall scores within each dataset. We do not combine datasets into one quality score. Dataset Inputs Insights scored Mean judge score (1-5) PUPA 901 5 3.53 FailSafeQA 1,101 11 3.57 Monitoring dashboard agent (internal) 1,342 4 3.88 tau2-bench 1,112 16 2.84 Synthetic scenarios 40 4 3.81 These are per-dataset snapshots, not a controlled comparison of dataset difficulty or pipeline versions. Small Insight counts and grading choices, such as grouped versus individual judging, make these protocol-specific diagnostics rather than stable absolute ratings. Automated judge scores are not precision or recall, human ratings, or measured improvements after applying a fix. The dimension-level scores make the weak spots more concrete. Fix specificity was the lowest-scoring dimension in four of the five snapshots, with means from 2.00 to 2.64. For tau2-bench, correctness was lowest at 2.25: a signal to review whether claims are supported by the supplied evidence. Making a next step more concrete and grounding a diagnosis more carefully are different improvement targets. What the public findings look like The examples below connect generated findings to concrete input evidence: an arithmetic inconsistency, a question/answer mismatch, and a payment allocation that exceeds the available balance. They are selected illustrations, not a representative sample of the 40 scored Insights. Figure 5. Three illustrative findings, with one checked input per finding. Titles and evidence summaries are editorial paraphrases. PUPA is a normalized QA record; FailSafeQA normalization pairs a perturbed question with the original answer, creating the displayed mismatch. Neither is a new agent execution. Tau2-bench shows a recorded tool interaction. These examples are not a representative quality sample. Public input sources: PUPA; FailSafeQA; tau2-bench. Controlled end-to-end tests: Can Insights find known issues? Dataset benchmarks are complemented by tests with healthy baseline agents and versions containing predefined defects. The framework generates traffic, runs Insights on the resulting traces, and compares the findings with the known issues and supporting evidence. It separately tracks detections, misses, unsupported findings, and duplicates. Cases with incomplete evidence remain unscored rather than counting as passes or misses. The September 23 hosted-agent report, used here as a concrete illustration, covered finance, travel, and support-ticket scenarios. Of 12 expected issues, 11 were scorable and 10 were detected. All three scorable healthy baselines had no confirmed unsupported findings. The figure shows the full outcome counts, including the missed and unscored cases. This end-to-end framework is separate from the 40-input synthetic-scenarios dataset in the unlabeled results. Figure 6. Controlled tests exercise healthy baselines and known defects through the Insights pipeline. The September 23 report records 10 detections among 11 scorable expected issues, one additional unscored issue, and no confirmed unsupported findings on three scorable baselines. No confirmed unsupported findings (noise) or duplicate findings were reported in the evaluated subset. This illustrative snapshot is not a representative product-wide rate. A broader view of quality Trace selection and rubric review are part of a broader quality framework. Category agreement is an exploratory benchmark diagnostic, not an assessment of the portal's category labels. Controlled scenarios also check for unsupported or duplicate findings. Figure 7. Five complementary quality questions. The labeled results above measure trace precision and trace recall; the unlabeled results assess findings with an LLM judge. Category agreement is an internal diagnostic, while controlled scenarios check noise and duplication. How we track quality over time Labeled benchmarks, unlabeled assessment, and controlled tests feed recurring quality reports and human investigation. Test inventories and assessment conditions can change, so daily scores are not automatically a comparable improvement trend. The reported results do not establish longitudinal recurrence or deduplication performance across runs. In the portal, Give feedback lets users report incorrect findings, categories, severity, grouping, or duplication. Start with scenarios whose expected failures and healthy controls are known. Track detection, trace precision, categorization, severity, distinctness, evidence grounding, and action quality instead of relying on one score. Review changes to data, models, prompts, and evaluation contracts as changes to the measurement system. Investigate weak results and newly reported failure patterns rather than tuning only for an aggregate. Keep human review in the loop, because benchmark labels and automated graders cannot determine business impact or remediation correctness. How practitioners should interpret an Insight Validate each Insight before acting on it. Microsoft Learn recommends this review sequence: Confirm the affected workflow, agent version, category, severity, and time. Open the highlighted traces and verify that the cited behavior is present. Compare problematic examples with healthy traces to test whether the grouping and likely cause are plausible. Decide whether the issue belongs to the agent, a tool, a model endpoint, a data source, or the platform. Turn confirmed recurring behavior into evaluation coverage, an optimization objective, owner routing, or a monitored no-action decision. An empty result does not prove that an agent is healthy, and a large linked-trace count does not prove business impact. Quality depends on representative traces, complete telemetry, a supported analysis model, and careful human validation. Get started Start with the Insights in Foundry documentation for prerequisites, portal steps, evidence-review guidance, SDK examples, pricing considerations, and preview limitations. Prerequisites include a connected Application Insights resource, recent representative traces, a supported GPT-5-or-newer Judge model deployment, and the required role assignments. Insight generation, including scheduled runs, uses your model deployment and can incur model charges. See the current documentation for the latest supported agents, models, regions, limits, pricing, and UI guidance. Python samples: on-demand Insights and scheduled Insights. Closing thoughts Agent quality work often starts with a simple question: what is repeatedly going wrong that we did not know to test? Insights in Foundry is designed to help teams answer that question with evidence-linked findings and a reviewable next step. Measuring those findings requires explicit definitions, diverse data, honest treatment of weak results, and human judgment where automated metrics stop. Labeled trace evaluation, unlabeled rubric assessment, and controlled end-to-end tests answer complementary questions. Newly observed patterns can then inform the next round of evaluation and review.394Views0likes1CommentVoice agents in Foundry Agent Service: architecture, trust boundaries, and real-audio latency
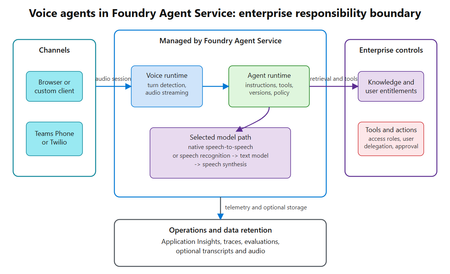
Assess where voice agents in Foundry Agent Service simplify the runtime, where enterprise trust boundaries remain, and what a 300-turn real-audio benchmark reveals about latency across six configurations.237Views0likes0CommentsEvaluate More, Spend Less: Batching Microsoft Foundry Evaluators for Efficient Evaluation
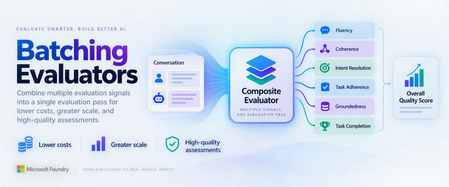
Authors: Salma Elshafey, Ali Mahmoudzadeh, Kayla Ames, Ahmad Qardahji, Vivek Bhadauria, Morteza Ziyadi, April Kwong A single agent trajectory may need to be evaluated for groundedness, coherence, instruction following, task completion, and correct tool use. In a conventional pipeline, each evaluator receives the same messages, tool calls, tool results, and tool definitions in a separate model call. As trajectories grow, evaluation repeatedly pays to process the same context. Can one LLM judge call apply five or six evaluators without losing the signal that makes evaluation useful? This study tests a simple design: send the shared context once and ask one composite evaluator to score several criteria in the same call. In summary: On 100-row quality and tool use samples, composite evaluation required 5-6x fewer model calls, reduced total input-token use by 61.25–71.07%, completion tokens by 46.63–63.89%, and measured run wall time by 35.74–46.10%. Across the tested workloads, frontier judge models maintained stable quality across several high-value dimensions. The results support composite evaluation as a cost-efficient default, with targeted individual evaluation for workload-sensitive rubric criteria. Why Evaluation Becomes Expensive Evaluating a single conversation rarely involves just one evaluation dimension. A typical assessment examines multiple dimensions of quality, such as whether the response is coherent, follows instructions, completes the user's task, remains grounded in available evidence, and uses tools correctly. Because each dimension is typically evaluated through a separate prompt and model call, the same conversation trajectory, tool calls, tool outputs, and tool definitions are processed repeatedly. As a result, cost grows with both the number of evaluation criteria and the amount of shared context, making long agent trajectories especially expensive to evaluate. The Composite-Evaluator Approach Rather than evaluating each dimension independently, composite evaluation scores multiple criteria within a single judge-model call, allowing the shared context to be processed once instead of repeatedly. We built two composite evaluators. The Output Quality Evaluator The Output Quality Evaluator scores six Microsoft Foundry evaluators in one LLM call: Evaluator Question Fluency Is the response clear and well formed? Coherence Is it logically consistent with the conversation? Intent Resolution Did the assistant understand the user's goal? Task Adherence Did it follow the user's instructions? Groundedness Are its claims supported by the available evidence? Task Completion Did it complete the requested task? Tool Use Quality Evaluator The Tool Use Quality Evaluator scores five Microsoft Foundry evaluators in one LLM call: Evaluator Question Tool Call Accuracy Was the tool call correct overall? Tool Call Success Did the invocation succeed? Tool Input Accuracy Were the arguments correct? Tool Output Utilization Did the response use the tool output correctly? Tool Selection Was the appropriate tool selected? Each composite prompt includes the shared trajectory and tool definitions once, followed by the full definition, rating scale, and applicability rules for every evaluator. It instructs the judge to assess each evaluator independently so that one verdict does not bias another. The judge returns structured results for each criterion, including a score, rationale, and applicability status. For multi-turn evaluations, it can also identify the earliest turn where a failure occurred. How We Validated Evaluator Quality The study compares individual and composite evaluators across: Two modes: Single-Turn and Multi-Turn. Nine judge models: GPT-4o, GPT-5.4, GPT-5.4 mini, GPT-5.6 Luna, GPT-5.6 Sol, GPT-5.6 Terra, DeepSeek V4 Flash, DeepSeek V4 Pro, and Grok 4.1 Fast Reasoning. Multiple datasets, as shown in the table below Dataset Mode Rows Primary validation target Reference labels Internal quality set Single-Turn and Multi-Turn 283 Six quality evaluators Existing per-evaluator labels Internal tool use set Single-Turn and Multi-Turn 200 Five tool use evaluators Existing per-evaluator labels BFCL v4 Multi-Turn 200 Task Completion, Tool Call Accuracy, and failed-turn localization Deterministic state and tool-call checks AgentIF Multi-Turn 148 Task Adherence Constraint-level majority-vote reference FaithDial Multi-Turn 300 Groundedness Faithful versus hallucinated responses FED Multi-Turn 125 Coherence Five-annotator human scores Tau-Voice Multi-Turn 278 Task Completion Reward-derived completion labels AgentRx tau_retail Multi-Turn 29 Failed-turn localization Human failure annotations We measured several distinct properties: Input tokens, output tokens, model calls, and latency Accuracy, macro-F1, and Cohen's kappa where labels were available Agreement and correlation structure between individual and composite modes Repeatability across four evaluation runs Finding 1: Composites Cut Input Tokens by 61.25–71.07% and Latency by 35.74–46.10% We measured cost and latency on matched 100-row Single-Turn samples: one for Output Quality and one for Tool Use, comparing parallel individual evaluators with one composite evaluator per row. For each row, evaluator context includes the query and response, any tool calls and results, and the serialized tool definitions. Note: Single-turn means that the evaluator's focus is the last agent response only, but the entire conversation history is passed to the evaluator as context. Trajectory Length in the Cost Sample The log-scale distributions show that most rows clustered around a few thousand tokens, with a smaller number of substantially longer trajectories. In both samples, longer evaluator contexts produced larger absolute token savings. The Measured Cost Reduction Across the sample: Repeated context is the main saving. Total input-token volume fell from 2,058,930 to 797,843 for Output Quality, a 61.25% reduction, and from 2,036,122 to 589,097 for Tool Use, a 71.07% reduction. Uncached input fell by 57.51% and 53.29%, respectively. For Output Quality, 52.72% of composite input tokens were cached versus 56.88% across the individual suite; for Tool Use, the figures were 46.22% versus 66.69%. However, the composites still processed substantially fewer tokens overall. Call volume collapses. Output Quality fell from 600 individual evaluator calls to 100 composite calls. Tool Use fell from 494 calls to 100. In six rubric-row combinations, native applicability rules legitimately returned no score, such as when there was no tool call to evaluate; those skips explain why the individual Tool Use baseline is below 500. Measured runs finish sooner. Output Quality wall time fell from 504.41 seconds to 324.12 seconds, a 35.74% reduction, while Tool Use fell from 536.95 seconds to 289.42 seconds, a 46.10% reduction. Per sample row, that is 5.044 to 3.241 seconds for Output Quality and 5.369 to 2.894 seconds for Tool Use. Completion tokens fell by 46.63% and 63.89%, respectively. On the quality sample, the composite used 797,843 total input tokens and 36,919 completion tokens, compared with 2,058,930 and 69,180 for parallel individual evaluation. On the tool use sample, the composite used 589,097 total input tokens and 28,358 completion tokens, compared with 2,036,122 and 78,522. These are measured run totals, not prompt-length estimates. The broader experiments showed the same benefit. The full six-evaluator rubric Single-Turn study used about 68% fewer input tokens, while the 283-row Multi-Turn quality study used about 77% fewer: 28,715 rendered input tokens per row for a six-call equivalent versus 6,608 for the composite call. Exact currency savings depend on model and deployment pricing, but batching consistently removed duplicated input and round-trip overhead. Finding 2: Quality Tradeoffs Depend on Rubric and Judge Model Output Quality Rubric Benchmark Results On the internal Single-Turn quality set, composite Task Adherence accuracy improved for every judge, while Task Completion remained close to individual evaluation. External Multi-Turn benchmarks showed a more varied pattern across rubric, judge, and workload. This figure reports Δκ = κComposite - κIndividual: blue favors composite evaluation and orange favors individual evaluation. The mixed directions reinforce the need to validate the selected rubric and judge on production-like data. BFCL provided the strongest labeled Multi-Turn example for Task Completion. With GPT-5.6 Luna, the composite evaluator reached macro-F1 0.848 and κ = 0.696, compared with 0.836 and 0.672 for the individual evaluator. Across the other judges, composite and individual Task Completion remained close for Sol, Terra, and DeepSeek V4 Flash, while results for DeepSeek V4 Pro and Grok 4.1 Fast favored individual evaluation. Tool Use Quality Rubric Benchmark Results The five-rubric tool composite was evaluated on production-style tool traces. Each row carries ground truth for one source rubric, so the table reports accuracy on the available per-evaluator subsets. Judge Tool Call Accuracy Tool Call Success Tool Input Accuracy Tool Output Utilization Tool Selection gpt-4o 0.800 0.902 0.850 0.800 0.878 gpt-5.4 0.800 0.902 0.775 0.737 0.829 gpt-5.4-mini 0.750 0.902 0.725 0.763 0.756 gpt-5.6-luna 0.914 0.902 0.848 0.775 0.901 gpt-5.6-sol 0.886 0.902 0.750 0.743 0.854 gpt-5.6-terra 0.857 0.902 0.750 0.794 0.854 DeepSeek-V4-Flash 0.775 0.902 0.800 0.848 0.854 DeepSeek-V4-Pro 0.800 0.878 0.800 0.789 0.902 grok-4-1-fast-reasoning 0.946 0.902 0.925 0.745 0.823 Across the production-style corpus, the composite reached 0.75-0.95 accuracy across the five rubric criteria. The results show model-specific strengths: Grok 4.1 Fast led Tool Call Accuracy and Tool Input Accuracy, DeepSeek V4 Flash led Tool Output Utilization, and DeepSeek V4 Pro led Tool Selection. Tool Call Success remained tied at 0.902 for most judges. Luna remained among the strongest overall, but no single judge dominated each of the rubric criteria. Classification Accuracy On the truly multi-turn BFCL benchmark, Tool Call Accuracy is the only tool rubric criterion with native ground truth. GPT-5.6 Terra led the single-run panel at 0.864 macro-F1, followed by GPT-5.6 Sol at 0.858 and GPT-5.6 Luna at 0.828. Other models showed lower results, with Grok 4.1 Fast at 0.626, DeepSeek V4 Pro at 0.625, and V4 Flash at 0.521. This shows that with the correct model, the composite evaluator can classify overall tool-call correctness on full conversations as well as production-style traces. Failure Localization The same BFCL run also tested where failures occurred. GPT-5.6 Terra led at 0.78 member-any failed-turn localization: in 78% of failing conversations, the turn predicted by the Tool Call Accuracy rubric criterion matched at least one turn in BFCL's set of failing turns. It produced 22 false alarms across 75 passing conversations. GPT-5.6 Sol reached 0.75 member-any, and GPT-5.6 Luna reached 0.74. The Tool Selection channel with Luna provided a high-precision secondary signal, identifying a failing turn in 50% of failures with only 3 false alarms. To test whether localization generalizes beyond mechanically checked BFCL traces, we also used the 29-row AgentRx tau_retail set with human failure annotations. On the eight in-scope tool-mechanics failures, Sol localized 8 of 8 root causes, while Terra and Luna localized 7 of 8. Meanwhile, Grok 4.1 Fast only localized 2/8, and the two DeepSeek models 1/8. This result is directional because of the small sample. Does Batching Preserve Rubric Relationships? After testing direct accuracy, we examined whether batching also preserves how rubric verdicts relate to one another. This is supporting structural evidence, not an accuracy measure against ground truth. The heatmaps compare Spearman correlations between GPT-5.6 Luna's binarized rubric verdicts on rows scored by both modes. The tool use structure was especially stable, including the strongest relationship between Tool Call Accuracy and Tool Input Accuracy (0.76 in both modes). Quality relationships were more mixed. For example, Single-Turn Intent Resolution and Task Completion fell from 0.71 to 0.31, while Multi-Turn Task Adherence and Task Completion fell from 0.53 to 0.23. This shows that batching can preserve the broad rubric structure without preserving every relationship equally. Finding 3: Reliability Depends on Both Rubric and Judge Multi-Turn Quality Reliability We repeated the six-evaluator composite call four times on the same 200 BFCL rows. Across the nine-judge panel, DeepSeek V4 Flash had the lowest average flip rate at 3.9%. GPT-5.6 Sol and Grok 4.1 Fast followed at 5.2%, DeepSeek V4 Pro at 5.6%, GPT-5.6 Luna at 6.8%, GPT-4o at 7.4%, GPT-5.6 Terra at 7.8%, GPT-5.4 mini at 10.9%, and GPT-5.4 at 15.6%. The rubric criteria-level result is more important than the leaderboard: Fluency: 0.0% average flip rate Coherence: 2.4% Intent Resolution: 8.6% Task Adherence: 6.7% Task Completion: 11.5% Groundedness: 16.4% The same judge can be highly stable on one rubric criterion and noisy on another. Reliability should therefore be monitored at the criterion level, not inferred from a single aggregate score. Multi-Turn Tool Use Reliability The five-evaluator MT tool study showed the same need for criterion-level monitoring. Across four BFCL repeats, GPT-5.6 Terra and DeepSeek V4 Flash had the lowest average flip rate at 6.0%, GPT-5.6 Sol reached 6.1%, and GPT-5.6 Luna and GPT-4o were at 7.0%. GPT-5.6 Sol achieved the strongest mode-of-four Tool Call Accuracy kappa at 0.759, while Terra led the single-run quality/localization results. Tool Call Success was the most stable criterion, with a 4.7% average flip rate across judges. Practical Recommendations Based on the results across quality, tool-use, localization, and reliability studies, we can derive practical guidance for both judge selection and evaluator batching. Recommended Judges: The GPT-5.6 Family Across the quality, tool-use, localization, and reliability experiments, the GPT-5.6 family consistently delivered the strongest overall results. While individual benchmarks occasionally favored other models or specific GPT-5.6 variants, Luna, Sol, and Terra repeatedly ranked among the top performers and showed the most balanced performance across workloads. Sol was generally the most reliable across repeated quality and tool-use studies, Terra led several BFCL tool-use and failed-turn localization evaluations, and Luna achieved the highest average quality across the tested workloads. For workloads similar to those evaluated here, we recommend starting with GPT-5.6 judges and selecting between Sol, Terra, and Luna based on your specific priorities. When available at a lower deployment cost, Luna is a particularly attractive option because it maintained frontier-level evaluation quality while achieving the strongest average performance in our experiments. By comparison, lower-cost models often involved larger tradeoffs between quality, reliability, and benchmark performance. Exact cost savings depend on model pricing and deployment configuration, so benchmark candidate judges on production-like workloads before optimizing solely for cost. Which Evaluators to Batch These evaluators performed as well in the composite evaluator as they did individually — they're strong candidates for batching right away: Fluency and Coherence — highly stable across all nine judges and repeats Tool Call Success and Tool Selection — robust across the tested judge models Task Completion — close to individual evaluation across benchmarks; slightly stronger with GPT-5.6 Luna on BFCL Tool Call Accuracy, Tool Input Accuracy, and Tool Output Utilization — strong on production-style traces, with accuracy ranging from 0.75 to 0.95 depending on evaluator and judge Which Evaluators to Watch These evaluators showed workload- or judge-dependent results. They can still be batched, but we recommend checking the results on your own data: Task Adherence — performed well on typical conversations but struggled when a single request contained many independent constraints Intent Resolution — results varied across datasets even though agreement was strong in some cases Groundedness — the least consistent evaluator in our tests, with scores changing across repeated runs more often than any other dimension, albeit having better performance on frontier models, like GPT-5.6 Luna and GPT-5.4. If grounding accuracy is critical for your use case, consider keeping the individual evaluator as a fallback Where This Approach Fits Composite evaluation is most effective as a selective default rather than a universal replacement for every standalone evaluator. GPT-5.6 Sol offered the strongest overall balance, Terra led the single-run BFCL tool results, and Luna is the recommended cheaper high-quality option. Judge and rubric selection should therefore be validated on production-like data. The Multi-Turn comparison has one structural boundary: native individual evaluators do not exist for Multi-Turn Fluency and Intent Resolution. The composite evaluator can produce both dimensions, but a direct individual-versus-composite validation is not available for them in that setting. Finally, token savings do not translate to one fixed currency percentage. Pricing varies by model and deployment, while output length and retry behavior vary by workload. Takeaway Composite evaluators are a practical way to remove repeated context from evaluation pipelines. In the updated 100-row comparisons, they reduced total input-token use by 61.25% for six quality evaluators and 71.07% for five tool use evaluators, reducing completion tokens by 46.63–63.89%, while reducing measured run wall time by 35.74% and 46.10%, respectively, and preserving comparable quality across many dimensions. The strongest deployment pattern is selective rather than absolute: start with a model from the GPT-5.6 family; batch the evaluators that remain stable, monitor them independently, and keep focused fallbacks for the evaluators that do not. Composite evaluation is ultimately about removing unnecessary work. By evaluating multiple dimensions in a single judge call, teams can dramatically reduce repeated context processing while maintaining the evaluation coverage needed to monitor production systems. Get Started Start with the composite evaluator on a small set of known-good and known-bad agent conversations. Choose Output Quality to assess the six quality criteria or Tool Use Quality to assess the five tool use criteria. Review each criterion’s score and applicability status, then spot-check the results against individual evaluators for the failure modes that matter most to your application. The GPT-5.6 family is the recommended starting point for judge models. Re-check results when you change the judge model or the domains of conversations being evaluated. Try these evaluators in the Microsoft Foundry portal now. You can explore the docs on how to use them Agent Evaluators for Generative AI - Microsoft Foundry | Microsoft Learn.263Views0likes0CommentsHow to make AI responses faster on Microsoft Foundry: lessons from 2,040 measurements
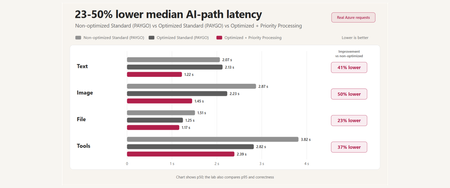
A reproducible Microsoft Foundry performance study covering prompt caching, multimodal input, tool orchestration, MCP lifecycle, Toolbox tool search, and Priority Processing - with correctness and reliability measured alongside latency.338Views0likes0CommentsAuto-Generated Rubric Evaluators: Building Context-Aware Evaluators for AI Agents
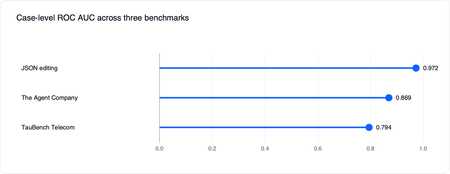
Authors: Shuo Qiu, Sydney Lister, Ilya Matiach, Ali Mahmoudzadeh, Salma Elshafey, José Santos, Vivek Bhadauria, Morteza Ziyadi, April Kwong Why Your Agent Needs a Task-Specific Evaluator Picture a customer-service agent for a telecom company. A customer messages in asking to switch plans and get a refund for last month's overcharge. The agent needs to verify the customer's identity and confirm the new plan before ending the conversation. Miss the verification step and you have a security incident. Those success criteria are specific to this one scenario. The auto-generated rubric evaluator is designed to help address this: use the context you already have to generate a task-specific rubric evaluator that returns a weighted score with per-dimension explanations, then can be reused across iterations. How We Validated Evaluator Quality We validate auto-generated rubric evaluators across four aspects: Verdict Validity — whether judgments on real cases reflect what a competent reviewer would conclude. Rubric Validity — whether generated rubrics capture the task requirements and failure modes. Manual Quality Inspection — whether judgments on real cases look right to a human reviewer. Reliability and Separability — whether judgments are stable across repeated runs and distinguish stronger from weaker candidate agents. Validation Results 1. Agreement with Trusted Reference Signals We first validate the auto-generated rubric evaluator end-to-end: we use the rubric generator to produce the rubric's dimensions, then the rubric evaluator scores each case against them. We use GPT-5.4 for both rubric generator and rubric evaluator. The first question is whether those end-to-end scores move with signals teams already trust. For example, does the rubric evaluator give lower scores to failed cases, and higher scores to successful ones? We start by choosing benchmarks the community already uses as reference points: Dataset What It Tests JSON Editing Deterministic structured-editing tasks where outputs can be checked exactly. TauBench Telecom Customer-service agent tasks requiring policy following, tool use, and task completion. The Agent Company Long-horizon workplace-agent tasks with multi-step tool use. We InspectAI’s 10-case subset. BFCL Multi-Turn Tool Calling Multi-turn function-calling behavior across realistic tool-use scenarios. LiveClawBench Open-ended web-agent tasks that require browsing, interaction, and judgment. Retail-Agent Customer Service Real production-style retail support conversations. We then ask the generation pipeline to generate rubric evaluators for each scenario, and measure the correlation between the evaluator's scores and the trusted reference signals. For the three datasets with per-case reference signals, we can directly check whether the evaluator gives higher scores to successful cases than failed ones. We then create traces from different candidate agents. In these experiments, each candidate agent uses the same task setup and prompt but a different underlying model, which gives us a controlled range of stronger and weaker agent behaviors. Because the evaluator returns a continuous score, we use receiver operating characteristic area under the curve (ROC AUC) when the trusted case-level signal can be read as success versus failure. It measures how often, when comparing a successful case with a failed case, the evaluator assigns the successful case the higher score. In these experiments, generated rubric evaluators align well with trusted signals at the case level, with ROC AUC of 0.794 on TauBench Telecom, 0.869 on The Agent Company, and 0.972 on JSON Editing. An important goal of evaluation is to score candidate agents that perform better on the reference signal also higher by the evaluator. This is more directly relevant when choosing among candidate agents, and it is a more forgiving test of alignment because aggregated scores are less sensitive to noise in individual judgments. We measure this with aggregate candidate-agent Spearman ρ, which checks whether the evaluator ranks candidate agents the same way as the oracle — a ρ of 1.0 means the evaluator's ranking is perfectly aligned with the oracle's, while 0 means no relationship. For BFCL and LiveClawBench, the oracle ranking comes from their official leaderboard scores. At the aggregate candidate-agent level, Spearman ρ ranges from 0.69 on The Agent Company to 0.98 on JSON Editing across all five benchmarks. Aggregation reduces per-case noise, so the candidate-agent ranking is the more relevant view when the goal is agent selection. 2. Rubric Quality on GDPVal GDPVal is a benchmark that measures how well AI models perform real-world, economically valuable work in sectors such as government, manufacturing, and technical services. This benchmark includes a rubric for each task, authored by a domain expert, which is useful for rubric-validity measurement. We ask the rubric generator to produce a rubric for each test case, then use a separate matching judge to match the generated dimensions to the expert dimensions. This gives us two metrics for rubric quality: Recall. For each annotated dimension, did at least one generated dimension express a similar requirement? Precision. For each generated dimension, did at least one annotated dimension express a similar requirement? Under this setup, the generated rubric achieved 72.1% recall and 86.4% precision against the expert dimensions on GDPVal tasks. 3. Manual Quality on Retail-Agent Conversations For a real-world retail-agent customer-service dataset, we generated a rubric with six dimensions, then graded 12 conversations over those dimensions, and manually inspected every case-by-dimension judgment. In this small sample (12 conversations), the reviewer disagreed with only one of the 72 case-by-dimension judgments. Most neutral cases involved applicability questions that the evaluator flagged inconsistently. Reliability and Separability Another key question is how reliable the evaluator's scores are. We look at two things: reliability (does the same case get the same score next time?) and separability (can the evaluator confidently rank two candidate agents against each other?). Reliability If you re-grade the same case tomorrow, do you get the same score? We measure this two ways: single-measure intraclass correlation, ICC(3,1) measures how much of the score variance comes from real case differences rather than repeat noise, and Kendall's W measures rank reliability across repeats — 1.0 means the evaluator ranks cases in the same order every time. On JSON Editing, single-measure intraclass correlation, ICC(3,1), is 0.852 and Kendall's W is 0.767, which means re-running the evaluator on the same case gives similar numbers under repeated runs in this experimental setup. TauBench Telecom shows similarly strong reliability, with ICC(3,1) of 0.85 and Kendall's W of 0.89 under the same recommended configuration. Separability Separability measures whether the score is decisive: when you put two candidate agents side by side, can the evaluator confidently say which one is better? We report mean pairwise bootstrap confidence, which measures ranking stability. For each pair of candidate agents, we resample cases and recompute each agent's mean evaluator score. The pair confidence is the fraction of bootstrap samples supporting the more common ordering: a value near 0.5 means the ordering is unstable, while a value near 1.0 means the evaluator consistently separates that pair. We average this across all candidate-agent pairs. The candidate-agent intervals are tight on JSON Editing and TauBench Telecom. Mean pairwise bootstrap confidence is 0.96 on JSON Editing dataset and 0.95 on TauBench Telecom dataset. Get Started The auto-generated rubric evaluator's results may vary depending on task design, input quality, and evaluation setup. Start with a clear, well-defined description for your evaluation in the prompt field, include as much high-quality context as possible, such as the agent definition and examples, and review the generated rubric carefully before using it. Run it against a small set of known-good and known-bad cases to understand how the score reflects different failure modes. Try the workflow in the Foundry portal and follow the rubric evaluator tutorial. For a demo that covers Rubric in the broader observability workflow, watch the Build breakout session From observability to ROI for AI agents on any framework. For the full set of Build observability announcements, read Build 2026: From observability to ROI for AI agents on any framework.941Views0likes0CommentsEvaluate before you ship: introducing the Voice Live Evaluation Harness
You've built a voice agent on Azure Voice Live. It demos beautifully. Then a teammate asks the question that keeps every voice-agent team up at night: "How do we know it's actually good — across 200 customer calls, not the three we just listened to?" Until today, the honest answer was: put on headphones. Manual listening. Subjective scoring in a spreadsheet. No baseline, no regression signal, no way to defend a model swap with data. We're releasing the Voice Live Evaluation Harness to change that. It's an open-source, deployable evaluation pipeline that runs pre-recorded multi-turn audio through your Voice Live agent and scores every turn with the same evaluators built into Microsoft Foundry — automatically, repeatably, and in parallel. TL;DR Two flavors, one repo. Run the CLI harness locally against a Foundry project for fast iteration, or deploy the evaluation agent into your Azure subscription with the Azure Developer CLI (azd) for a fully-hosted evaluation backend. 13 built-in evaluators score every turn — intent resolution, task adherence, task completion, response completeness, tool-call accuracy, groundedness, and more — viewable per-turn and in aggregate inside the Foundry portal. Supports the three Voice Live modes you actually ship in — Semantic VAD, Push-to-Talk, and Foundry Agent mode — including multi-turn conversations with tool calls and grounding. Grows with your agent. Start with the sample datasets, then layer in audio collected from user testing and production traffic so your evaluation set matures alongside the agent. 🔗 Repo: microsoft-foundry/voicelive-evaluation · Docs: Evaluate Voice Live agents (preview) Why systematic evaluation matters for voice agents Text agents have a mature evaluation story. Voice agents don't — and the gaps actually matter more, because every voice failure happens in real time, in front of a customer, on a phone line you can't easily replay. The Voice Live Evaluation Harness closes that gap with four concrete capabilities: Establish a quality baseline. Run a representative audio dataset through your agent and get scores you can publish as your launch bar. Compare configurations side-by-side. Swap the underlying model (GPT-Realtime 1.5, Azure-Realtime, MAI-Transcribe-1.5), change the voice, tune VAD thresholds — and see exactly which knobs moved which scores. Catch regressions before users do. Wire it into CI and fail the build when intent resolution drops below your threshold. Optimize with data, not vibes. When task-completion drops, drill into the per-turn scores to see whether the agent failed to call the right tool, misunderstood intent, or generated an incomplete response. Keep iterating as production data rolls in. Start with the sample datasets, then grow your evaluation set with audio captured from internal testing, pilot users, and real production traffic. Re-run after every prompt tweak or model swap so the harness becomes a continuous quality signal — not a one-time launch checklist. How it works The pipeline is a five-stage loop: Audio Dataset. Multi-turn audio + expected behaviors in a simple JSONL schema. Four sample datasets ship in the repo (travel planning, complex data analytics, tool-calling tests, batch multi-conversation) so you can run end-to-end on day one. Voice Live API. Pick your Voice Live mode (Semantic VAD, PTT, or Foundry Agent), model, voice, and turn-detection settings via a JSON config file, then stream each turn of audio through the API — locally with the CLI harness, or, if you've deployed the evaluation agent, via the hosted Container App for long-running batches in your own subscription. Transcript + Response. Every turn produces an agent transcript, the model's response, and any tool calls it made — captured automatically for scoring. Foundry Evaluators. 13 built-in evaluators — powered by the same Foundry evaluator models (GPT-4.1-mini and o4-mini) used across Microsoft Foundry — judge every turn on intent resolution, task adherence, tool-call accuracy, groundedness, and more. Quality Scores. Per-turn and aggregate scores land in the Microsoft Foundry portal under your project's Evaluation tab — sortable, filterable, comparable across runs. Then loop. Audio captured from internal testing, pilots, and production traffic feeds back into the dataset — each pass makes the next evaluation more representative of what users actually do. What gets measured The accelerator ships 13 built-in evaluators out of the box, covering the dimensions that matter most for production voice agents: Category Evaluators Intent & task quality Intent Resolution · Task Adherence · Task Completion · Response Completeness Tool calling Tool Call Accuracy · Tool Call Parameter Validity · Tool Result Usage · Tool Call Success Content quality Groundedness · Relevance · Fluency · Coherence Conversational dynamics Turn-taking quality Every evaluator runs against the same Foundry evaluator models (GPT-4.1-mini and o4-mini) that power evaluation across the rest of Microsoft Foundry — so your voice-agent scores are directly comparable to your text-agent scores. Run the CLI locally against your existing Voice Live endpoint If you already have a Voice Live agent deployed and just want fast iteration on a laptop: git clone https://github.com/microsoft-foundry/voicelive-evaluation.git cd voicelive-evaluation/evaluation_harness python -m venv .venv && source .venv/bin/activate pip install -r requirements.txt cp .sample_env .env # Edit .env with your AZURE_VOICELIVE_ENDPOINT python voice_agent_evaluation.py \ --config configs/sample_vad_realtime.json The full walkthrough — dataset schema, configuration reference, score interpretation, and troubleshooting — is in the documentation. Get started Repo: microsoft-foundry/voicelive-evaluation Docs: How to evaluate Voice Live agents (preview) We'd love your feedback — try it, file issues, and tell us which evaluators you wish you had.533Views0likes0CommentsHow Do We Know AI Isn’t Lying? The Art of Evaluating LLMs in RAG Systems
🔍 1. Why Evaluating LLM Responses is Hard In classical programming, correctness is binary. Input Expected Result 2 + 2 4 ✔ Correct 2 + 2 5 ✘ Wrong Software is deterministic — same input → same output. LLMs are probabilistic. They generate one of many valid word combinations, like forming sentences from multiple possible synonyms and sentence structures. Example: Prompt: "Explain gravity like I'm 10" Possible responses: Response A Response B Gravity is a force that pulls everything to Earth. Gravity bends space-time causing objects to attract. Both are correct. Which is better? Depends on audience. So evaluation needs to look beyond text similarity. We must check: ✔ Is the answer meaningful? ✔ Is it correct? ✔ Is it easy to understand? ✔ Does it follow prompt intent? Testing LLMs is like grading essays — not checking numeric outputs. 🧠 2. Why RAG Evaluation is Even Harder RAG introduces an additional layer — retrieval. The model no longer answers from memory; it must first read context, then summarise it. Evaluation now has multi-dimensions: Evaluation Layer What we must verify Retrieval Did we fetch the right documents? Understanding Did the model interpret context correctly? Grounding Is the answer based on retrieved data? Generation Quality Is final response complete & clear? A simple story makes this intuitive: Teacher asks student to explain Photosynthesis. Student goes to library → selects a book → reads → writes explanation. We must evaluate: Did they pick the right book? → Retrieval Did they understand the topic? → Reasoning Did they copy facts correctly without inventing? → Faithfulness Is written explanation clear enough for another child to learn from? → Answer Quality One failure → total failure. 🧩 3. Two Types of Evaluation 🔹 Intrinsic Evaluation — Quality of the Response Itself Here we judge the answer, ignoring real-world impact. We check: ✔ Grammar & coherence ✔ Completeness of explanation ✔ No hallucination ✔ Logic flow & clarity ✔ Semantic correctness This is similar to checking how well the essay is written. Even if the result did not solve the real problem, the answer could still look good — that’s why intrinsic alone is not enough. 🔹 Extrinsic Evaluation — Did It Achieve the Goal? This measures task success. If a customer support bot writes a beautifully worded paragraph, but the user still doesn’t get their refund — it failed extrinsically. Examples: System Type Extrinsic Goal Banking RAG Bot Did user get correct KYC procedure? Medical RAG Was advice safe & factual? Legal search assistant Did it return the right section of the law? Technical summariser Did summary capture key meaning? Intrinsic = writing quality. Extrinsic = impact quality. A production-grade RAG system must satisfy both. 📏 4. Core RAG Evaluation Metrics (Explained with Very Simple Analogies) Metric Meaning Analogy Relevance Does answer match question? Ask who invented C++? → model talks about Java ❌ Faithfulness No invented facts Book says started 2004, response says 1990 ❌ Groundedness Answer traceable to sources Claims facts that don’t exist in context ❌ Completeness Covers all parts of question User asks Windows vs Linux → only explains Windows Context Recall / Precision Correct docs retrieved & used Student opens wrong chapter Hallucination Rate Degree of made-up info “Taj Mahal is in London” 😱 Semantic Similarity Meaning-level match “Engine died” = “Car stopped running” 💡 Good evaluation doesn’t check exact wording. It checks meaning + truth + usefulness. 🛠 5. Tools for RAG Evaluation 🔹 1. RAGAS — Foundation for RAG Scoring RAGAS evaluates responses based on: ✔ Faithfulness ✔ Relevance ✔ Context recall ✔ Answer similarity Think of RAGAS as a teacher grading with a rubric. It reads both answer + source documents, then scores based on truthfulness & alignment. 🔹 2. LangChain Evaluators LangChain offers multiple evaluation types: Type What it checks String or regex Basic keyword presence Embedding based Meaning similarity, not text match LLM-as-a-Judge AI evaluates AI (deep reasoning) LangChain = testing toolbox RAGAS = grading framework Together they form a complete QA ecosystem. 🔹 3. PyTest + CI for Automated LLM Testing Instead of manually validating outputs, we automate: Feed preset questions to RAG Capture answers Run RAGAS/LangChain scoring Fail test if hallucination > threshold This brings AI closer to software-engineering discipline. RAG systems stop being experiments — they become testable, trackable, production-grade products. 🚀 6. The Future: LLM-as-a-Judge The future of evaluation is simple: LLMs will evaluate other LLMs. One model writes an answer. Another model checks: ✔ Was it truthful? ✔ Was it relevant? ✔ Did it follow context? This enables: Benefit Why it matters Scalable evaluation No humans needed for every query Continuous improvement Model learns from mistakes Real-time scoring Detect errors before user sees them This is like autopilot for AI systems — not only navigating, but self-correcting mid-flight. And that is where enterprise AI is headed. 🎯 Final Summary Evaluating LLM responses is not checking if strings match. It is checking if the machine: ✔ Understood the question ✔ Retrieved relevant knowledge ✔ Avoided hallucination ✔ Provided complete, meaningful reasoning ✔ Grounded answer in real source text RAG evaluation demands multi-layer validation — retrieval, reasoning, grounding, semantics, safety. Frameworks like RAGAS + LangChain evaluators + PyTest pipelines are shaping the discipline of measurable, reliable AI — pushing LLM-powered RAG from cool demo → trustworthy enterprise intelligence. Useful Resources What is Retrieval-Augmented Generation (RAG) : https://azure.microsoft.com/en-in/resources/cloud-computing-dictionary/what-is-retrieval-augmented-generation-rag/ Retrieval-Augmented Generation concepts (Azure AI) : https://learn.microsoft.com/en-us/azure/ai-services/content-understanding/concepts/retrieval-augmented-generation RAG with Azure AI Search – Overview : https://learn.microsoft.com/en-us/azure/search/retrieval-augmented-generation-overview Evaluate Generative AI Applications (Microsoft Learn – Learning Path) : https://learn.microsoft.com/en-us/training/paths/evaluate-generative-ai-apps/ Evaluate Generative AI Models in Microsoft Foundry Portal : https://learn.microsoft.com/en-us/training/modules/evaluate-models-azure-ai-studio/ RAG Evaluation Metrics (Relevance, Groundedness, Faithfulness) : https://learn.microsoft.com/en-us/azure/ai-foundry/concepts/evaluation-evaluators/rag-evaluators RAGAS – Evaluation Framework for RAG Systems : https://docs.ragas.io/821Views0likes0CommentsGenerally Available: Evaluations, Monitoring, and Tracing in Microsoft Foundry
If you've shipped an AI agent to production, you've likely run into the same uncomfortable realization: the hard part isn't getting the agent to work - it's keeping it working. Models get updated, prompts get tweaked, retrieval pipelines drift, and user traffic surfaces edge cases that never appeared in your eval suite. Quality isn't something you establish once. It's something you have to continuously measure. Today, we're making that continuous measurement a first-class operational capability. Evaluations, Monitoring, and Tracing in Microsoft Foundry are now generally available through Foundry Control Plane. These aren't standalone tools bolted onto the side of the platform - they're deeply integrated with Azure Monitor, which means AI agent observability now lives in the same operational plane as the rest of your infrastructure. The Problem With Point-in-Time Evaluation Most evaluation workflows are designed around a pre-deployment gate. You build a test dataset, run your evals, review the scores, and ship. That approach has real value - but it has a hard ceiling. In production, agent behavior is a function of many things that change independently of your code: Foundation model updates ship continuously and can shift output style, reasoning patterns, and edge case handling in ways that don't always surface on your benchmark set. Prompt changes can have nonlinear effects downstream, especially in multi-step agentic flows. Retrieval pipeline drift changes what context your agent actually sees at inference time. A document index fresh last month may have stale or subtly different content today. Real-world traffic distribution is never exactly what you sampled for your test set. Production surfaces long-tail inputs that feel obvious in hindsight but were invisible during development. The implication is straightforward: evaluation has to be continuous, not episodic. You need quality signals at development time, at every CI/CD commit, and continuously against live production traffic - all using the same evaluator definitions so results are comparable across environments. That's the core design principle behind Foundry Observability. Continuous Evaluation Across the Full AI Lifecycle Built-In Evaluators Foundry's built-in evaluators cover the most critical quality and safety dimensions for production agent systems: Coherence and Relevance measure whether responses are internally consistent and on-topic relative to the input. These are table-stakes signals for any conversational or task-completion agent. Groundedness is particularly important for RAG-based architectures. It measures whether the model's output is actually supported by the retrieved context - as opposed to plausible-sounding content the model generated from its parametric memory. Groundedness failures are a leading indicator of hallucination risk in production, and they're often invisible to human reviewers at scale. Retrieval Quality evaluates the retrieval step independently from generation. Groundedness failures can originate in two places: the model may be ignoring good context, or the retrieval pipeline may not be surfacing relevant context in the first place. Splitting these signals makes it much easier to pinpoint root cause. Safety and Policy Alignment evaluates whether outputs meet your deployment's policy requirements - content safety, topic restrictions, response format compliance, and similar constraints. These evaluators are designed to run at every stage of the AI lifecycle: Local development - run evals inline as you iterate on prompts, retrieval config, or orchestration logic CI/CD pipelines - gate every commit against your quality baselines; catch regressions before they reach production Production traffic monitoring - continuously evaluate sampled live traffic and surface trends over time Because the evaluators are identical across all three contexts, a score in CI means the same thing as a score in production monitoring. See the Practical Guide to Evaluations and the Built-in Evaluators Reference for a deeper walkthrough. Custom Evaluators - Encoding Your Own Definition of Quality Built-in evaluators cover common signals well, but production agents often need to satisfy criteria specific to a domain, regulatory environment, or internal standard. Foundry supports two types of custom evaluators (currently in public preview): LLM-as-a-Judge evaluators let you configure a prompt and grading rubric, then use a language model to apply that rubric to your agent's outputs. This is the right approach for quality dimensions that require reasoning or contextual judgment - whether a response appropriately acknowledges uncertainty, whether a customer-facing message matches your brand tone, or whether a clinical summary meets documentation standards. You write a judge prompt with a scoring scale (e.g., 1–5 with criteria for each level) that evaluates a given {input} / {response} pair. Foundry runs this at scale and aggregates scores into your dashboards alongside built-in results. Code-based evaluators are Python functions that implement any evaluation logic you can express programmatically - regex matching, schema validation, business rule checks, compliance assertions, or calls to external systems. If your organization has documented policies about what a valid agent response looks like, you can encode those policies directly into your evaluation pipeline. Custom and built-in evaluators compose naturally - running against the same traffic, producing results in the same schema, feeding into the same dashboards and alert rules. Monitoring and Alerting - AI Quality as an Operational Signal All observability data produced by Foundry - evaluation results, traces, latency, token usage, and quality metrics - is published directly to Azure Monitor. This is where the integration pays off for teams already on Azure. What this enables that siloed AI monitoring tools can't: Cross-stack correlation. When your groundedness score drops, is it a model update, a retrieval pipeline issue, or an infrastructure problem affecting latency? With AI quality signals and infrastructure telemetry in the same Azure Monitor Application Insights workspace, you can answer that in minutes rather than hours of manual correlation across disconnected systems. Unified alerting. Configure Azure Monitor alert rules on any evaluation metric - trigger a PagerDuty incident when groundedness drops below threshold, send a Teams notification when safety violations spike, or create automated runbook responses when retrieval quality degrades. These are the same alert mechanisms your SRE team already uses. Enterprise governance by default. Azure Monitor's RBAC, retention policies, diagnostic settings, and audit logging apply automatically to all AI observability data. You inherit the governance framework your organization has already built and approved. Grafana and existing dashboards. If your team uses Azure Managed Grafana, evaluation metrics can flow into existing dashboards alongside your other operational metrics - a single pane of glass for application health, infrastructure performance, and AI agent quality. The Agent Monitoring Dashboard in the Foundry portal provides an AI-native view out of the box - evaluation metric trends, safety threshold status, quality score distributions, and latency breakdowns. Everything in that dashboard is backed by Azure Monitor data, so SRE teams can always drill deeper. End-to-End Tracing: From Quality Signal to Root Cause A groundedness score tells you something is wrong. A trace tells you exactly where the failure occurred and what the agent actually did. Foundry provides OpenTelemetry-based distributed tracing that follows each request through your entire agent system: model calls, tool invocations, retrieval steps, orchestration logic, and cross-agent handoffs. Traces capture the full execution path - inputs, outputs, latency at each step, tool call parameters and responses, and token usage. The key design decision: evaluation results are linked directly to traces. When you see a low groundedness score in your monitoring dashboard, you navigate directly to the specific trace that produced it - no manual timestamp correlation, no separate trace ID lookup. The connection is made automatically. Foundry auto-collects traces across the frameworks your agents are likely already built on: Microsoft Agent Framework Semantic Kernel LangChain and LangGraph OpenAI Agents SDK For custom or less common orchestration frameworks, the Azure Monitor OpenTelemetry Distro provides an instrumentation path. Microsoft is also contributing upstream to the OpenTelemetry project - working with Cisco Outshift, we've contributed semantic conventions for multi-agent trace correlation, standardizing how agent identity, task context, and cross-agent handoffs are represented in OTel spans. Note: Tracing is currently in public preview, with GA shipping by end of March. Prompt Optimizer (Public Preview) One persistent friction point in agent development is the iteration loop between writing prompts and measuring their effect. You make a change, run your evals, look at the delta, try to infer what about the change mattered, and repeat. Prompt Optimizer tightens this loop. It analyzes your existing prompt and applies structured prompt engineering techniques - clarifying ambiguous instructions, improving formatting for model comprehension, restructuring few-shot examples, making implicit constraints explicit - with paragraph-level explanations for every change it makes. The transparency is deliberate. Rather than producing a black-box "optimized" prompt, it shows you exactly what it changed and why. You can add constraints, trigger another optimization pass, and iterate until satisfied. When you're done, apply it with one click. The value compounds alongside continuous evaluation: run your eval suite against the current prompt, optimize, run evals again, see the measured improvement. That feedback loop - optimize, measure, optimize - is the closest thing to a systematic approach to prompt engineering that currently exists. What Makes our Approach to Observability Different There are other evaluation and observability tools in the AI ecosystem. The differentiation in Foundry's approach comes down to specific architectural choices: Unified lifecycle coverage, not just pre-deployment testing. Most existing evaluation tools are designed for offline, pre-deployment use. Foundry's evaluators run in the same form at development time, in CI/CD, and against live production traffic. Your quality metrics are actually comparable across the lifecycle - you can tell whether production quality matches what you saw in testing, rather than operating two separate measurement systems that can't be compared. No separate observability silo. Publishing all observability data to Azure Monitor means you don't operate a separate system for AI quality alongside your existing infrastructure monitoring. AI incidents route through your existing on-call rotations. AI quality data is subject to the same retention and compliance controls as the rest of your telemetry. Framework-agnostic tracing. Auto-instrumentation across Semantic Kernel, LangChain, LangGraph, and the OpenAI Agents SDK means you're not locked into a specific orchestration framework. The OpenTelemetry foundation means trace data is portable to any compatible backend, protecting your investment as the tooling landscape evolves. Composable evaluators. Built-in and custom evaluators run in the same pipeline, against the same traffic, producing results in the same schema, feeding into the same dashboards and alert rules. You don't choose between generic coverage and domain-specific precision - you get both. Evaluation linked to traces. Most systems treat evaluation and tracing as separate concerns. Foundry treats them as two views of the same event - closing the loop between detecting a quality problem and diagnosing it. Getting Started If you're building agents on Microsoft Foundry, or using Semantic Kernel, LangChain, LangGraph, or the OpenAI Agents SDK and want to add production observability, the entry point is Foundry Control Plane. Try it You'll need a Foundry project with an agent and an Azure OpenAI deployment. Enable observability by navigating to Foundry Control Plane and connecting your Azure Monitor workspace. Then walk through the Practical Guide to Evaluations, explore the Built-in Evaluators Reference, and set up end-to-end tracing for your agents.5.1KViews1like0Comments
Now in Foundry: VibeVoice-ASR, MiniMax M2.5, Qwen3.5-9B
This week's Model Mondays edition features two models that have just arrived in Microsoft Foundry: Microsoft's VibeVoice-ASR, a unified speech-to-text model that handles 60-minute audio files in a single pass with built-in speaker diarisation and timestamps, and MiniMaxAI's MiniMax-M2.5, a frontier agentic model that leads on coding and tool-use benchmarks with performance comparable to the strongest proprietary models at a fraction of their cost; and Qwen's Qwen3.5-9B, the largest of the Qwen3.5 Small Series. All three represent a shift toward long-context, multi-step capability: VibeVoice-ASR processes up to an hour of continuous audio without chunking; MiniMax-M2.5 handles complex, multi-phase agentic tasks more efficiently than its predecessor—completing SWE-Bench Verified 37% faster than M2.1 with 20% fewer tool-use rounds; and Qwen3.5-9B brings multimodal reasoning on consumer hardware that outperforms much larger models. Models of the week VibeVoice-ASR Model Specs Parameters / size: ~8.3B Primary task: Automatic Speech Recognition with diarisation and timestamps Why it's interesting 60-minute single-pass with full speaker attribution: VibeVoice-ASR processes up to 60 minutes of continuous audio without chunk-based segmentation—yielding structured JSON output with start/end timestamps, speaker IDs, and transcribed content for each segment. This eliminates the speaker-tracking drift and semantic discontinuities that chunk-based pipelines introduce at segment boundaries. Joint ASR, diarisation, and timestamps in one model: Rather than running separate systems for transcription, speaker separation, and timing, VibeVoice-ASR produces all three outputs in a single forward pass. Users can also inject customized hot words—proper nouns, technical terms, or domain-specific phrases—to improve recognition accuracy on specialized content without fine-tuning. Multilingual with native code-switching: Supports 50+ languages with no explicit language configuration required and handles code-switching within and across utterances natively. This makes it suitable for multilingual meetings and international call center recordings without pre-routing audio by language. Benchmarks: On the Open ASR Leaderboard, VibeVoice-ASR achieves an average WER of 7.77% across 8 English datasets (RTFx 51.80), including 2.20% on LibriSpeech Clean and 2.57% on TED-LIUM. On the MLC-Challenge multi-speaker benchmark: DER 4.28%, cpWER 11.48%, tcpWER 13.02%. Try it Use case What to build Best practices Long-form, multi-speaker transcription for meetings + compliance A transcription service that ingests up to 60 minutes of audio per request and returns structured segments with speaker IDs + start/end timestamps + transcript text (ready for search, summaries, or compliance review). Keep audio un-chunked (single-pass) to preserve speaker coherence and avoid stitching drift; rely on the model’s joint ASR, diarisation, and timestamping so you don’t need separate diarisation/timestamp pipelines or postprocessing. Multilingual + domain-specific transcription (global support, technical reviews) A global transcription workflow for multilingual meetings or call center recordings that outputs “who/when/what,” and supports vocabulary injection for product names, acronyms, and technical terms. Provide customized hot words (names / technical terms) in the request to improve recognition on specialized content; don’t require explicit language configuration—VibeVoice-ASR supports 50+ languages and code-switching, so you can avoid pre-routing audio by language. Read more about the model and try out the playground Microsoft for Hugging Face Spaces to try the model for yourself. MiniMax-M2.5 Model Specs Parameters / size: ~229B (FP8, Mixture of Experts) Primary task: Text generation (agentic coding, tool use, search) Why it's interesting? Leading coding benchmark performance: Scores 80.2% on SWE-Bench Verified and 51.3% on Multi-SWE-Bench across 10+ programming languages (Go, C, C++, TypeScript, Rust, Python, Java, and others). In evaluations across different agent harnesses, M2.5 scores 79.7% on Droid and 76.1% on OpenCode—both ahead of Claude Opus 4.6 (78.9% and 75.9% respectively). The model was trained across 200,000+ real-world coding environments covering the full development lifecycle: system design, environment setup, feature iteration, code review, and testing. Expert-level search and tool use: M2.5 achieves industry-leading performance in BrowseComp, Wide Search, and Real-world Intelligent Search Evaluation (RISE), laying a solid foundation for autonomously handling complex tasks. Professional office work: Achieves a 59.0% average win rate against other mainstream models in financial modeling, Word, and PowerPoint tasks, evaluated via the GDPval-MM framework with pairwise comparison by senior domain professionals (finance, law, social sciences). M2.5 was co-developed with these professionals to incorporate domain-specific tacit knowledge—rather than general instruction-following—into the model's training. Try it Use case What to build Best practices Agentic software engineering Multi‑file code refactors, CI‑gated patch generation, long‑running coding agents working across large repositories Start prompts with a clear architecture or refactor goal. Let the model plan before editing files, keep tool calls sequential, and break large changes into staged tasks to maintain state and coherence across long workflows. Autonomous productivity agents Research assistants, web‑enabled task agents, document and spreadsheet generation workflows Be explicit about intent and expected output format. Decompose complex objectives into smaller steps (search → synthesize → generate), and leverage the model’s long‑context handling for multi‑step reasoning and document creation. With these use cases and best practices in mind, the next step is translating them into a clear, bounded prompt that gives the model a specific goal and the right tools to act. The example below shows how a product or engineering team might frame an automated code review and implementation task, so the model can reason through the work step by step and return results that map directly back to the original requirement: “You're building an automated code review and feature implementation system for a backend engineering team. Deploy MiniMax-M2.5 in Microsoft Foundry with access to your repository's file system tools and test runner. Given a GitHub issue describing a new API endpoint requirement, have the model first write a functional specification decomposing the requirement into sub-tasks, then implement the endpoint across the relevant service files, write unit tests with at least 85% coverage, and return a pull request summary explaining each code change and its relationship to the original requirement. Flag any implementation decisions that deviate from the patterns found in the existing codebase.” Qwen3.5-9B Model Specs Parameters / size: 9B Context length: 262,144 tokens natively; extensible to 1,010,000 tokens Primary task: Image-text-to-text (multimodal reasoning) Why it’s interesting High intelligence density at small sizes: Qwen 3.5 Small models show large reasoning gains relative to parameter count, with the 4B and 9B variants outperforming other sub‑10B models on public reasoning benchmarks. Long‑context by default: Support for up to 262K tokens enables long‑document analysis, codebase review, and multi‑turn workflows without chunking. Native multimodal architecture: Vision is built into the model architecture rather than added via adapters, allowing small models (0.8B, 2B) to handle image‑text tasks efficiently. Open and deployable: Apache‑2.0 licensed models designed for local, edge, or cloud deployment scenarios. Benchmarks AI Model & API Providers Analysis | Artificial Analysis Try it Use case When to use Best‑practice prompt pattern Long‑context reasoning Analyzing full PDFs, long research papers, or large code repositories where chunking would lose context Set a clear goal and scope. Ask the model to summarize key arguments, surface contradictions, or trace decisions across the entire document before producing an output. Lightweight multimodal document understanding OCR‑driven workflows using screenshots, scanned forms, or mixed image‑text inputs Ground the task in the artifact. Instruct the model to first describe what it sees, then extract structured information, then answer follow‑up questions. With these best practices in mind, Qwen 3.5-9B demonstrates how compact, multimodal models can handle complex reasoning tasks without chunking or manual orchestration. The prompt below shows how an operations analyst might use the model to analyze a full report end‑to‑end: "You are assisting an operations analyst. Review the attached PDF report and extracted tables. Identify the three largest cost drivers, explain how they changed quarter‑over‑quarter, and flag any anomalies that would require follow‑up. If information is missing, state what data would be needed." Getting started You can deploy open-source Hugging Face models directly in Microsoft Foundry by browsing the Hugging Face collection in the Foundry model catalog and deploying to managed endpoints in just a few clicks. You can also start from the Hugging Face Hub. First, select any supported model and then choose "Deploy on Microsoft Foundry", which brings you straight into Azure with secure, scalable inference already configured. Learn how to discover models and deploy them using Microsoft Foundry documentation. Follow along the Model Mondays series and access the GitHub to stay up to date on the latest Read Hugging Face on Azure docs Learn about one-click deployments from the Hugging Face Hub on Microsoft Foundry Explore models in Microsoft Foundry1.5KViews0likes0Comments