diagnostics
23 TopicsLessons Learned #555: The First 60 Seconds of a Production Incident: Stop, Scope, Correlate
When a critical production incident starts, the first message we often receive is something like: “The database is down.” At that moment, everything suddenly becomes urgent. Engineers open monitoring dashboards. Someone starts checking logs. Another person reviews CPU and memory. Someone else asks whether there was a deployment. Connections are tested. Metrics are queried. Teams are contacted. All of these actions may eventually be necessary. But there is a more important question to answer first: What exactly does “down” mean? After working on many production incidents, one lesson becomes increasingly clear: The first 60 seconds are not about solving the incident. They are about defining the incident. A vague problem description can send troubleshooting in many different directions. A precise problem statement dramatically reduces the investigation space. This article describes a simple approach that can be applied during the first moments of an incident: Stop. Scope. Correlate. 1. Stop: Define What “Down” Actually Means The first mistake during many incidents is assuming that everyone understands the problem in the same way. Consider the statement: “The database is unavailable.” That statement could mean many different things: Applications cannot establish new connections. Existing connections are still working, but new connections fail. Queries are timing out. A specific login cannot authenticate. One database is inaccessible. One application is failing while other applications work correctly. Performance degradation makes the service appear unavailable. The application returns HTTP 500 errors, but the database itself is healthy. Connections fail intermittently. A failover is occurring. DNS or networking issues prevent the application from reaching the database. These scenarios require completely different investigation paths. Before opening ten different tools, try to transform the original statement into something more specific. For example: Instead of: “The database is down.” Try to reach something like: “Since approximately 14:32 UTC, new application connections to Database A have intermittently failed with login errors, while existing sessions remain active.” Now we have something we can investigate. The problem statement contains: a timestamp, a specific database, a specific symptom, affected connection behavior, and an indication that the issue may be intermittent. That is already much more valuable than the original alert. 2. Scope: Determine the Blast Radius Once we understand the symptom, the next question is: Who or what is affected? This is sometimes called determining the blast radius. The scope can immediately eliminate entire categories of possible causes. Ask questions such as: Is one user affected or every user? Is one application affected or several applications? Is one database affected or all databases? Are all connection types affected? Are existing connections healthy while new connections fail? Are only specific clients or drivers affected? Imagine the following situation. Application A reports database connectivity failures. However: Application B connects successfully. SSMS connects successfully. Azure metrics show the database is available. Existing sessions continue executing queries. This changes the investigation dramatically. The problem may not be: “Azure SQL is unavailable.” It may instead be: “Application A cannot establish new connections.” That distinction is extremely important. A large percentage of troubleshooting time can be saved simply by identifying the correct scope early. 3. Build the Timeline The next critical dimension is time. During an incident, timestamps are evidence. Ask: When did the issue start? Is there an exact timestamp? How long did it last? Is the issue continuous or intermittent? Did the problem recover automatically? Did the issue occur once or multiple times? Was there another event immediately before the problem? A good incident timeline may look like this: 14:31:52 UTC – Application operating normally 14:32:08 UTC – First connection error reported 14:32:10 UTC – Database failover detected 14:32:14 UTC – Additional login failures 14:32:18 UTC – New connections begin succeeding 14:32:20 UTC – Application fully recovere Now the investigation is no longer based on assumptions. We have a five-to-ten-second window that can be correlated with platform telemetry, database events, application logs, networking information, and deployment history. Without the timeline, engineers may analyze hours of logs. With the timeline, the investigation becomes focused. 4. Correlate Before Changing Anything The next step is correlation. Once we understand the symptom, scope, and timeline, we can ask: What changed at the same time? Useful correlation sources may include: application deployments, infrastructure changes, configuration changes, database failovers, scaling operations, maintenance events, firewall changes, authentication changes, networking events, DNS changes, resource utilization, query regressions, blocking, deadlocks, connection pool behavior, driver updates, platform events. etc The key word here is correlation. It is tempting during an incident to immediately change something. For example: restart the application, restart a service, scale the database, clear the connection pool, change configuration, rebuild an index, modify a query, fail over manually. Sometimes these actions are necessary. But every change also modifies the evidence. A restart may restore the service while simultaneously removing valuable diagnostic information. Whenever possible: Collect evidence before changing the environment. 5. Use Multiple Sources of Evidence Production incidents rarely provide the complete answer in one telemetry source. A better approach is to correlate multiple sources. For a database-related incident, we may investigate: Application telemetry Application logs may reveal: connection failures, authentication errors, request latency, retry attempts, timeout exceptions, HTTP errors, dependency failures. Platform metrics Cloud metrics may help determine: service availability, CPU utilization, storage pressure, connection count, throttling, resource saturation. Database telemetry Database-level information may include: active sessions, waits, blocking, query performance, login failures, failover events, resource statistics. Query Store For performance incidents, Query Store can be extremely valuable. It may help identify: query regressions, plan changes, increased execution duration, abnormal CPU consumption, changes in execution frequency. Deployment history Always ask: What changed recently? Many incidents have a strong temporal relationship with: application deployments, schema changes, configuration modifications, infrastructure updates, new releases, security changes. The goal is not to assume that the most recent change caused the incident. The goal is to determine whether the events correlate. 6. Avoid Starting With a Tool One common troubleshooting pattern is: “Open the monitoring portal.” or: “Run this query.” or: “Check this log.” Tools are essential, but tools should follow the investigation strategy. The investigation should determine which tool we need. Not the other way around. If the problem is authentication, the investigation path may focus on: login errors, authentication configuration, identity providers, user mappings, connection strings. If the problem is performance, the investigation may focus on: Query Store, waits, blocking, execution plans, resource utilization. If the problem is connectivity, we may investigate: DNS, network paths, firewalls, drivers, retries, connection pools. A clear problem definition tells us where to look. 7. Ask the Same Questions Every Time One of the most effective improvements teams can make is standardizing the first questions asked during incidents. A simple initial checklist could be: Symptom: What exactly is failing? Scope: Who or what is affected? Timeline: When did it start? Error: What exact error message or error code is being returned? Frequency: Is the issue continuous, intermittent, or already recovered? Changes: What changed immediately before the incident? Evidence : Which telemetry sources can confirm the behavior? These questions are intentionally simple. During a high-severity incident, simplicity is valuable. 8. The First 60 Seconds Framework We can summarize the approach in four steps. 1. Define: What does the reported symptom actually mean? 2. Scope: Determine the blast radius. 3. Timeline: Identify exactly when the problem occurred. 4. Correlate Connect the symptom with telemetry, events, and recent changes. Only after these steps should we decide the deeper troubleshooting path. 9. Speed Is Important, but Direction Is More Important During critical incidents, teams naturally want to move quickly. That is the correct instinct. But speed without direction can create noise. Ten engineers investigating ten different theories at the same time may generate enormous activity without producing clarity. A well-defined incident allows teams to divide the investigation intelligently. For example: One engineer investigates application telemetry. Another checks database telemetry. Another reviews platform events. Another investigates recent deployments. Another builds the incident timeline. All of them are now investigating the same defined problem. That is very different from everyone independently trying to determine what the problem might be.Modernizing radiology reporting—without disrupting care: A practical path to PowerScribe One
With growing imaging volumes, increasing complexity, and the rapid emergence of AI, healthcare organizations are reevaluating how their reporting environments support clinicians and strengthen operational performance. They are faced with how to modernize without interrupting the work that matters most. We developed our PowerScribe One solution and implementation approach with that reality in mind. In active production across a wide range of healthcare environments (including large integrated delivery networks, academic medical centers, independent radiology practices, and community hospitals), PowerScribe One reflects a solution that is both proven in practice and designed for what comes next. Over 250 organizations and 10,000+ radiologists use PowerScribe One to generate millions of reports each month. This scale is significant; it’s validation of what we bring through our solution and support. It reflects a system and team tested across diverse environments, integration landscapes, and operational models, performing reliably in real-world conditions. Combining the strength of our solutions with an experienced Microsoft team, we deliver a seamless implementation that minimizes disruption. Redefining the migration experience As I’ve worked with customers modernizing their reporting environments, I’ve noticed a consistent pattern of concern: how to modernize without disrupting the workflows teams rely on or the care they deliver. In my experience, even when a solution offers meaningful capabilities, customers still worry about the potential downsides of a prolonged migration. I understand that perspective. Many have worked with vendors who promise a “lift-and-shift” implementation but fall short of that expectation. Migrations can introduce real challenges, including downtime, retraining, and workflow disruption. Over time, we’ve seen that successful transformation is driven not only by the strength of the technology, but also by how effectively the transition is managed. With years of experience supporting PowerScribe environments, we’ve taken those insights and applied them to our approach. We defined what a successful PowerScribe One implementation looks like and developed a migration model designed to reduce risk while supporting adoption. Rather than viewing migration as a single milestone, PowerScribe One transitions are designed as a structured journey with clearly defined phases and timing: Discovery: Align on goals, workflows, and integration requirements Build: Preparing the technical and operational foundation Testing: Validating workflows end to end and addressing issues proactively Production: Supporting go-live with a focus on stability and adoption Each phase includes checkpoints and shared accountability to increase transparency and reduce uncertainty. Our Microsoft team works closely with our customers to build a project timeline that fits their needs while existing PowerScribe 360 workflows and content are leveraged, eliminating the need to rebuild from scratch. I’d also like to highlight at the center of this migration model is a parallel transition strategy. We enable PowerScribe 360 and PowerScribe One to operate side-by-side during our customer’s migration period. This approach provides organizations with the flexibility to: Introduce PowerScribe One to early adopters Validate workflows and integrations in a live environment Phase adoption across teams Maintain continuity throughout the transition In this measured approach, our customers can move forward with confidence, ensuring that systems, workflows, and teams are ready for successful adoption. The result is a model that is both repeatable and adaptable, capable of supporting organizations with varying levels of complexity. Our efforts to center our implementation process on the customer experience shows how migration work is not simply a technical capability proposition. This focus reflects our broader philosophy: transformation should be deliberate, not disruptive. From implementation to enablement Minimizing disruption doesn’t end with implementation. It extends into how teams are supported, trained, and enabled in their day-to-day workflows. Our focus on enablement is especially important in radiology, where even small workflow disruptions can have outsized impacts on productivity and the radiologist experience. With PowerScribe One, organizations not only gain access to a modern reporting solution but also support from teams with deep experience in radiology workflows, integrations, and large-scale deployments. With that in mind, I’ve seen firsthand how the healthcare landscape has radically changed over the last six years. Our customers tell us how workforce shifts in radiology means they are adapting their staffing models and workflows to include telework. With these changes in the workforce, organizations benefit from training and support models that are flexible, digital, and accessible remotely. We made live expert access (known to our customers as “drop-in help”) easily accessible through a simple QR code. It can be an ad hoc or scheduled engagement which ensures the offering aligns with a radiologist’s schedule. The feedback on this level of access we’ve received has been extremely positive and is resonating strongly with customers. I know that for any healthcare solution deployment to be successful, it requires a learning and support model that aligns with clinical schedules and operational realities. Modernizing radiology reporting is both a technical and operational effort with its success depending on advancing capability without disrupting clinical continuity. The transition to PowerScribe One shows this balance is achievable through phased adoption, low-disruption deployment, and strong user readiness. Organizations can modernize without affecting day-to-day care delivery with our structured approach, proven expertise and a focus on provider experience and patient outcomes. If you want to learn more about our approach or PowerScribe One, I’ll be at SIIM26, June 10-12, please stop by the Microsoft booth at 630-632. You can also discover how we partner with our customers why they decided to move to PowerScribe One by reading our Industry Blog.
New MRCA Diagnostic: Teams Meeting Add-in For Classic Outlook
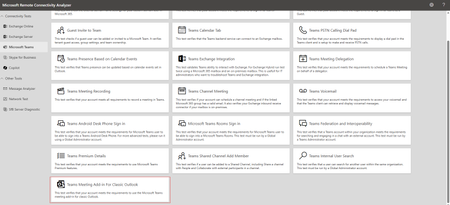
Hi Teams Community, We're back with another great addition from Christopher Tart to Support Diagnostics for Microsoft Teams. We're excited to share that the Teams Support team has added a new diagnostic to the Microsoft Remote Connectivity Analyzer — the Teams Meeting Add-in For Classic Outlook diagnostic. If you manage Teams in your organization, you've likely seen this scenario come through your support queue more than once: a user opens classic Outlook to schedule a meeting and the Teams Meeting button is simply nowhere to be found. This new diagnostic is here to help you quickly pinpoint what's blocking the add-in — whether it's a policy misconfiguration, a licensing gap, or a coexistence mode that's incompatible with the Teams add-in. Some common symptoms this diagnostic helps you troubleshoot: The Teams Meeting button is missing from the Outlook ribbon The Teams add-in doesn't appear in Outlook's list of COM add-ins Users are unable to schedule a Teams meeting directly from Outlook Only the Skype Meeting option appears in Outlook, with no Teams option in sight To access the new diagnostic, navigate to Microsoft Remote Connectivity Analyzer, select Microsoft Teams, then click on Teams Meeting Add-in For Classic Outlook. You'll need to sign in with a Teams account to run the test. Once authenticated — the diagnostic will then validate that user's configuration end to end. At a high level, the test checks a couple of things: The user is licensed for Microsoft Teams The Teams Outlook add-in policy is enabled (TeamsUpgradePolicy / Teams meeting policies) The user's coexistence and upgrade mode is compatible with the Teams Meeting add-in — users set to Skype for Business Only mode will not see the Teams add-in in Outlook The Teams desktop client is installed and signed in on the user's machine Exchange Online or on-premises connectivity is verified to confirm Outlook can reach Teams for meeting scheduling Admin policies that may be suppressing the add-in are flagged (e.g., Outlook add-in management policies) For more information, check out these resources: Use the Teams Meeting add-in in Outlook Teams Meeting add-in missing in Outlook Setting your coexistence and upgrade settings Please give the new diagnostic a try — and let us know if it helped! Thanks! Microsoft Teams Support523Views0likes2CommentsNew MRCA Diagnostic: Guest Invite to Teams
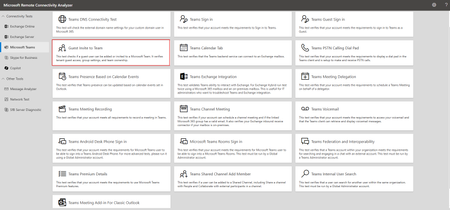
Hi Teams Community, We're back with another great addition from RuiTabaresMsft to Support Diagnostics for Microsoft Teams. We're excited to share a new test now available in the Microsoft Remote Connectivity Analyzer — the Guest Invite to Team diagnostic. Getting guest access working properly in Teams requires several settings across Microsoft 365 to all line up correctly, and when one of them is misconfigured it can be frustratingly difficult to pinpoint. This new diagnostic is designed to help admins quickly identify exactly where the configuration has gone wrong. If you're experiencing any of the following symptoms, you should give this diagnostic a try: A team owner is unable to add or invite a guest user to a Microsoft Team. You receive an error such as "You don't have permission to add guests" when attempting to invite an external user. Guest access appears to be enabled in the Teams admin center, but external users still can't join a team. Guest users were previously able to be invited to teams, but invitations have stopped working after a recent configuration change. To access the new diagnostic, navigate to Microsoft Remote Connectivity Analyzer, select Microsoft Teams, then click on Guest Invite to Team. We recommend signing in with a Teams or Microsoft 365 Administrator account. Because this diagnostic validates tenant-wide settings and Microsoft 365 group configuration, admin-level credentials are needed to return complete and accurate results. At a high level, the test checks a couple of things: Tenant guest access setting — Validates that "Allow guest access in Teams" is enabled in the Teams admin center. Microsoft Entra ID external collaboration settings — Confirms B2B external collaboration is not blocked at the Entra ID level. Microsoft 365 Groups guest settings — Checks that group owners are permitted to add external people as guests. Team ownership — Verifies the team has at least one owner, as required to invite guests. For background reading: Guest access in Microsoft Teams Collaborate with guests in a team Manage guest access in Microsoft 365 Groups Please give the new diagnostic a try — and let us know if it helped! Thanks! Microsoft Teams Support225Views0likes0CommentsRemove Unnecessary Azure Storage Account Dependencies in VM Diagnostics
This post explains how to reduce unnecessary Azure Storage Account dependencies—and associated SAS token usage—by simplifying VM diagnostics configurations: specifically, by removing the retiring legacy IaaS Diagnostics extension and migrating VM boot diagnostics from customer-managed Storage Accounts to Microsoft‑managed storage. Using Azure Resource Graph to identify affected virtual machines at scale, the article shows that both changes can be implemented without VM reboots or guest OS impact, reduce storage sprawl and operational overhead, and help organizations stay ahead of platform deprecations, with automation options available to standardize these improvements across environments.Ushering in the Next Era of Cloud-Native AI Capabilities for Radiology
Introducing Dragon Copilot, your AI companion for PowerScribe One For radiologists, the reporting workflow of the future is here. At RSNA 2025, in Chicago, we’re showcasing Dragon Copilot, a cloud-native companion for PowerScribe One. Currently in preview, Dragon Copilot builds on the trusted capabilities of PowerScribe One to accelerate innovation and modernize reporting workflows while unlocking extensibility for radiology teams and partners. Why we built it: Technical drivers for a new era With growing demand for imaging services coupled with a workforce shortage, healthcare professionals face increased workloads and burnout while patients experience greater wait times. With our breadth of healthcare industry experience combined with our AI expertise and development at Microsoft, we immediately understood how we could help address these challenges. For radiologists, we sought to plugin into existing reporting workflows with rapid innovation, scalable AI, and open extensibility. How we built it: Modern architecture and extensibility By delivering Dragon Copilot as cloud-native solution built on Azure, we can enable new services globally. We apply the full capabilities of Azure for compute, storage, and security for high availability and compliance. Our modular architecture enables fast delivery of new features with APIs at the core to allow seamless integration, extensibility, and partner innovation. To imbue the workflow with AI through our platform, we harness the latest generative, multimodal, and agentic AI (both internal and through our partners) to support clinical reporting, workflow automation, and decision support. Key architectural highlights: AI services: Integrated large language models (LLMs) and vision-language models (VLMs) for multimodal data processing. API-first design: RESTful APIs expose core functions (draft report content generation, prior summarization, quality checks and chat) enabling partners and developers to build extensions and custom workflows. Extensibility framework: Open platform for 1st- and 3rd-party extensions, supporting everything from custom AI models to workflow agents. Inside the innovation Dragon Copilot alongside PowerScribe provides a unified AI experience. Radiologists can take advantage of the latest AI advancements without disruption to their workflows. They do not need another widget taking up room on their desktop. Instead, they need AI that fits seamlessly into existing workflows connecting their data to the cloud. Our cloud-first approach brings increased reliability, stability, and performance to a radiologists’ workflow. I’m thrilled to highlight the key capabilities of this dynamic duo: PowerScribe One with Dragon Copilot. Prior report summary: Automatically summarizes relevant prior reports, surfacing key findings, and context for the current study. AI-generated draft reports and quality checks: The most transformative aspect of Dragon Copilot is its open, extensible architecture for AI integration. We don’t limit radiology teams to a single set of AI tools. We enable seamless plug-ins for AI apps & agents from both Microsoft and our growing ecosystem of 3rd-parties. We provide a single surface for all your AI needs. This approach will enable radiology departments to discover, acquire, & deploy new AI-powered extensions. We’re enthusiastic about embarking on this journey with partners. We're also excited about collaborations with developers and academic innovators to bring their own AI models and services directly into the Dragon Copilot experience. Integrated chat experience with credible knowledge sources and medical safeguards: This chat interface connects radiologists to credible, clinically validated sources from Radiopedia and Radiology Assistant. It enables agentic orchestration and safeguards provided by Azure's Healthcare Agent Services for PHI and clinical accuracy. In the future, we expect to have a variety of other sources for radiology customers to choose from as well as the ability for organizations to add their own approved policies and protocols. This chat is designed to route questions to the right agent, provide evidence for claims, and filter responses for clinical validity. Over time, it will include extensions with custom agents powered by Copilot Studio. Help us shape what’s next As we continue to evolve Dragon Copilot alongside PowerScribe One, we invite innovators, developer partners, and academics to join us in shaping the future of radiology workflow. Dragon Copilot is more than a product; it’s a solution for rapid, responsible innovation in radiology. By combining cloud-native architecture, advanced AI capabilities, and open extensibility, we’re enabling radiology teams to work smarter, faster, and with greater confidence. Ready to see it in action? Visit us at RSNA 2025 (November 30–December 4), booth #1311 South Hall. Or contact our team to join the journey.Microsoft Security Copilot in Intune deep dive – Part 1: Features available in public preview
By: Zineb Takafi - Product Manager & Lavanya Lakshman - Principal Product Manager | Microsoft Intune Microsoft Intune is a widely used cloud-based endpoint management solution that simplifies the management and security of devices, apps, and data across your organization. Intune is poised to set a new standard for IT productivity and protection with generative AI capabilities powered by Microsoft Security Copilot, an AI-driven security solution designed to empower security and IT professionals. Copilot integrates seamlessly into Intune, transforming critical workflows around policy management, troubleshooting, and security threat resolution. With key integrations in Intune Suite for Endpoint Privilege Management and Device Query, Copilot enhances endpoint security by offering AI-driven insights and potential app elevation risk. These capabilities are designed to reduce manual intervention and accelerate response times. In this blog, we’ll dive into our current capabilities in preview. This is the first blog of our new monthly Copilot in Intune blog series. Each post will spotlight different Copilot capabilities within Intune through demos, practical tips, and real-world scenarios. By following along, you’ll discover our latest innovations with AI in Intune and how to harness the power of Copilot to stay ahead of emerging threats and streamline your management processes. Let’s get started on this journey together and unlock the full potential of Security Copilot in Intune today! Simplify device policy management Security Copilot in Intune helps IT admins quickly review and manage device policies. By selecting the "Summarize with Copilot" button, admins get a clear summary of policies and settings. Copilot’s "Describe the impact" feature helps understand how policies affect users and security. Admins can also investigate specific settings, check for conflicts across policies, and ensure everything aligns with organizational needs—all without manual research. Copilot streamlines policy management, saving time and enhancing security. Effortlessly troubleshoot device issues Copilot in Intune helps IT admins quickly troubleshoot device issues. By navigating to Devices and selecting the faulty device, admins can select “Explore with Copilot” and use the “Summarize this device” prompt to view key details like hardware info, group memberships, compliance state, and reasons for non-compliance. Admins can then compare the faulty device with a healthy one by having Copilot highlight differences in configuration profiles, compliance policies, app configuration policies, discovered apps, managed apps, and hardware. This powerful integration streamlines issue identification, making troubleshooting faster and more efficient. AI-powered Copilot integrations with Intune Suite With Advanced analytics and Endpoint Privilege Management, part of the Intune Suite available as an add-on, customers can take advantage of Copilot integrations to further streamline endpoint management. These AI-powered integrations streamline app elevation requests and complex KQL query creation in device query to get insights on your devices. Identify app risks before approving app privileges Security Copilot in Intune enhances Endpoint Privilege Management by helping IT admins assess the risk of app elevation requests. When users request to elevate unfamiliar apps, admins typically have to research the app’s reputation and potential risks manually. Copilot simplifies this by automatically analyzing the app’s security status. When a user requests elevation for an app, admins can select “Analyze with Copilot” in the Intune admin center. Copilot sends the app’s hash to Microsoft Defender Threat Intelligence, providing critical insights. Copilot flags the app for suspicious indicators tied to a known malware campaign. Use natural language to get real-time device data The integration of Security Copilot with single device query in Intune offers IT admins an easier, more efficient way to monitor and manage devices. With this capability, admins can quickly translate natural language requests into Kusto Query Language (KQL) queries and get real time device data, eliminating the need for in-depth KQL knowledge. For instance, if an admin wants to identify the top 10 processes consuming the most memory on a device, Copilot can automatically convert this request into a precise KQL query. This integration streamlines the process of gathering real-time insights, enabling admins to troubleshoot, optimize, and secure devices more effectively and with greater ease. Use natural language to analyze and query multiple devices With Security Copilot in Intune, IT admins can easily create Kusto Query Language (KQL) queries for multi-device queries, gaining comprehensive insights into their entire device fleet. By navigating to Devices and selecting “Device query” in the Intune admin center, admins can quickly filter devices based on specific criteria. For example, an admin could request a list of devices with at least 8 GB of memory, over 50 GB of storage, and one encrypted volume. Security Copilot translates this natural language request into an accurate KQL query, eliminating the need for advanced KQL knowledge and streamlining the process of managing and securing devices across the organization. What’s next Our AI journey has only just begun, and with each step, we learn and evolve, driven by our commitment to simplifying IT workflows and reducing complexity for customers. We invite you to explore the robust integrations available within Intune where AI assistance transforms everyday tasks like policy management, troubleshooting, device queries, and elevation request evaluation into a more efficient, streamlined process with Copilot. Take advantage of these features today to optimize your security posture and stay ahead of emerging challenges. To get started or learn more about our enhancements visit Copilot in Intune. We look forward to providing further updates in the Copilot in Intune blog series. If you have any questions or want to share how you’re using Copilot in Intune, leave a comment below or reach out to us on X @IntuneSuppTeam or @MSIntune. You can also connect with us on LinkedIn.6.5KViews0likes3Comments
New Diagnostic: Microsoft Teams Shared Channels now available in MRCA
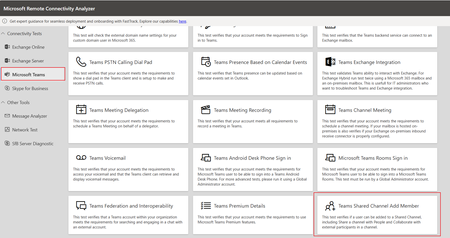
We're excited to release another new diagnostic to the MRCA for troubleshooting issues related to Teams Shared channels. Thanks to RuiTabaresMsft who has done it again this time bringing you a comprehensive Microsoft Remote Connectivity Analyzer diagnostic for Shared channels. To access the customer facing diagnostic, navigate to Microsoft Remote Connectivity Analyzer, select Microsoft Teams, then click on the “Teams Shared Channel Add Member”. Since the release of Shared channels on Teams, one of the common trends reported is the issue related to adding internal and external users to channels. This involves configurations on Teams policies, O365 groups, and Entra B2B Direct Connect, along with additional prerequisites. We discuss the configuration and troubleshooting options in the following article: Collaborate with external participants in a shared channel This new diagnostic will help you troubleshoot and test if you meet requirements for an internal or external user from outside tenant could be added to a shared channel including Share a channel with People and Collaborate with external participants in a channel. At a high level the test checks a few things: Checking the prerequisites for user to be add a member into a shared channel. Validates that the user can generate an authentication token in Microsoft Teams. Verifies that the specified mailbox is supported for the intended operation. Retrieves the user's backend settings which includes configuration settings and preferences associated with the user in Microsoft Teams. Validates the Teams and channel policies related to shared channels. Validates the shared channel URI, retrieves the channel thread, and checks connectivity to chat services. Validates that the group has the AllowToAddGuests setting enabled. Validates that the tenant group settings for the AllowToAddGuests setting is enabled. Retrieves the tenant ID associated with the external user. Validates the cross-tenant access policies (XTAP) to ensure that they permit B2B direct collaboration. Performs a cross-tenant access policy (XTAP) search. Please try the new diagnostic if you're having trouble adding members or sharing a shared channel and let us know if it helped. As always, we welcome your comments, feedback, and questions. Got an idea for a new diagnostic? Issues with this one? Let us know! Thanks! Microsoft Teams Support2KViews0likes0Comments
Custom permission to enable diagnostic setting in Entra ID
Custom permissions doesnt works when tried to enable diagnostic settings, in Microsoft Entra ID portal. Error: "does not have authorisation to perform action 'microsoft.aadiam/diagnosticSettings/write' over scope '/providers/microsoft.aadiam/diagnostic Settings/resourcename" Selective permissions that I applied to user account. My approach is to use custom role specific permissions. Appreciate your help to knows the right permission required. Regards, Rajkumar1.2KViews0likes2Comments
PerfView: ASP.NET Core Stats View
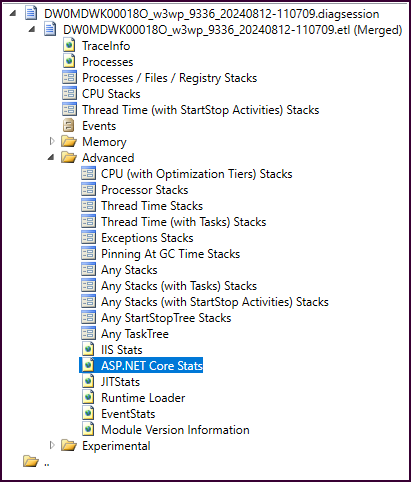
In PerfView v3.1.10, released 02-May-2024, if a trace containing the needed events is opened, there is a new ASP.NET Core Stats view available that shows individual request information along with overall statistics. The events needed to construct this view are available in the .NET Profiler traces that are captured in AppServices (both Windows and Linux) and can be captured manually with other tools like PerfView and dotnet-trace. The view was modeled after the IIS Stats view. It also features clickable ActivityIds for requests so if there's a specific one you want to dig further into, you can click the ActivityId and it will open the Events window and show all events in the trace with that ID within the timeframe of the request.2.3KViews1like0Comments