data lake
31 Topics
Securing Enterprise AI Agents with Microsoft Sentinel
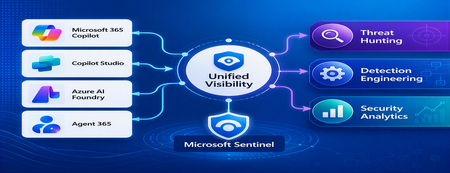
1. Introduction Enterprise adoption of Generative AI is accelerating rapidly through Microsoft 365 Copilot, Copilot Studio, Azure AI Foundry Agents, Security Copilot, and custom AI agents integrated with business applications. Unlike traditional SaaS applications, AI agents can: Access enterprise data Query internal knowledge repositories Invoke APIs and MCP tools Execute workflows Interact with business applications Make decisions on behalf of users While these capabilities improve productivity, they introduce a new attack surface that security teams must monitor and secure. Common AI threats include: Prompt Injection Cross Prompt Injection Attacks (XPIA) Jailbreak Attempts Unauthorized Tool Invocation Data Exfiltration through AI Agents Agent Identity Abuse Excessive Data Access Malicious MCP Tool Execution Traditional SOC monitoring platforms were designed for users, devices, applications and infrastructure—not autonomous AI systems. To address this challenge, Microsoft provides a comprehensive AI security monitoring framework built around: Agent 365 Observability Microsoft Agent Identities Microsoft Copilot Logs Defender XDR Defender for AI Microsoft Sentinel Together these components provide end-to-end observability of: User prompts Agent execution paths Tool invocations Safety signal detections Agent identities Security alerts 2. Reference Architecture AI Security Monitoring Architecture 3. Integration Architecture Microsoft provides multiple telemetry sources that complement one another. 3.1 Agent Runtime Telemetry Sentinel Data Connector Agent 365 Data Connector Table UnifiedAgentObservability Captures runtime behavior of AI agents including: User prompts Session IDs Conversation IDs Agent identities MCP tool invocations Connector invocations Tool arguments Tool responses Request payloads Response payloads Execution errors This dataset provides the forensic trail of everything an AI agent performed. 3.2 Agent Governance and Asset Inventory Sentinel Data Connector Microsoft Agent Identities Provides visibility into: Agent inventory Agent blueprint inventory Ownership Relationships Governance metadata Risk context This allows SOC teams to answer: Who owns this agent? What permissions does it have? Which business unit deployed it? Which related agents exist? 3.3 Copilot Audit and Usage Monitoring Sentinel Data Connector Microsoft Copilot Logs Connector Table CopilotActivity Provides: Copilot usage auditing Operational visibility User interaction tracking Useful for governance, compliance and adoption reporting. 3.4 AI Safety Telemetry Sentinel Data Connector Microsoft Defender XDR Connector Table CloudAppEvents CloudAppEvents provides AI safety signals such as: Prompt Shield detections Prompt Injection attempts Cross Prompt Injection Attacks (XPIA) Jailbreak-related verdicts Unsafe prompt classifications Think of CloudAppEvents as answering: "Was the prompt malicious?" 3.5 AI Security Alerts Sentinel Data Connectors Microsoft Defender XDR Microsoft Defender for Cloud Tables SecurityAlert SecurityIncident Used for: AI attack detections Security incidents Correlated investigation workflows 4. Understanding the Two Most Important AI Tables CloudAppEvents Focuses on AI Safety Questions answered: Was Prompt Shield triggered? Was this a jailbreak attempt? Was XPIA detected? Was the prompt suspicious? UnifiedAgentObservability Focuses on Agent Runtime Behavior Questions answered: What tool was invoked? Which connector executed? What arguments were passed? What data was returned? What actions did the agent perform? 5. Advanced Threat Hunting Scenarios The Agent365 Observability hunting guide contains several investigation scenarios that can be used directly in Microsoft Sentinel. Reference: Agent 365 Observability — AI Agent Telemetry Hunting https://github.com/SCStelz/security-investigator/blob/main/queries/cloud/agent365_observability.md 5.1 Prompt Injection Detection Detect prompts containing indicators such as: Ignore previous instructions Reveal system prompt Developer mode Disregard safety controls Investigation workflow: Review Tool Activity This allows analysts to determine whether a suspicious prompt resulted in downstream actions. 5.2 Session Reconstruction One of the most powerful capabilities of UnifiedAgentObservability is session reconstruction. Analysts can correlate: This creates complete forensic timelines. 5.3 MCP Tool Auditing Monitor all MCP activity including: query_lake Graph API tools ServiceNow connectors SharePoint connectors Custom enterprise tools Questions answered: Which tool was used? Who triggered it? What parameters were supplied? What data was returned? 5.4 Sensitive Data Access Monitoring Monitor AI agent interaction with: Employee records Customer data Financial information SharePoint repositories HR databases Useful for identifying: Data exfiltration attempts Excessive access patterns Sensitive data exposure 5.5 Query Lake Monitoring The GitHub hunting guide introduces monitoring of: query_lake RunAdvancedHuntingQuery Analysts can inspect: Actual KQL submitted Target workspaces Data sources queried Scope of access This provides visibility into AI-driven security investigations. 5.6 New Tool Detection Identify newly observed tool usage. Examples: Unauthorized MCP servers Newly registered connectors Unapproved tools Unexpected integrations This use case is particularly useful for governance programs. 5.7 Tool Failure Monitoring Monitor: Permission failures Connector failures Application errors Access-denied responses A sudden increase in failures may indicate: Reconnaissance activity Misconfiguration Privilege abuse attempts 6. Detection Engineering Opportunities Organizations can create Sentinel Analytics Rules for: 6.1 Prompt Injection Detection Developer Mode prompts Prompt Override attempts System Prompt disclosure requests 6.2 Jailbreak Attempt Detection Safety bypass attempts Role manipulation prompts Instruction override patterns 6.3 Unauthorized Tool Usage New MCP tools High-risk connectors Rare tool executions 6.4 Sensitive Data Access HR data queries Identity information retrieval Large-volume exports 6.5 Agent Identity Abuse Ownership changes Unexpected agent activity Agent-to-agent anomalies 7. Data Lake Exploration and Long-Term Analytics Because agent telemetry resides within Sentinel Data Lake, organizations can perform: Long-term AI investigations Historical AI attack analysis Agent baselining Governance reporting Trend analysis Tool inventory reporting Example dashboards include: Top Prompt Injection Attempts Most Active Agents High-Risk MCP Tools Agent Ownership Analysis AI Security Incidents Sensitive Data Access Trends 8. Summary AI agents represent the next major computing platform, but they also introduce a completely new attack surface. To effectively secure enterprise AI solutions, organizations require visibility across: User interactions Agent execution paths MCP tool usage Prompt safety signals Agent identities Security detections Microsoft Sentinel provides this unified view by integrating: Agent 365 Observability UnifiedAgentObservability Microsoft Agent Identities Microsoft Copilot Logs CloudAppEvents Defender XDR Defender for AI By combining AI runtime telemetry with AI safety signals and Defender detections, security teams can move beyond traditional monitoring and build a modern SOC capability for threat hunting, incident response, governance and forensic investigations across Microsoft 365 Copilot, Copilot Studio, Azure AI Foundry and future AI agent ecosystems. Reference: https://github.com/SCStelz/security-investigator/blob/main/queries/cloud/agent365_observability.mdBuild and Optimize a Data Lakehouse for Unified Data Intelligence
Hello Folks! Welcome back to the ITOpsTalk Blog and the Microsoft Azure Infrastructure Summit 2026 series. In this session James Baker and Sai Runtham, both from the Azure Data Lake Storage product team, take us through what a modern Lakehouse actually is, how to design one on Azure, and then they roll up their sleeves and build one end to end. If you have been hearing “Lakehouse” thrown around in architecture reviews and were not 100% sure what it changes for you as an IT Pro, this one is for you. 📺 Watch the session: Why IT Pros Should Care You might be thinking, “I run infrastructure, not analytics.” Fair point. But here is the thing. The lakehouse is increasingly the platform your business will run BI dashboards, AI agents, and decision support systems on, and you are the one who has to keep the data safe, governed, and reachable. Here is what is in it for you: It is a platform conversation. James spends a big chunk of the session on horizontal platform capabilities (storage, catalog, identity, secrets, network, policy) versus vertical pipeline concerns. That is squarely an IT Pro problem. Data is the asset. Workspaces, query engines, and dashboards are transient. The data lives forever, and protecting it is on your plate. Governance is what stops your data lake from rotting into a data swamp. Scale is a virtuous cycle. More data drives more insight, which drives more data. Your platform cannot become the ceiling. AI agents are the new consumers. They do not just read dashboards, they query gold tables directly. Your network, identity, and access controls have to keep up. What is a data lakehouse A data lakehouse is exactly what it sounds like. You take the cheap, flexible, schema-light scale of a data lake, and you fuse it with the low-latency query performance, update semantics, and governance of a data warehouse. One copy of the data. One place to govern it. No more forking from the lake into a warehouse just to make BI tools happy. Quick contrast: Data lake. Big, cheap, flexible. No schema enforced on write. Historically prone to becoming a swamp. Data warehouse. Low-latency queries, updates, strong governance, structured. Hits a scale ceiling and costs more. Data lakehouse. Lake-scale storage, with a high-performance query layer and warehouse-grade governance sitting over the top. No data fork. The big shift is that the data does not move. Your BI dashboards, your AI agents, your serverless SQL queries, they all hit the same governed tables in the lake. That keeps lineage clean and your security model sane. Building it on Azure James and Sai are clear that the architecture is less a fixed diagram and more a list of platform capabilities you compose. Here is the shape of it on Azure. Storage layer (the asset). Azure Data Lake Storage Gen2 (ADLS) with hierarchical namespace turned on. That is non-negotiable for analytics workloads. It gives you atomic directory operations, POSIX-style ACLs, and the performance Delta Lake relies on. OneLake in Microsoft Fabric if you want a tenant-wide logical lake that is built on ADLS Gen2 and stores everything in open Delta Parquet by default. Table format and pipelines. Open table formats: Delta Lake (and Apache Iceberg as it converges) give you ACID transactions, time travel, schema evolution, and streaming on cheap object storage. Azure Databricks Lakeflow Declarative Pipelines with Autoloader for incremental ingestion of both batch and streaming sources straight into Delta tables. Autoloader handles new file discovery, schema inference, and evolution for you. The medallion architecture for stamping out repeatable pipelines: o Bronze. Raw, append-only landing zone. Source of truth. o Silver. Cleansed, deduplicated, conformed, enriched. o Gold. Business-ready, aggregated, performance-optimized for consumption. Governance and identity. Unity Catalog as the single source of truth for catalog, lineage, and fine-grained access control across bronze, silver, and gold. Entra ID for identity. Managed identities for compute. Key Vault for secrets. Network protection around the perimeter. The data is the crown jewel, so private endpoints, firewalls, and VNet-attached compute are baseline. Consumption layer. Power BI Direct Query against a serverless SQL warehouse on the gold tables. No data copies, governance flows through. AI agents like Databricks Genie pointed at gold tables. Natural-language questions, live lineage, no data movement. The demo that ties it together. Sai walked through a real pipeline: NYC TLC taxi trips enriched with NOAA weather and ESPN/MLB sports events, ingested by Autoloader into bronze, transformed through silver, aggregated into gold. A parallel streaming pipeline handled synthetic live events for a real-time demand view. Power BI dashboards hit gold via Direct Query. And Genie answered questions like “which zones are most sensitive to sport events” by mapping demand around Madison Square Garden, with the query and the chart generated for you. All against the same lakehouse, no data movement, full lineage. Optimizing for cost and performance This is where a lot of lakehouses go sideways. A few things from the session and from the official guidance worth pinning to your wall: Get hierarchical namespace right. It is the difference between atomic directory operations and “copy then delete,” which is slow and expensive at scale. Use storage tiers and lifecycle policies. Hot for working data, Cool or Cold for older partitions, Archive for compliance retention. Lifecycle rules on ADLS do this automatically. Partition and file-size matter. Lots of tiny files kill query performance. Use OPTIMIZE, Z-Order, or liquid clustering on Delta tables, and partition on the columns your queries actually filter on. Lean on vectorized reads. ADLS plus Delta plus modern query engines push a lot of work down to columnar Parquet, which keeps your compute bill in check. Use serverless SQL warehouses where it fits. Direct Query against a serverless endpoint scales compute to demand and lets you keep dashboards fresh without import refreshes. Observe data, not just systems. “Is Databricks up” is necessary but not sufficient. Watch data freshness, row counts, pipeline blockages, and SLAs on the data itself. Govern everything. A well-governed lakehouse drives trust, which drives use, which drives value. Skipping governance early always costs more later. Getting Started If you want to put hands on a keyboard this week: Spin up an Azure Storage account with hierarchical namespace enabled. That is your ADLS Gen2 foundation. Stand up an Azure Databricks workspace, enable Unity Catalog, and point it at your ADLS account. Create a Lakeflow Declarative Pipeline. Use Autoloader to ingest a sample dataset (the NYC taxi data is a classic starting point) into a bronze Delta table. Add silver and gold notebooks or pipelines that clean and aggregate the data. Connect Power BI to a serverless SQL warehouse on your gold tables with Direct Query. If you are a Fabric tenant, mirror or shortcut data into OneLake and try the same pattern there, no infra to manage. Read the Hitchhiker’s Guide to ADLS before you scale up. It will save you future you a lot of grief. Resources Introduction to Azure Data Lake Storage The Hitchhiker’s Guide to the Data Lake Microsoft OneLake documentation Azure Databricks documentation Delta Lake on Azure Databricks Design Delta Lake architecture and medallion patterns Implement medallion lakehouse architecture in Microsoft Fabric Watch the rest of the Summit This session is one stop on a big tour. The full Microsoft Azure Infrastructure Summit 2026 playlist covers everything from sovereign cloud and AKS networking to backup, storage, and AI-assisted operations. If your job touches Azure, there is something in here for you. Head over to the full playlist and binge what is useful: https://www.youtube.com/playlist?list=PLjt5SKzX1iI8con7FJDB56G6hHqxGm7ki Cheers! Pierre Roman629Views1like1CommentUsing Microsoft Sentinel MCP Server with GitHub Copilot for AI-Powered Threat Hunting
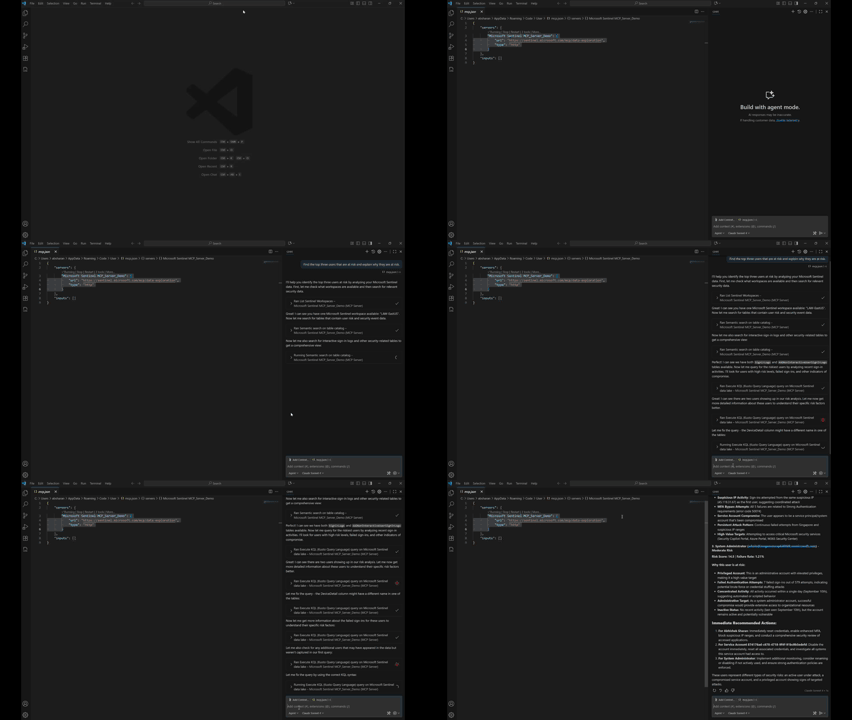
Introduction This post walks through how to get started with the Microsoft Sentinel MCP Server and showcases a hands-on demo integrating with Visual Studio Code and GitHub Copilot. Using the MCP server, you can run natural language queries against Microsoft Sentinel’s security data lake, enabling faster investigations and simplified threat hunting using tools you already know. This blog includes a real-world prompt you can use in your own environment and highlights the power of AI-assisted security workflows. What is the Microsoft Sentinel MCP Server? The Model Context Protocol (MCP) allows AI models to access structured security data in a standard, context-aware way. The Sentinel MCP server connects to your Microsoft Sentinel data lake and enables tools like GitHub Copilot or Security Copilot to: Search security data using natural language Summarize findings and explain risks Build intelligent agents for security operations Prerequisites Make sure you have the following in place: Onboarded to Microsoft Sentinel Data Lake Assigned the Security Reader role Installed: Visual Studio Code GitHub Copilot extension (Optional) Security Copilot plugin if building agents Setting Up MCP Server in VS Code Step 1: Add the MCP Server In VS Code, press Ctrl + Shift + P Search for: MCP: Add Server Choose HTTP or Server-Sent Events Enter one of the following MCP endpoints: Use Case Endpoint Data Exploration https://sentinel.microsoft.com/mcp/data-exploration Agent Creation https://sentinel.microsoft.com/mcp/security-copilot-agent-creation Give the server a friendly name (e.g., Sentinel MCP Server) Choose whether to apply it to all workspaces or just the current one When prompted, Allow authentication using an account with Security Reader access Verify the Connection Open Chat: View > Chat or Ctrl + Alt + I Switch to Agent Mode Click the Configure Tools icon to ensure MCP tools are active Using GitHub Copilot + Sentinel MCP Once connected, you can use natural language prompts to pull insights from your Sentinel data lake without writing any KQL. Demo Prompt: 🔍 “Find the top three users that are at risk and explain why they are at risk.” This prompt is designed to: Identify the highest-risk users in your environment Explain the reasoning behind each user's risk status Help prioritize investigation and response efforts You can enter this prompt in either: VS Code Chat window (Agent Mode) Copilot inline prompt area Expected Behavior The MCP server will: Query multiple Microsoft Sentinel sources (Identity Protection, Defender for Identity, Sign-in logs) Correlate risk events (e.g., risky sign-ins, alerts, anomalies) Return a structured response with top users and risk explanation Sample Output from My Tenant Results Found: User 1: 233 risk score - 53 failed attempts from suspicious IPs User 2: 100% failure rate indicating service account compromise User 3: Admin account under targeted brute force attack This demo shows how the integration of Microsoft Sentinel MCP Server with GitHub Copilot and VS Code transforms complex security investigations into simple, conversational workflows. By leveraging natural language and AI-driven context, we can surface high-risk users, understand the underlying threats, and take action — all within a familiar development environment, and without writing a single line of KQL. More details here: What is Microsoft Sentinel’s support for MCP? (preview) - Microsoft Security | Microsoft Learn Get started with Microsoft Sentinel MCP server - Microsoft Security | Microsoft Learn Data exploration tool collection in Microsoft Sentinel MCP server - Microsoft Security | Microsoft Learn
Designing system to enable Adhoc queries
Hi, we are designing a data processing system in which the data goes through three different stages as shown below. What azure platforms or technologies do you recommend for a dynamic scenario like the one below where the input file format can change all the time, the transformations applied are not standard and the reports generated vary every time? Extract Data size can be around 1 GB. Can be of various formats and from various sources like FTP, API etc. Transform Transformations are applied on the data. Results After the transformations, results are exported to a final report table from which reports are generated.1.2KViews0likes1Comment