charting
1706 Topics
GLSU Excel add-in fails to load after Office update from Version 2607 to 2608
Our Excel add-in, Process Runner GLSU , fails to load after Microsoft Office updates from Version 2607 to Version 2608. This started August 17, 2026 and is actively growing in scope. Error messages: Excel: Cannot run the macro 'onLoad' VBA: System Error &H80004005 (-2147467259). Unspecified error VBA: Compile error in hidden module: ThisWorkbook Has anyone encountered similar issue with their own custom add-on. If yes, any pointers to fix it. We are seeking help on priority. Thanks, Vrushali Pawale, Sr. Manager, Insightsoftware.596Views0likes1Comment
No clustering in clustered bar chart when secondary axis is added
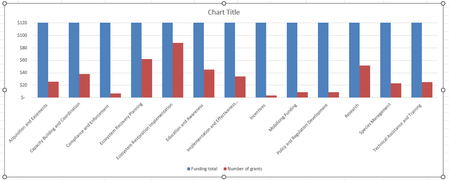
Hi there, I've got a clustered bar chart with two data series, one of which needs a much smaller scale than the other. It looks fine as long as I don't add the secondary axis (see pic). Note that here I've made the y-axis range so small that you can see the second series. Displaying the full range of the first series results in the second series being invisible. Here you can't see the full range of the first series, so this won't work for my purposes. When I add the secondary axis, I get this (see pic) and I don't see any way to avoid it. It seems like it might be a bug. Adjusting the overlap or the gap width doesn't help. Anyone have any suggestions? Thank you!!Solved538Views0likes3Comments
Data Triggers
I'm relatively new to spreadsheets and excel. I'm working with a spreadsheet for mileage allocation. The mileage is funded from a single source but allocated to several people. In the spreadsheet, is it possible for the alpha entry in, for instance, column "C" cause the data in column "B" to populate in columns "D", "E". or "F" depending on the entry in column "C"? Example. Can the mileage cash value that's populated in column "B" get sent to a cell in either columns "D", "E", or "F" according to the name inserted in column "C" Entry "John" would cause B to populate D; "Dave" would cause B to populate E and "Jane would cause B to populate F so I can tally each person's share of the mileage without having to re-enter that amount in each of the columns? Any help in this would be appreciated.116Views0likes1CommentUnable to stop values field from calculating in pivot tables
Hello. I’ve created a pivot table where all the other fields are set up correctly. However I am unable to just include data in the “values” without it performing a calculation. Tried multiple times to select “no calculation” but doesn’t seem to work. Device is MacBook Pro. Excel 201610KViews0likes9CommentsWhich postal codes are available on cartogram chart
I want to show some data on the cartogram chart - thousands of records which belong to certain postal codes. Basically this works fine using the cartogram chart. I have a Country row, postal code row and a value row. The problem is that some postal codes are not known (Germany and Austria) but they are found in e.g. USA (even though I do use the country row). This makes the chart impossible to use because instead of Germany I see nearly the whole world. Land PLZ Wert Deutschland 80331 20 Deutschland 80333 20 Deutschland 80335 20 Deutschland 80336 20 Deutschland 80337 20 Deutschland 80339 20 Deutschland 80469 20 Deutschland 80538 20 Deutschland 80539 20 Deutschland 80634 20 Deutschland 80636 20 Deutschland 80637 20 Deutschland 80638 20 Deutschland 80639 20 Deutschland 80686 20 Deutschland 80687 20 Deutschland 80689 20 Deutschland 80796 20 Deutschland 80797 20 Deutschland 80798 20 Deutschland 80799 20 Deutschland 80801 20 Deutschland 80802 20 Deutschland 80803 20 Deutschland 80804 20 Deutschland 80805 20 Deutschland 80807 20 Deutschland 80809 20 Deutschland 80933 20 Deutschland 80935 20 Deutschland 80937 20 Deutschland 80939 20 Deutschland 80992 20 Deutschland 80993 20 Deutschland 80995 20 Deutschland 80997 20 Deutschland 80999 20 Deutschland 81241 2 Deutschland 81243 2 Deutschland 81245 2 The above data works nice - but change the postal code from e.g. 81243 to 81242... Any hint how to either remove not working postal codes or show just Germany/Austria on the cartogram chart?613Views1like2Comments
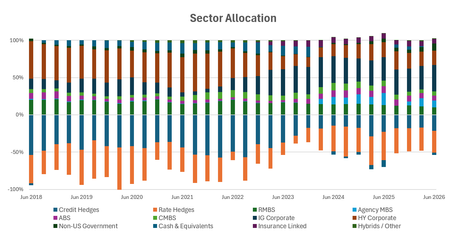
Spacing on stacked bar charts
Hi all, I searched for a solution, but changing to 'text' axis doesn't work and that's the only solution I have seen offered. Issue: When using a date axis, there is too much white space / bars are too skinny to be legible despite gap width set all the way at 0. When switching to a text axis, the bar spacing is perfect, but the spacing between dates are at times nonsensical or for some reason it thinks the range is way different than what is highlighted. Here is how the data is highlighted, I only hid columns to make the picture a reasonably proportion the screenshots from above are when no columns are hidden. Is there a way to re-scale the gap-width when using a data axis to effectively to go something like -50%? Or to somehow manipulate the range and the months between labels when using a text axis? Thank you for the help. Matt221Views1like5Commentsmulti Vehicle maintenance log record
i need to make a vehicle maintenance log that will have 7 different vehicles, track all the oil changes, inspections, registrations that will notify us when something is expiring, and be able to attach receipts and documents to it. what is the best way to do this?20KViews0likes3Comments
OPENED FILE AND ALL CHARTS WERE MISSING
So, I have been using this spreadsheet since 2014 and have always upgraded it to stay current. I had a file in Jan 2024 that I added data to and saved. Last month (Apr), I opened the file to add new data as I always have, and all my charts were gone. I've searched and cannot fight how these charts were deleted. It was not me. I've looked for fixes and there is little to no similar issue to mine unless my search was weak. I'm looking for ideas, and while I am not a computer engineer, I know Excel and lots more. I already tried the options, checkmark solution. Thanks in advance charley4KViews0likes3Comments
Chart from Date, Time, Temperature and Humidity
I have data from a temperature sensor that I want to create a chart from. The data is: Date,Time,Temperature_Celsius,Relative_Humidity(%), and it arrives as a .csv file. If it's just a single date, then I can easily produce a line chart by ignoring the date column. However the data will likely be for several days at a time. So how do I create a line chart with the date and time as one value on the x-axis? If I can do that, the values on the y-axis will not be a problem. I think it could be done by combining data and time into a single value, but I can't find how to do that, and then format the x-axis so it shows each day separately with the times as minor values. Here's some of the data: Date Time Temperature_Celsius Relative_Humidity(%) 01/07/2026 12:00 am 20.8 61 01/07/2026 12:30 am 20.7 61 01/07/2026 1:00 am 20.7 61 01/07/2026 1:30 am 20.6 61 01/07/2026 2:00 am 20.5 61 01/07/2026 2:30 am 20.5 61 01/07/2026 3:00 am 20.4 61 01/07/2026 3:30 am 20.4 61 01/07/2026 4:00 am 20.3 61 01/07/2026 4:30 am 20.3 61 01/07/2026 5:00 am 20.2 61 01/07/2026 5:30 am 20.2 60 01/07/2026 6:00 am 20.1 60 01/07/2026 6:30 am 20.1 60Solved195Views0likes2Comments